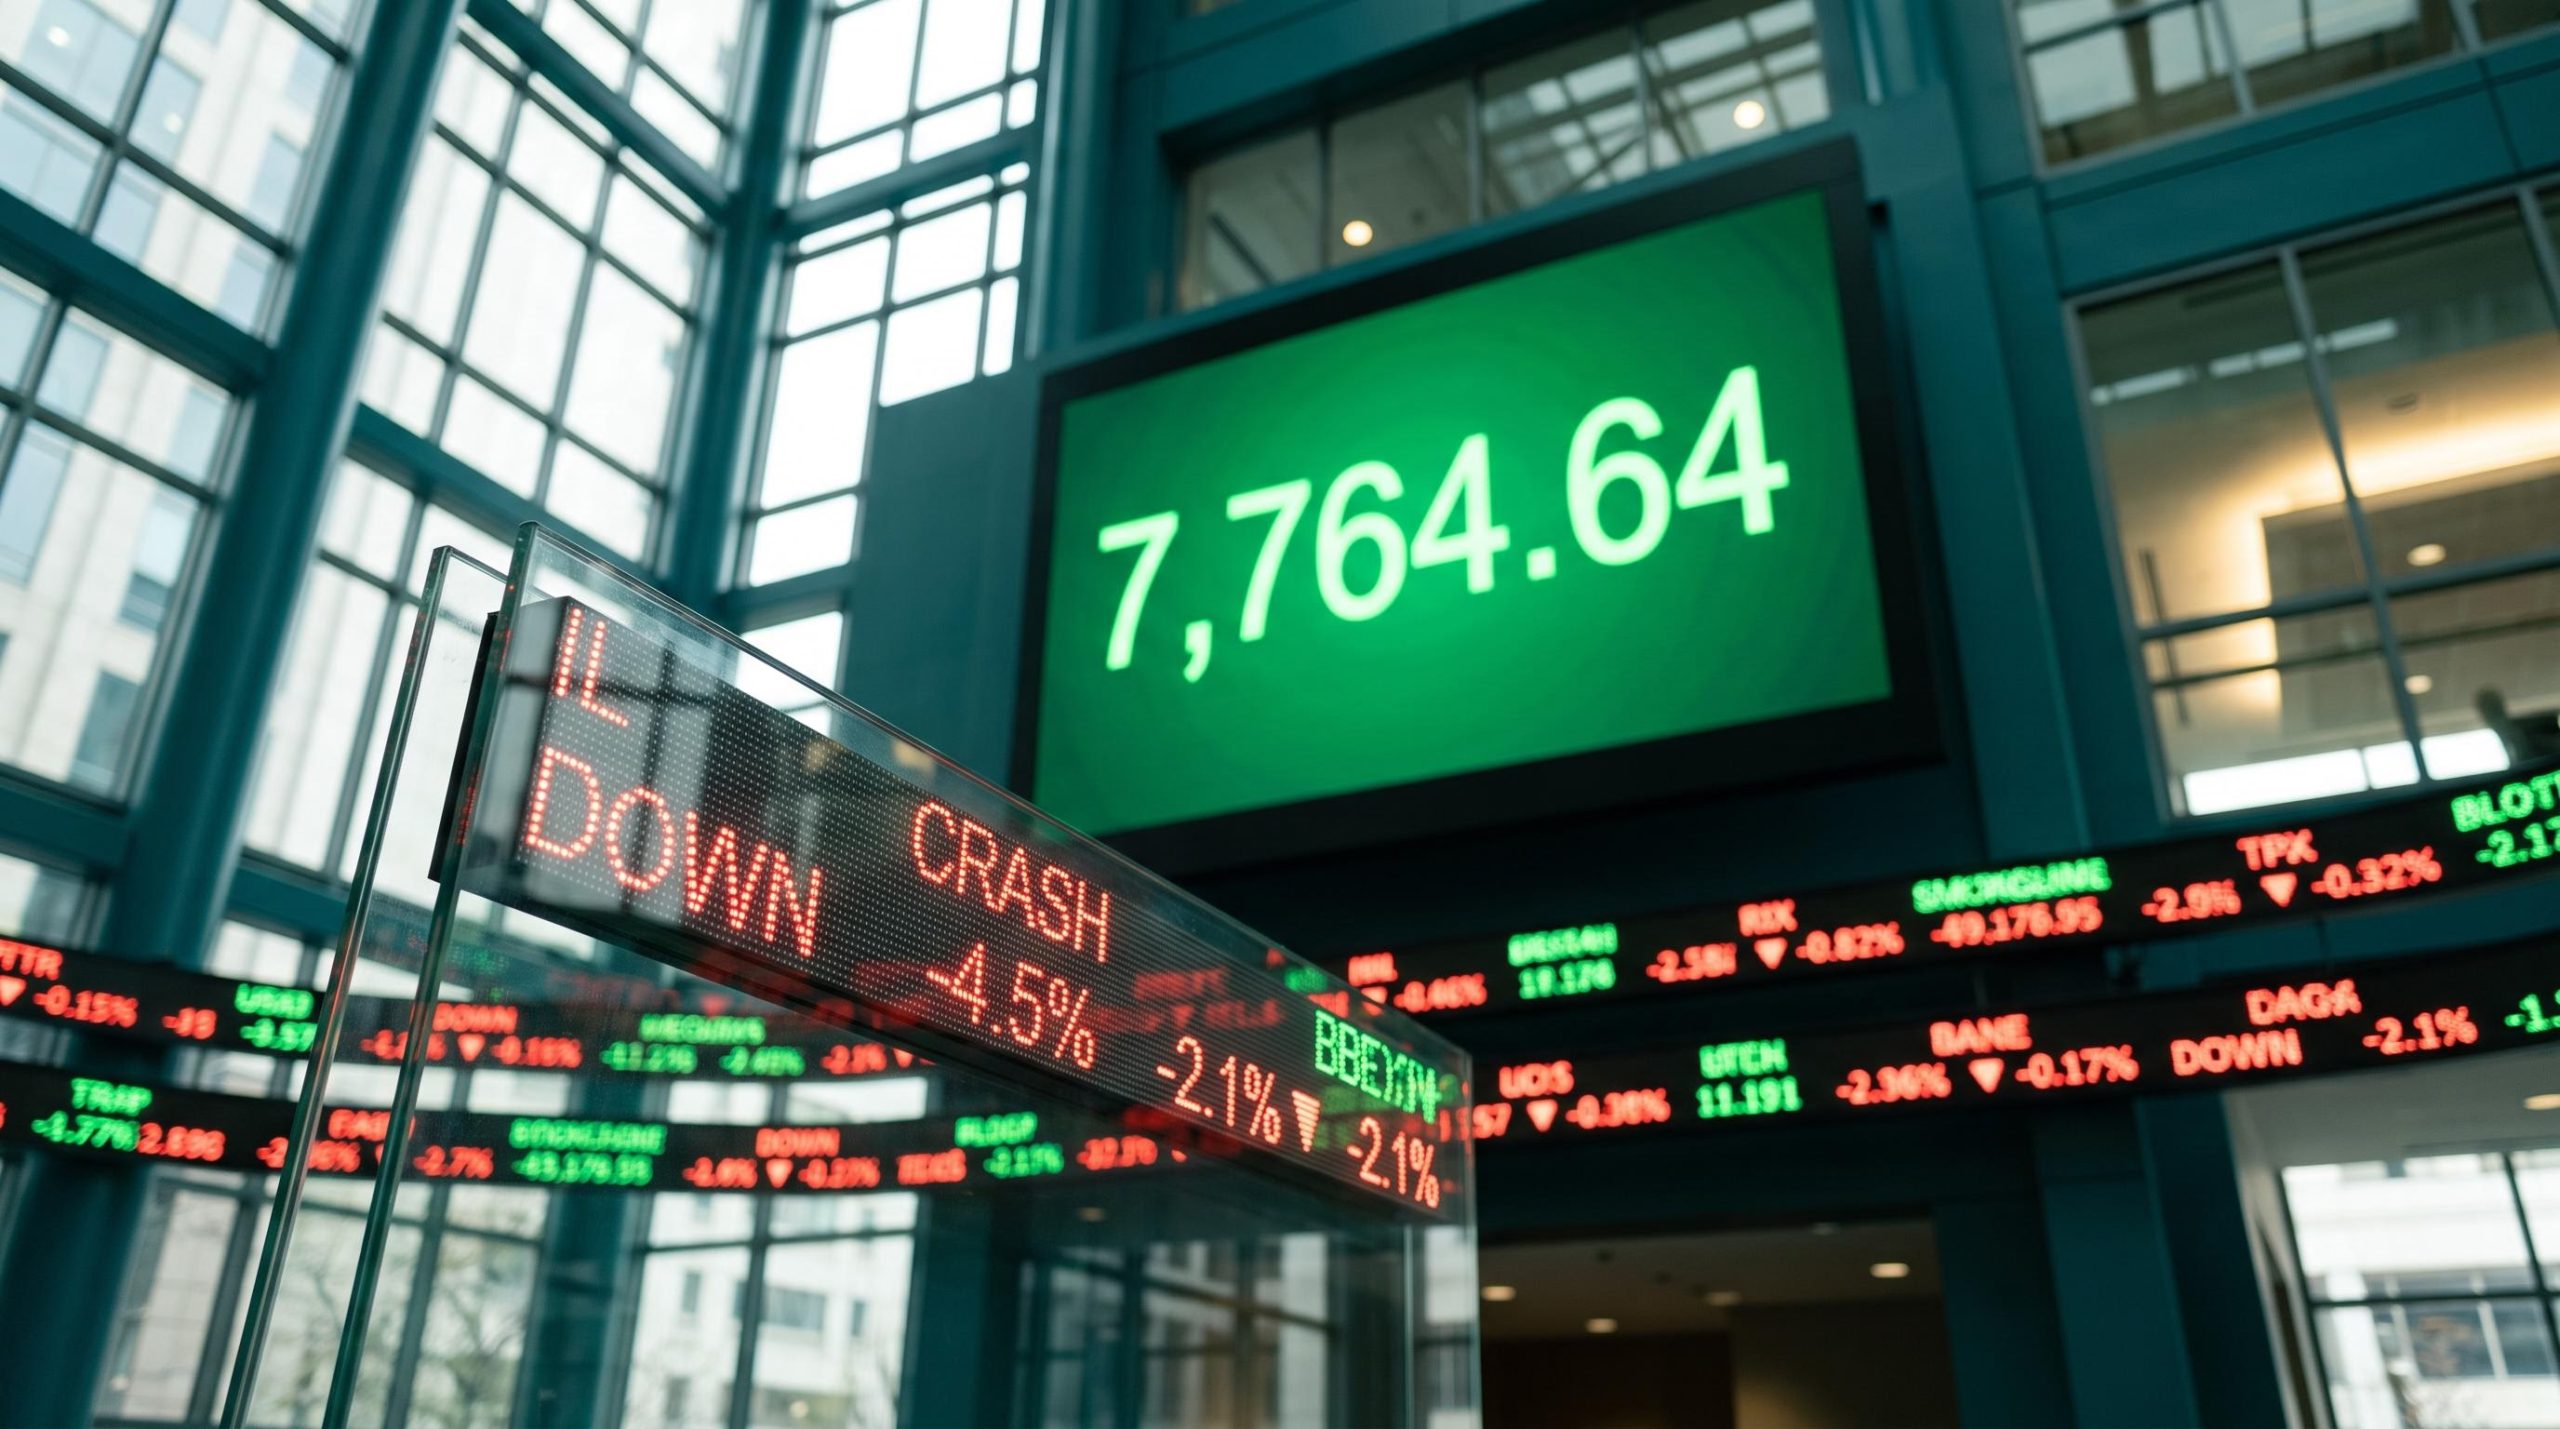
A green screen feels like good news. The S&P 500 sits within a fraction of its 13 August record and is up about 14% for 2026, yet more than four in ten of its stocks are down for the year and the median stock has gained only about 4%, according to Reuters. That gap is where trendless market analysis earns its place in your toolkit.
The timing matters. As of 21 October 2026, rallies keep fading within the first hour of trading, semiconductors are leaning on a key support level, and some country funds are quietly rolling over.
One market commentator described the S&P as “roughly flat over about 80 days.” That overstates it. A fairer reading is limited net progress near record highs since the August peak, with sharp rotation churning underneath.
Here is a practical way to read support, chart patterns and breadth when the index itself tells you very little. You will also see the framework applied to three live charts: SMH (semiconductors), FXI (China) and EWW (Mexico).
Why does a green index hide a fragile, trendless market?
Start with the reassuring part. The S&P 500 closed at 7,764.64 on 22 September, less than 0.5% below its record, and it remains up 14% for the year.
Now look one layer down. Reuters reported on 12 October that over 40% of index components were in the red for 2026, and the median stock was up roughly 4%. A small group of chipmakers and AI heavyweights is doing most of the lifting.
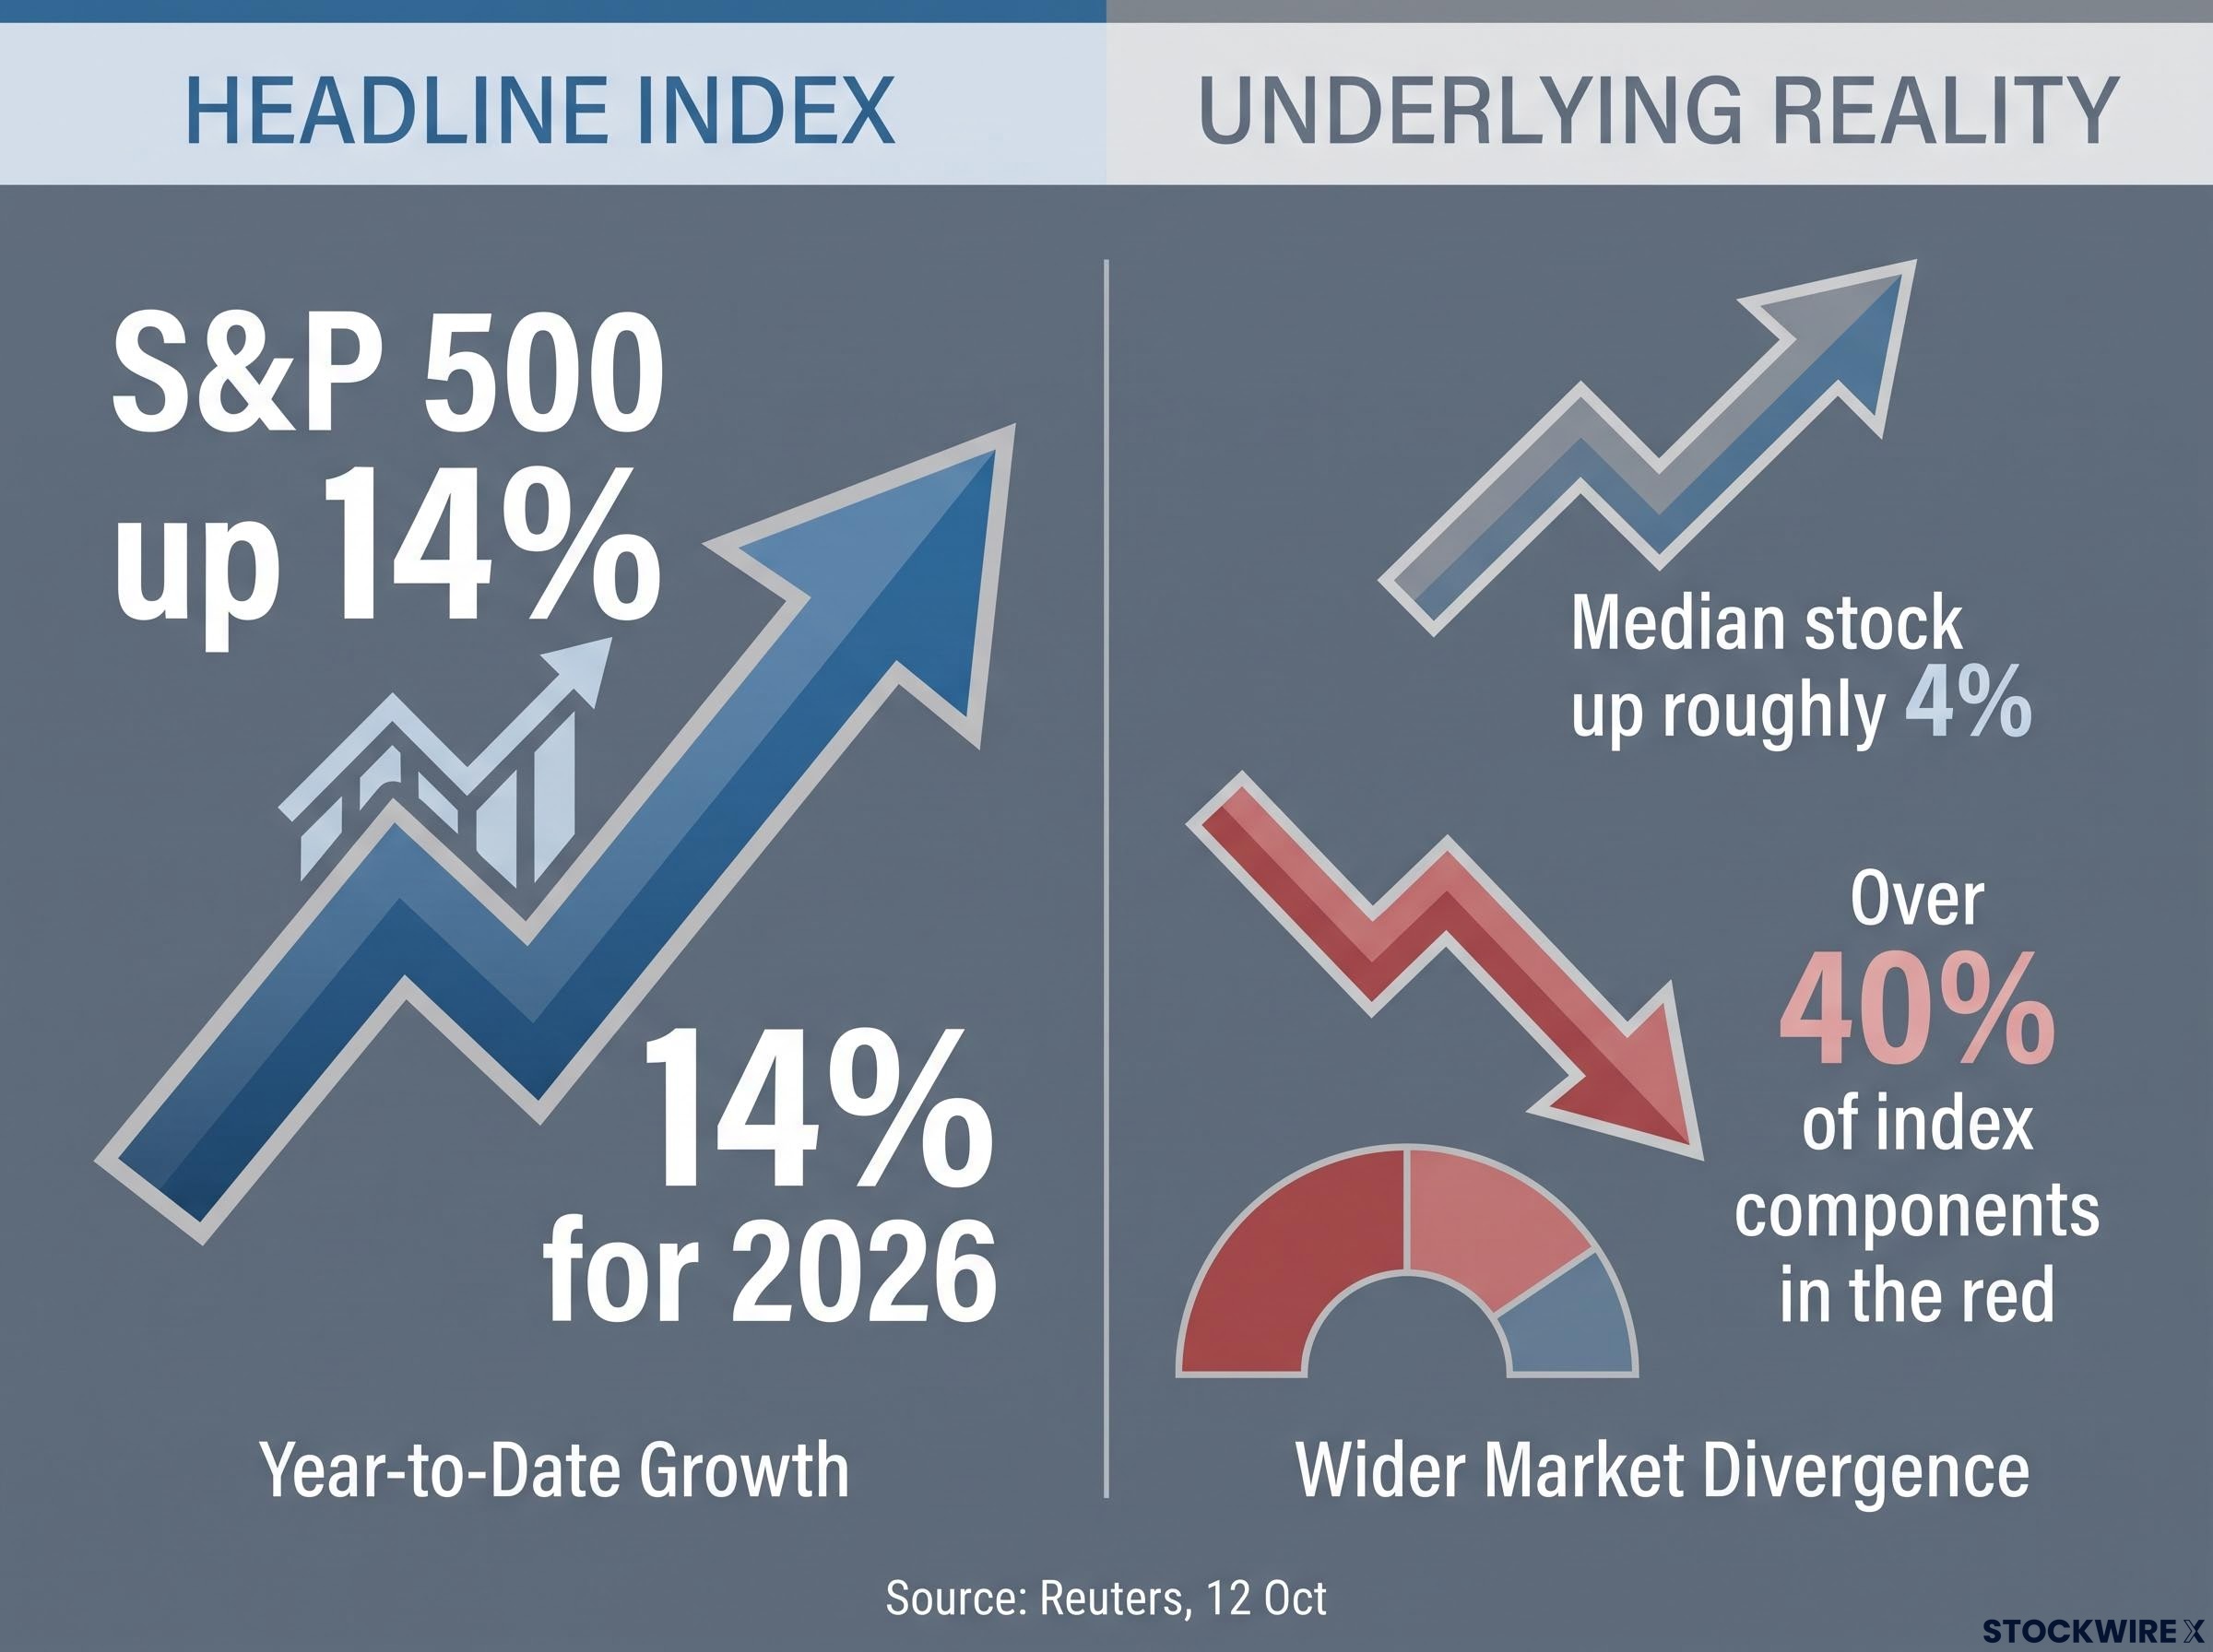
A trendless market is one where an index makes little net progress while rotation and volatility beneath it stay high. The index can look calm while the individual stocks you own swing hard.
Breadth warning Goldman Sachs strategist Ben Snider said breadth is near its narrowest since the dot-com bubble. He argued it tends to resolve either by leaders “catching down” or laggards “catching up”, which leaves momentum leadership exposed either way.
Breadth refers to how many stocks are participating in a move. Narrow breadth means few stocks are carrying the index.
With only about 32% of S&P 500 stocks above their 50-day average while SPY is up 14%, weak market breadth shows how a calm headline index can hide a narrow rally that depends on a few leaders.
The price action adds to the unease. Early strength has repeatedly faded, with Nasdaq futures up just over 0.5% before giving it back, and a three-day rally pulled back even after strong SpaceX earnings. Rosenblatt’s Michael James called the recent chip rebound an oversold bounce rather than proof of a healthy market.
| Example | Headline | Underlying reality | Source |
|---|---|---|---|
| US equities, Oct 2026 | S&P 500 up 14% YTD, near records | Over 40% of stocks down; median up about 4% | Reuters, 12 Oct |
| US equities, Aug-Sept 2026 | Indexes at or near records | SMH fell more than 3% in one week | CNBC, 27 Aug |
| China, 2026 | Q3 GDP up 4.5% | FXI below key moving averages | Reuters, 19 Oct |
What makes a rally fragile
- Single-theme dependence: gains rely on one story, such as AI.
- Narrow participation: few stocks drive the index.
- Weak volume: fewer shares change hands as prices rise.
- Quick reversal on good news: positive catalysts fail to hold.
When the headline index and the median stock disagree, treat the index as a statement about a handful of leaders, not about the market you actually hold.
When big ASX news breaks, our subscribers know first
How do traders read support, trendlines and chart patterns?
If the index cannot tell you much, the chart of each instrument has to. Each tool below shows up as a shape or level on a price chart, and each comes with limits.
Support and resistance as zones
Fidelity describes support as a zone where demand may increase as prices fall, and resistance as a zone where supply may increase as prices rise. Buyers who missed earlier lows often step in near those levels, while sellers who bought near past peaks look to exit.
The key word is zone. Price can poke through intraday and recover, and Fidelity cautions that range trading fails the moment price leaves the range.
Patterns that warn, and why they need confirmation
A trendline is a line drawn across a series of highs or lows; a close through it suggests the structure is weakening. A symmetrical triangle forms when falling highs and rising lows converge, signalling indecision that will eventually break one way.
A shooting star is a single candle with a small body and a long upper shadow, closing near its open. Near resistance, it can warn that buyers ran out of steam. A long top is a multi-month stretch of failed rallies and lower highs.
| Concept | What it signals | Limitation |
|---|---|---|
| Support | Area where buyers previously appeared | A zone, not a guarantee; can fail |
| Resistance | Area where sellers previously won | Can be pierced and reclaimed |
| Failed trendline | Weakening price structure | Anchor points are subjective; false breaks common |
| Symmetrical triangle | Contracting range, indecision | Direction unknown until the break |
| Shooting star | Possible failed upside momentum | Not predictive on its own |
| Long top | Repeated failure near highs | Can still resolve upward |
| Moving-average breakdown | Fading momentum, possible systematic selling | Averages lag and whipsaw in ranges |
No universal failure rate exists for these patterns. Practitioner material stresses confirmation instead: a close beyond the boundary, rising volume and follow-through in later sessions.
A range break only counts with a close beyond the level, rising volume, breadth and multi-session follow-through, which is why a single intraday poke through support rarely settles the question.
That means a pattern should change your position size and your plan, not your certainty, because the same shape can resolve in either direction.
What do SMH, FXI and EWW show about these setups in practice?
The toolkit gets more useful when you watch it work on real charts. Each of these three tells a different story.
SMH: the 536 support test
The VanEck Semiconductor ETF (SMH) has traded below a broken trendline, with $536 acting as the floor. One commentator said price has bounced off it “like a trampoline” through summer and into autumn.
On 20 October, the regular session ranged from $536.23 to $553.83, so the low effectively tested support. After hours, SMH traded at $558.50, about 4.2% above that level. No break yet.
The bounce, in context Rosenblatt’s Michael James described the chip rebound as an oversold bounce driven by excessively negative sentiment, adding that the market remained far from clear.
The tug of war is real. Micron reported $32 billion of long-term supply commitments, while worries about debt-funded AI spending fed the 13 October selloff. A decisive close below 536 would turn a tested floor into a failed one.
FXI: a slow top below the averages
The iShares China Large-Cap ETF (FXI) sits at $33.44, down 12.48% year-to-date and below its 10, 50 and 200-day moving averages ($33.87, $34.67 and $35.99). Its 2 October low was $33.08.
Return data conflicts: one source shows a three-month decline of 4.37% as of 21 October, another -0.41% as of 15 October. End dates and return methodology explain most of the gap, so check which figure you are reading.
The macro picture pulls the other way. Q3 GDP grew 4.5%, Beijing pledged property support, and Reuters Breakingviews argued conditions were ripe for a Chinese bull market. Weak consumers and the property downturn remain the bear case.
EWW: a triangle that stalled at the apex
The iShares MSCI Mexico Capped ETF (EWW) closed at $75.99 on 20 October. Its recent recovery rally ended near the apex of a symmetrical triangle, just short of the trendline, with shooting-star signals flagged on daily and weekly data. That is not a confirmed breakdown.
Bulls point to nearshoring and server exports near $83 billion in H1 2026. Bears cite USMCA uncertainty, stalled foreign investment and a peso stronger than 17 per dollar, which can squeeze exporters.
The original commentator is short FXI and EWW; on his recording day they fell about 1.78% and 0.37% respectively.
| Fund | Pattern | Key level or data | Bull case | Bear case |
|---|---|---|---|---|
| SMH | Support test below broken trendline | $536 support | Micron’s $32B commitments | AI debt worries |
| FXI | Multi-month top | Below 200-day at $35.99 | GDP 4.5%, property support | Weak consumers, property |
| EWW | Symmetrical triangle, shooting star | $75.99 | Server exports near $83B | USMCA, strong peso |
Treat each bearish chart as a hypothesis with a defined invalidation point. And remember FXI is a concentrated large-cap vehicle, so its chart may not describe the whole Chinese economy.
How can you reduce risk when the chart and the headline disagree?
Reading the setups is half the work. Deciding what to do with them is the other half, and practitioners tend to work through a similar order:
- Trim oversized positions rather than treating a signal as all-or-nothing.
- Reduce size on trades that rely on a single catalyst or narrow leadership.
- Set a predefined invalidation level below support or beyond a confirmed pattern failure.
- Hedge broad exposure with index or sector instruments.
- Wait for confirmation before adding exposure.
- Diversify across countries, sectors and factors.
A reminder from Fidelity Support can fail, and traders cannot know in advance when a range will break.
The commentator behind these charts follows a version of this, trimming his long exposure while holding bearish views on FXI and EWW. He believes Mexico could fall quickly if global markets weaken, though that is his opinion. EWW is also not heavily traded, so thinner liquidity can make moves sharper.
For you, the decision is rarely buy or sell. It is how much exposure to carry given how narrow leadership is, and where your plan is proven wrong. One move worth considering this week is writing down that invalidation level before you act.
A flat index with high dispersion underneath is a classic stock picker’s market, where relative strength and disciplined entries near tested support matter more than waiting for the index to pick a direction.
Chart patterns and forecasts are not guarantees; past performance does not guarantee future results.
What a trendless tape changes, and what it does not
A flat or narrow market is not read through the index headline. You read it through breadth, key levels and confirmation.
That leaves three things to watch: whether SMH holds 536, whether FXI can reclaim its moving averages, and whether EWW resolves its triangle with genuine follow-through. Each outcome either confirms or invalidates a view, and each should shape your sizing rather than your conviction.
Breadth warnings have a mixed record as timing tools: three of four episodes between 2013 and early 2022 punished early sellers, so narrow participation is best treated as a condition to monitor rather than a trigger.
The index may stay green. Your job is to decide whether the market underneath it deserves the same trust.
This article is for informational purposes only and should not be considered financial advice. Investors should conduct their own research and consult with financial professionals before making investment decisions.