
A jobs report that missed forecasts by roughly 56,000 (29,000 jobs added against about 85,000 expected) cut the odds of an October Fed rate hike from 64.4% to 22.1%. Yet the 10-year Treasury yield still closed Friday at 5.277%. If you assumed weak data pulls borrowing costs down, the Fed oil market drivers behind that gap say otherwise.
Rates, oil and equities are sending conflicting signals ahead of the Federal Reserve’s 27-28 October meeting. Read one at a time, each leads to the wrong conclusion about portfolio risk.
Here is a framework for sorting which signals reflect Fed policy, which reflect global bond and energy stress, and which reflect AI-driven leadership in equities.
Why did a weak jobs report cut Fed hike odds but not Treasury yields?
The first reaction was the intuitive one. The 2-year Treasury yield, which tracks expected Fed policy, fell as much as 9-10 basis points (a basis point is one-hundredth of a percentage point) to 4.69% after the September payrolls release.
Then it reversed. The 2-year closed up 3 basis points at 4.82%, and the 10-year settled at 5.277%.
The data itself made a case for a pause. Unemployment stood at 4.2%, and the Bureau of Labor Statistics cut July to -10,000 and August to 133,000, a combined downgrade of 60,000 jobs. Average hourly earnings rose 0.1% to $37.81, a 3% annual pace that trails August’s CPI reading of 3.4%.
| Metric | Expected or prior | Actual | What it signals |
|---|---|---|---|
| September payrolls | About 85,000 | 29,000 | Slowing labour demand |
| October hike odds | 64.4% a week earlier | 22.1% | Pause more likely |
| 2-year yield | Intraday low 4.69% | 4.82% close | Dip faded |
| 10-year yield | Not stated | 5.277% | Long end set elsewhere |
Fed officials and commentators are split on what comes next. Austan Goolsbee sees both a hike and a pause as possible, while Mohamed El-Erian says the data leaves the Fed firmly on hold in October. JPMorgan’s Michael Feroli still expects a hike in December.
Hike odds move so sharply on a single payrolls print because of the Fed’s dual mandate and FOMC structure, which tie every rate decision to both jobs and inflation data and give just 12 members a vote.
Falling hike odds tell you the Fed is less likely to tighten soon. The 10-year at 5.277% tells you mortgage and corporate borrowing costs are getting no relief from weak jobs data.
Four reasons long yields can rise anyway
Treasury Secretary Scott Bessent said the rise in US yields matches global trends, after a French-debt-led selloff revived contagion worries in European bond markets. Analysts commonly point to four channels, though none is confirmed as the cause of Friday’s session.
- Term premium: the extra yield investors demand for holding long bonds. Slower growth with sticky inflation does little to anchor long-run inflation expectations.
- Global spillovers: stress in French or Italian debt, or shifts in European and Japanese policy, reprices the global risk-free curve and cheapens Treasuries.
- Energy-driven inflation expectations: elevated oil keeps headline inflation risk alive even as hiring softens.
- Fiscal supply: large projected deficits and heavy Treasury issuance lift yields regardless of the latest data.
When big ASX news breaks, our subscribers know first
What does oil above $100 and the Hormuz standoff mean for inflation and the Fed?
Oil is the reason the inflation half of the Fed’s job has not gone away. Weakening jobs and rising energy costs pull policy in opposite directions.
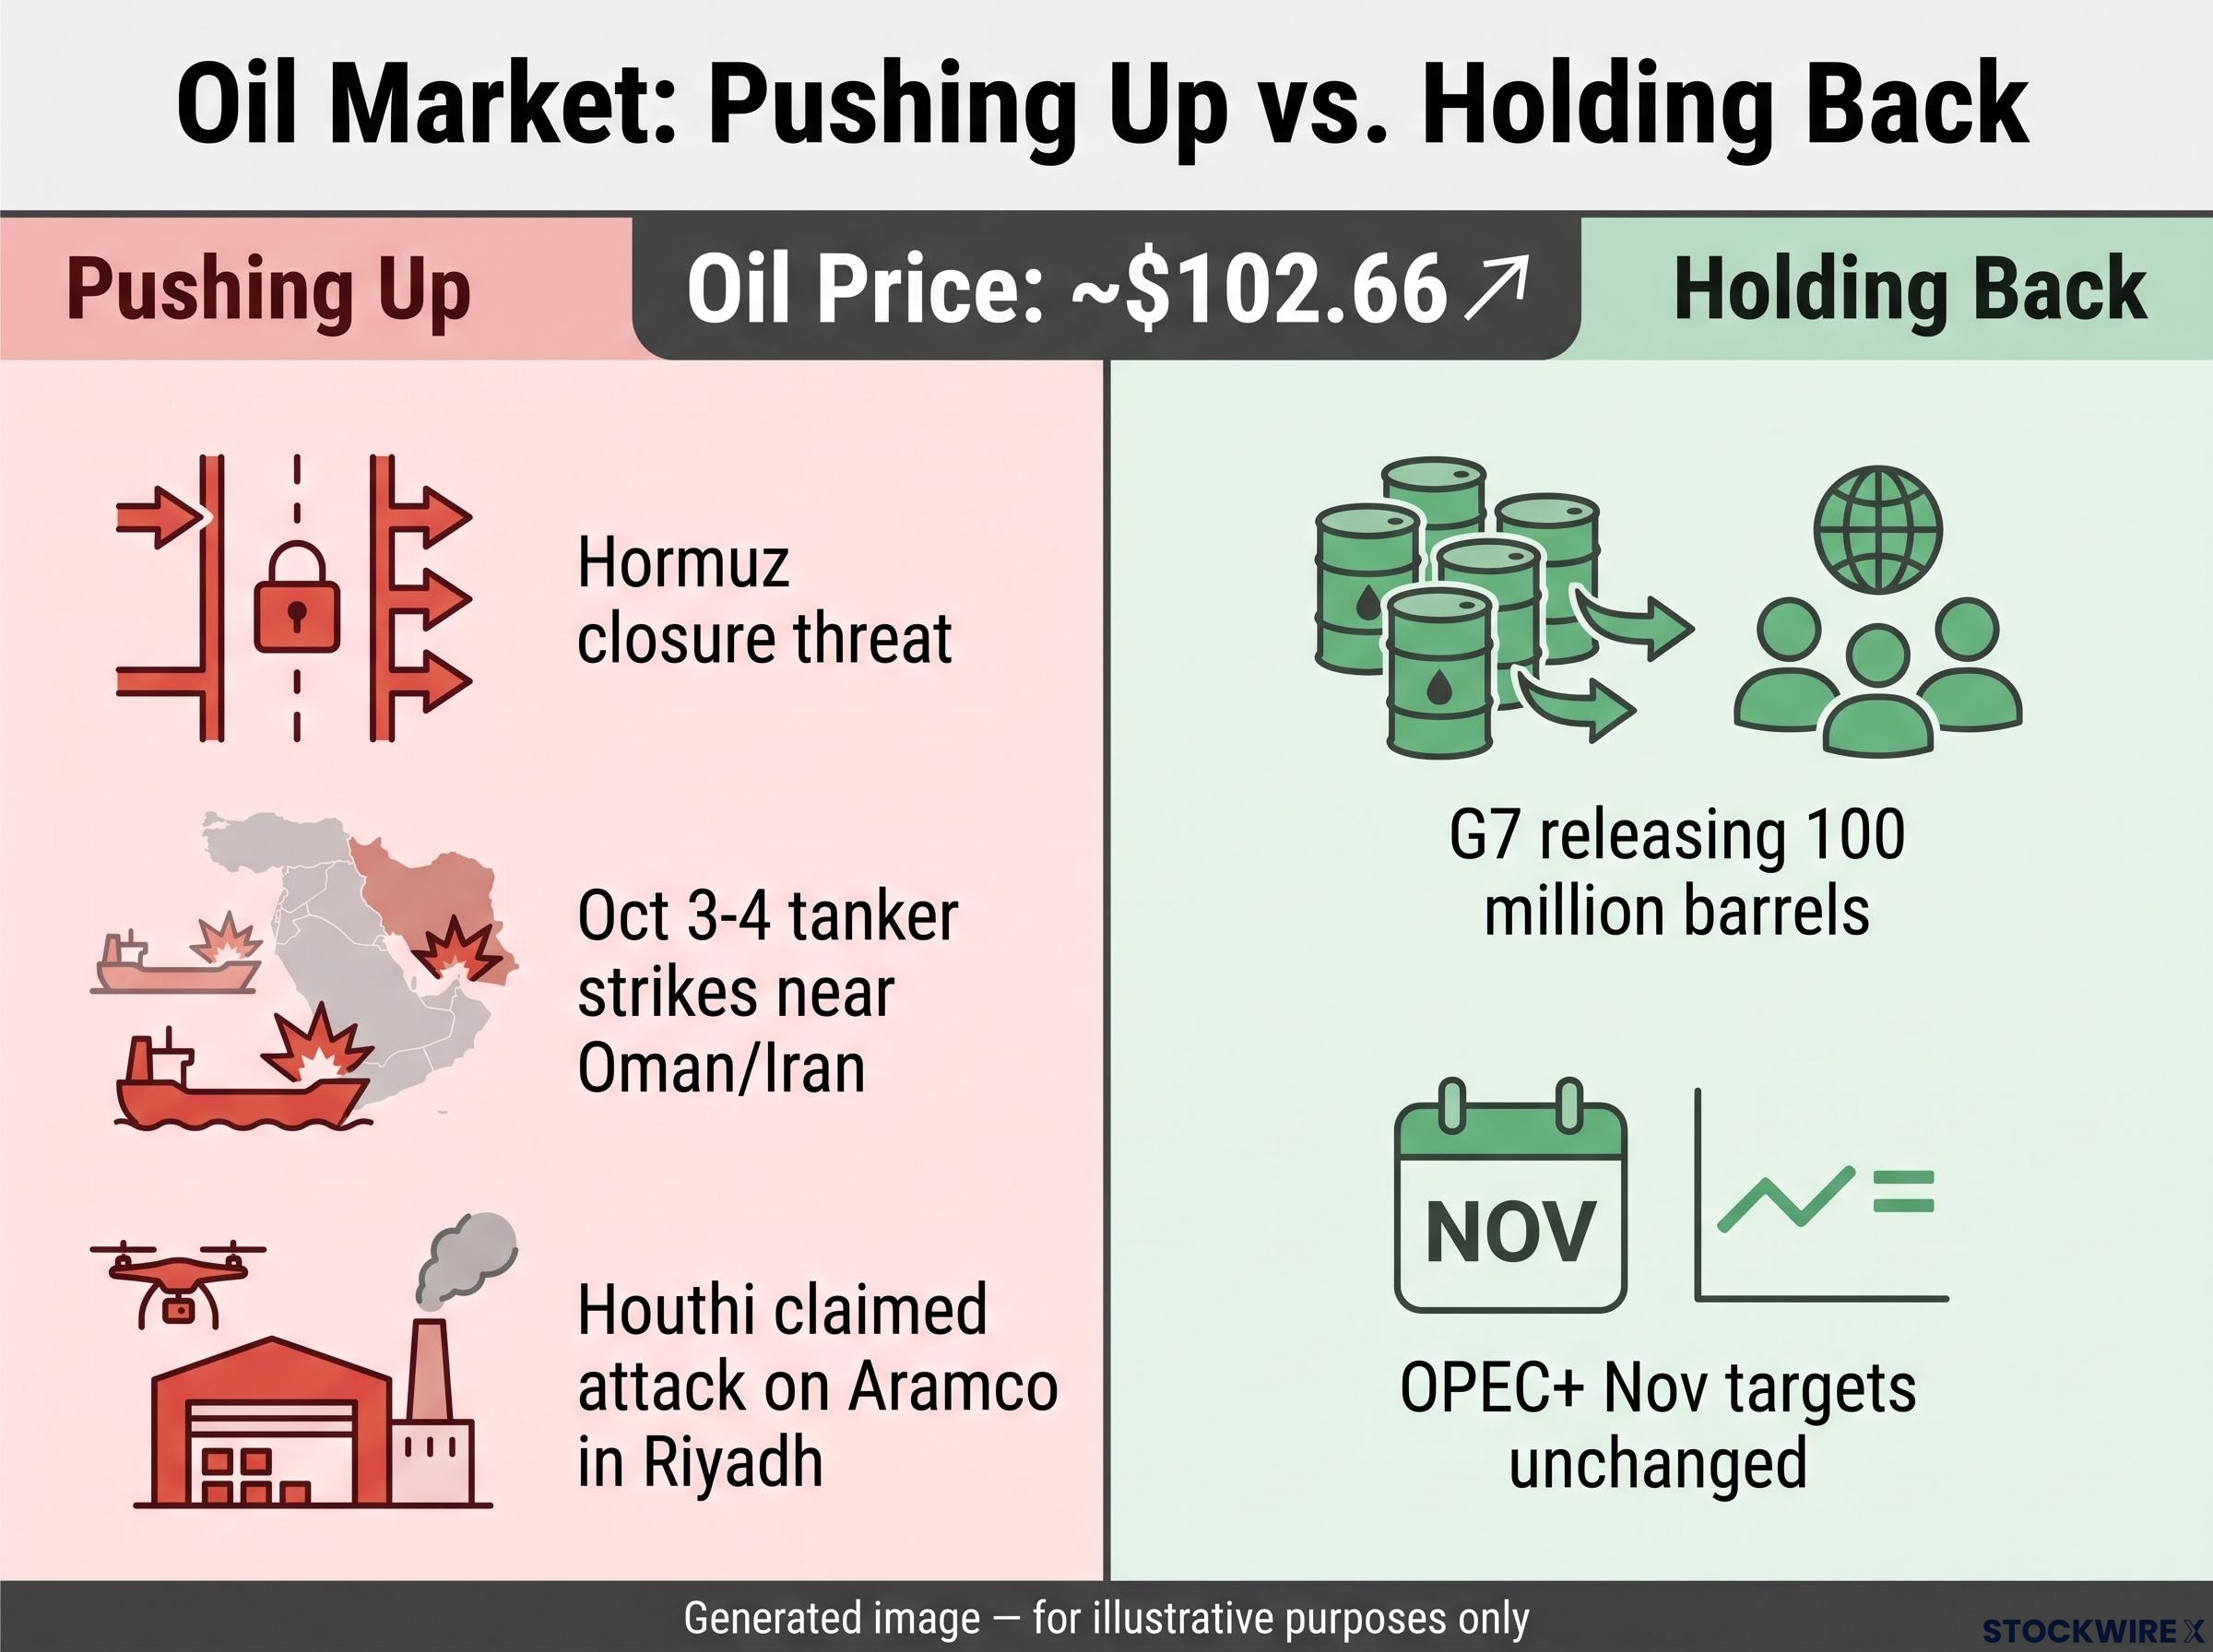
What is pushing oil up
Iran’s chief negotiator, Ghalibaf, said the Strait of Hormuz stays closed until the US meets seven conditions under June’s Islamabad memorandum. Over the weekend of 3-4 October, UKMTO reported at least two tankers struck near Oman and Iran, one with engine room damage.
- President Trump is sending the USS Theodore Roosevelt carrier group, with about 10,000 sailors and Marines, to the Middle East.
- The Houthis claimed a missile and drone attack on an Aramco facility in Riyadh. Saudi authorities have not confirmed it.
What is holding it back
Supply responses are real but temporary. The G7 will release 100 million barrels of oil and diesel from reserves over four months, with diesel front-loaded within 20 days, and Trump ruled out a US diesel export ban.
Seven core OPEC+ members kept November output targets unchanged, and the group meets again on 1 November. Steady output is not extra supply.
Prices reflect the tug of war. Oil closed 0.5% higher at about $102.66 on Friday after clawing back a drop of roughly 4%. One caution: the market wrap does not clearly say which benchmark that figure tracks, while data aggregators show Brent near $102.25 and WTI near $91.11.
Eurozone inflation, September flash estimate Inflation hit 3.8%, up from 3.2% in August and above the 3.6% forecast, the highest since September 2023. Energy prices rose 18.8%, while core inflation was 2.5%.
That Eurozone reading shows energy feeding headline inflation abroad. The 1970s and the 2022 energy shock are the usual warnings that prolonged price spikes can de-anchor expectations and force tougher policy.
Sustained oil above $100 means the Fed cannot treat weak jobs as a green light to ease. Energy-driven inflation can keep policy restrictive and yields elevated, which touches your fuel costs and rate exposure alike.
Analyst estimates of oil price pass-through suggest 40-60% of a crude spike can reach core CPI within 3-6 months, which is why sustained $100 oil keeps the Fed from treating soft hiring as a green light.
How can the Nasdaq hit a record while the Dow and S&P 500 fall on the week?
Friday’s headline looked strong. The Nasdaq reached an intraday record, yet the major indices finished below their session highs, and only the Nasdaq gained over the week.
| Index | Close 2 October | Daily change | Weekly change |
|---|---|---|---|
| S&P 500 | 7,723 | +0.73% | -0.3% |
| Dow | 51,177 | +0.49% | -1.3% |
| Nasdaq | 27,191 | +1.19% | +0.45% |
| Russell 2000 | 2,833 | +0.94% | Not available |
The leadership was narrow. Technology and consumer discretionary led, and the semiconductor ETF gained 2.18%. Morgan Stanley named Nvidia its top semiconductor pick, and Bessent dismissed AI bubble worries.
Beyond tech, copper miners were the best commodity ETF at +3.01%. The VIX, Wall Street’s gauge of expected volatility, fell 6.59% to 15.31, a calm reading beside bond and oil stress.
The debate over AI leadership splits like this:
- Bull case: a genuine productivity boom with long-run earnings power.
- Bear case: prices embed optimistic assumptions on adoption, margins and competition, while high yields hit long-duration valuations and squeeze travel, airline and auto margins.
A record Nasdaq beside a falling Dow tells you index headlines overstate how healthy the average stock is. Check how much of your own portfolio rides on a handful of AI names.
Conflicting equity signals are not new this autumn; the S&P 500 and Nasdaq have diverged repeatedly as the 10-year yield reached its highest level since 2007, and technical support levels now decide whether pullbacks hold.
A framework for reading Fed, rates and oil signals together
The week’s numbers look contradictory: hike odds at 22.1%, a 10-year at 5.277%, oil above $100, Eurozone inflation at 3.8% and a record Nasdaq. They make sense once you sort each into the force behind it. One dataset can feed four channels: Fed expectations, term premium, energy-driven inflation and equity discount rates.
Use this checklist on any headline:
- Identify the channel. Does it touch Fed policy, global bonds, oil or equity leadership?
- Test the reaction function. Would the Fed change its response to inflation and jobs because of it?
- Check the supply and fiscal side. Does it alter global term premium or oil supply, or only sentiment?
- Find the next catalyst. Note the date that could confirm or reverse it.
The live range of opinion shows why this matters. Feroli expects a December hike while El-Erian sees the Fed on hold, so the data has not settled the question.
| Driver | What to watch | Next catalyst |
|---|---|---|
| Fed | Hike odds, wage and inflation data | 27-28 October meeting |
| Global bonds | French and European debt stress | Ongoing |
| Oil | Hormuz, tanker incidents | OPEC+ on 1 November |
| AI equities | Breadth, yields | Next US jobs and inflation prints |
Applied properly, the framework tells you which risks are Fed-driven and respond to data, and which come from global supply and fiscal forces and may persist whatever the next jobs report says. This is an analytical framework, not investment advice.
What the mixed signals change, and what they leave unresolved
The jobs data lowered near-term hike odds. It did not resolve the inflation, oil and fiscal pressures holding long yields high.
Four variables stay open: Hormuz developments, the 1 November OPEC+ meeting, the 27-28 October Fed meeting, and further French and European bond stress. Markets reopen Monday, so none of these has yet been tested by a new session.
Weigh your own holdings against three questions: how rate-sensitive they are, how exposed to energy costs, and how concentrated in a few AI names.
This article is for informational purposes only and should not be considered financial advice. Investors should conduct their own research and consult with financial professionals before making investment decisions. These statements are speculative and subject to change based on market developments.