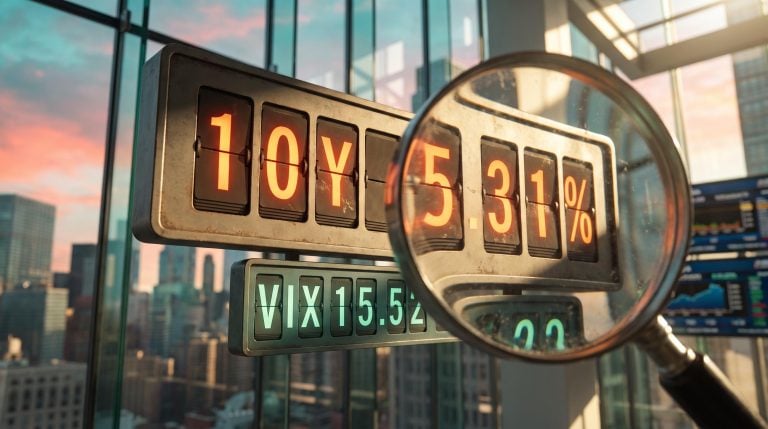
The 10-year Treasury auction cleared at 4.834% in September, the highest auction yield for that maturity since August 2007, with demand that looked solid. Yet secondary-market yields have since pushed past 5.2%, which shows that a Treasury market crisis does not need a failed auction to be real.
Nothing broke. The price of money simply reset, quietly and in plain sight.
Washington is running a deficit of roughly $2.0 trillion (about 6.2% of GDP) with the economy near full employment. Mark Skousen, the economist, puts the Treasury’s rollover bill at about $7 trillion. Portfolio valuations assume that government funding stays cheap and orderly.
Here is a way to separate the plausible risk (repeated volatility and higher term premia) from the tail risk (a buyers’ strike), plus a stress-scenario framework and one strategist’s positioning.
Where do yields and the deficit stand, and is a buyers’ strike really the risk?
The reassuring evidence comes first, and it is genuine. September’s auctions were covered, no one failed to bid, and no tail data has surfaced. The less visible problem is what the rising price of that demand does to the budget.
What the auctions show
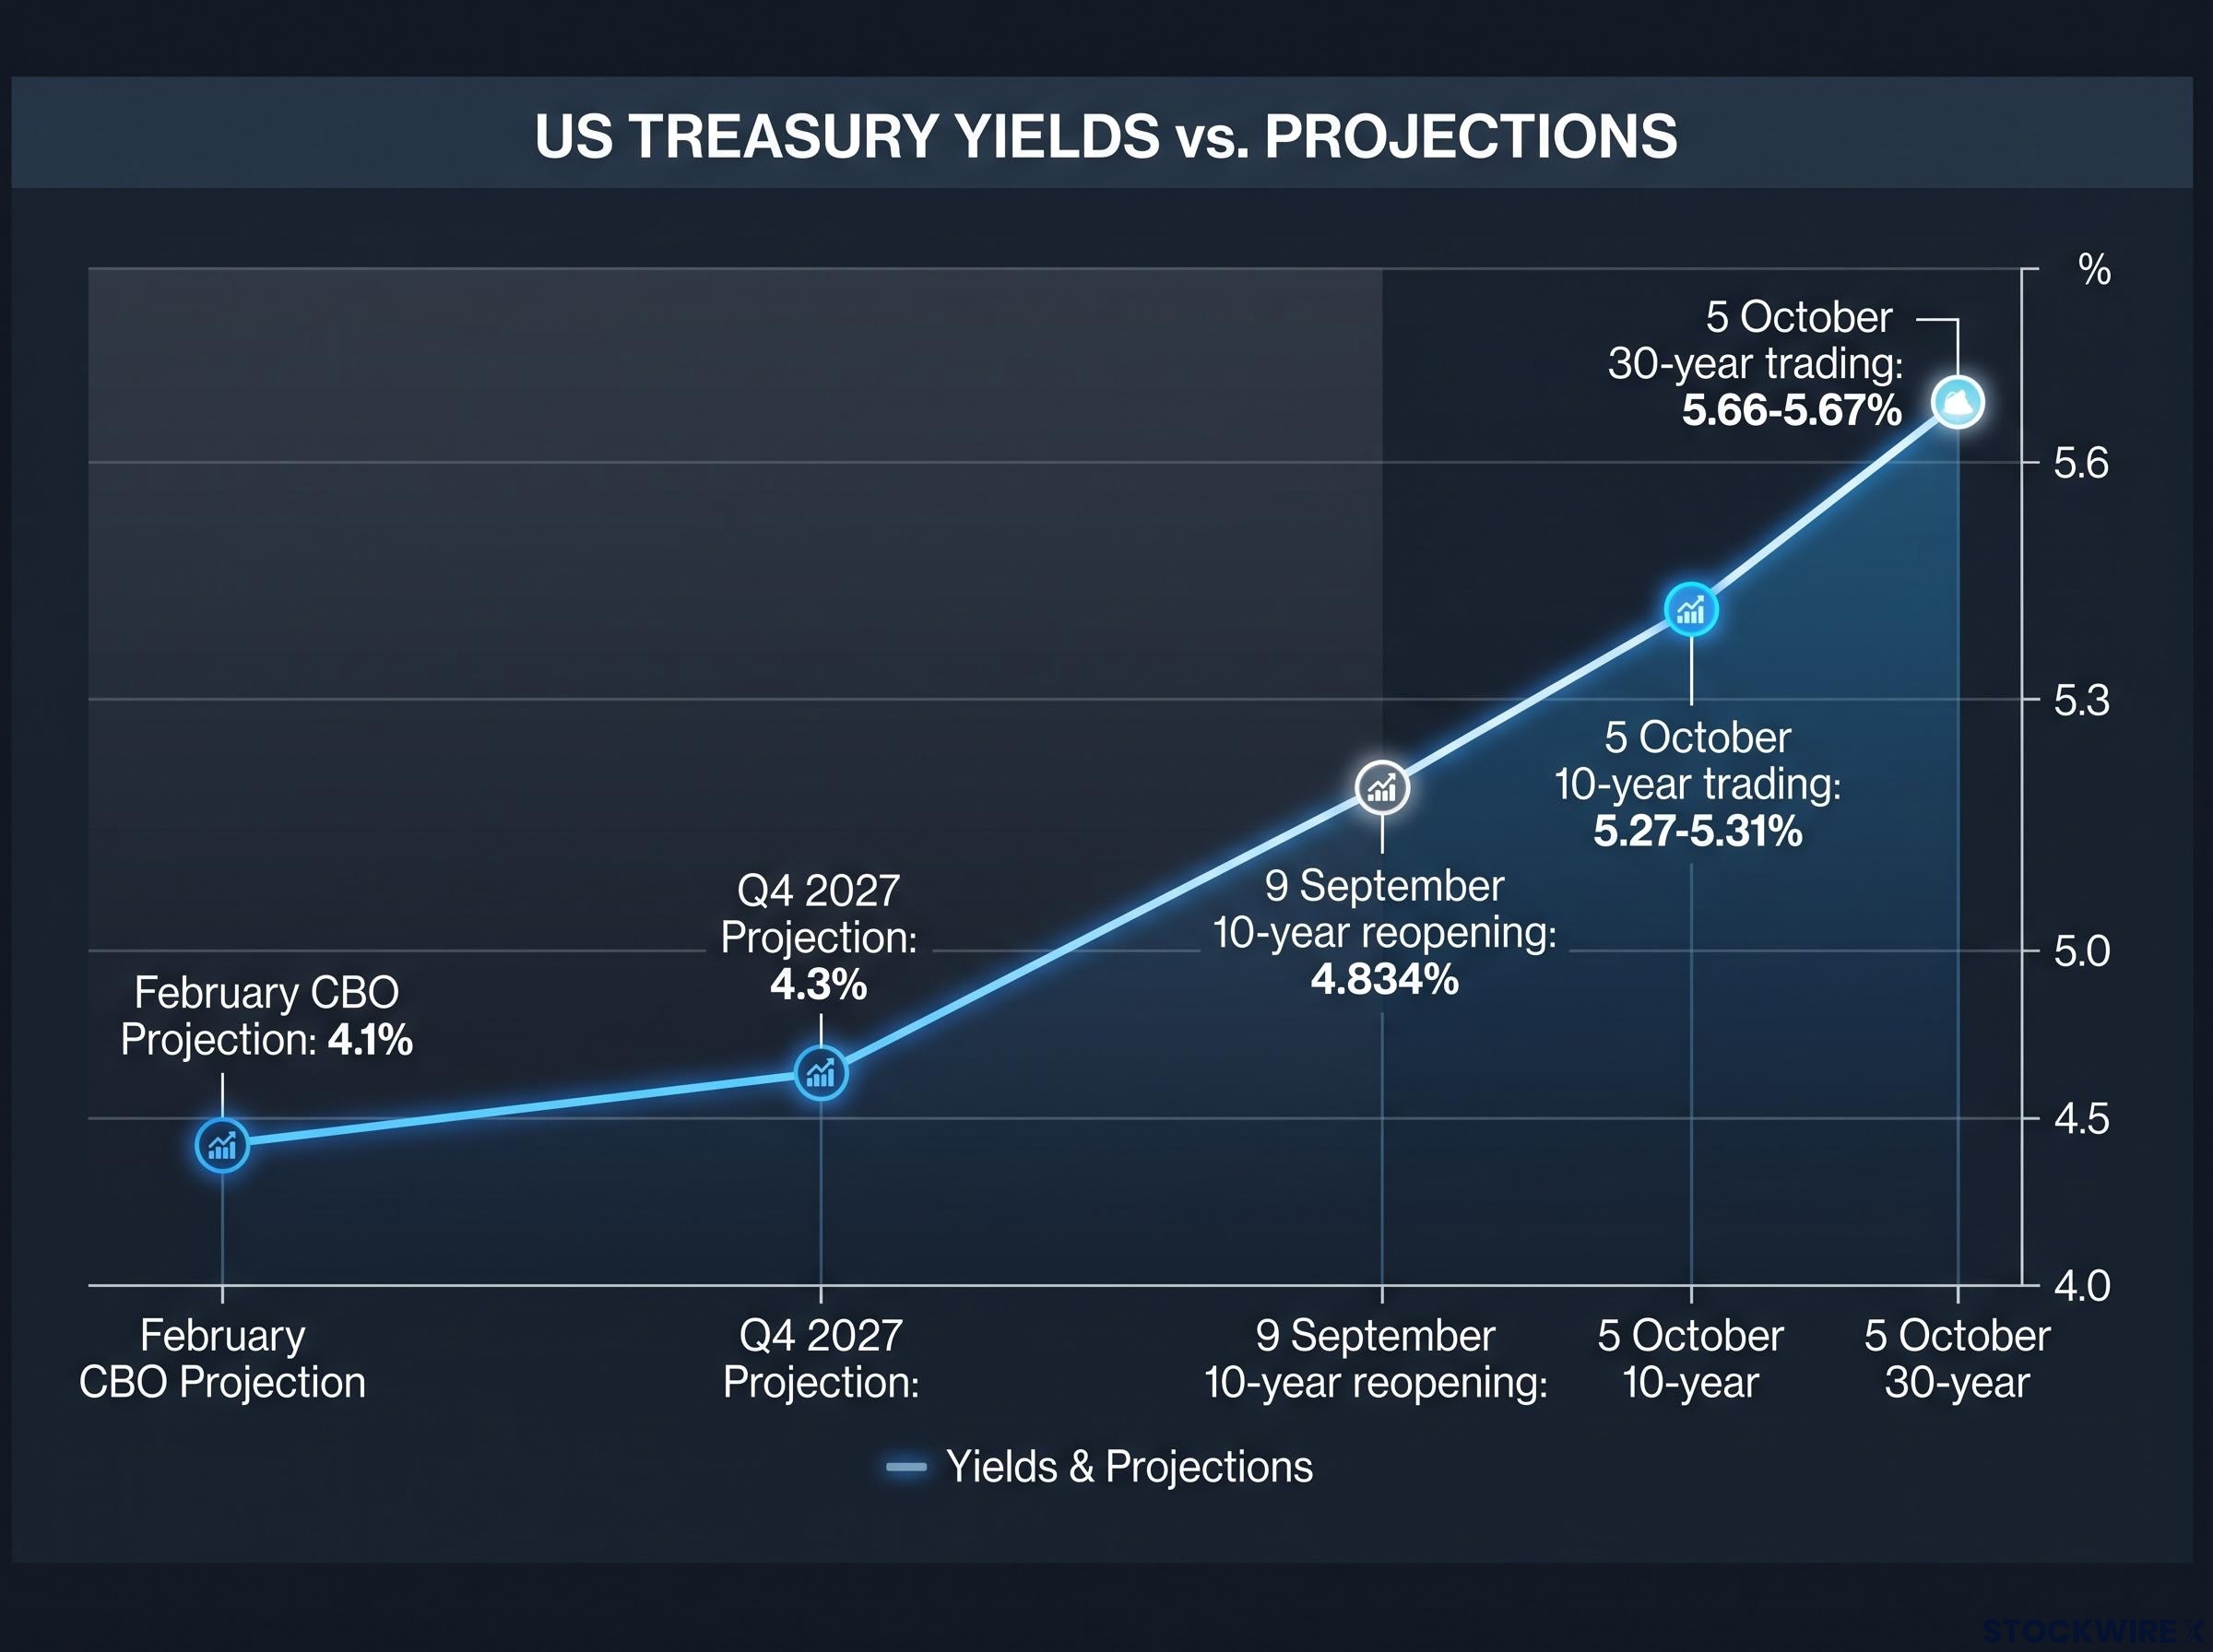
The $39 billion 10-year reopening on 9 September drew a 4.834% high yield. The $22 billion 30-year followed the next day at 5.308%.
| Auction | Size | High yield | Bid-to-cover | Indirect bidders |
|---|---|---|---|---|
| 10-year reopening, 9 September | $39 billion | 4.834% | 2.71 | 79.2% |
| 30-year reopening, 10 September | $22 billion | 5.308% | 2.61 | 79.5% |
By 5 October, the 10-year traded at roughly 5.27-5.31% and the 30-year at about 5.66-5.67%. The Congressional Budget Office (CBO) projected in February that the 10-year would sit at 4.1%, edging to 4.3% by Q4 2027. Actual yields blew through that path within months.
Demand held, but the price rose. That is the pattern to watch.
What the interest bill shows
The CBO’s August review lifted its FY2026 deficit estimate to $2.1 trillion (6.6% of GDP). Later year-end data point to about $2.0 trillion (6.2%), the more current figure. Net interest is running at $1.0-1.1 trillion, or 3.3-3.4% of GDP.
Net interest doubling The CBO projects net interest outlays reaching $2.1 trillion by 2036, or 4.6% of GDP.
The Skousen figure of a $7 trillion rollover was not confirmed in CBO, Congressional Research Service or Treasury materials. Institutional sources describe structural fiscal vulnerability, not an imminent strike. Skousen and Steve Hanke’s “predictable black swan” is a scenario, not consensus.
What this tells you: “no failed auction” does not mean “no problem”. Every higher rollover rate locks in a bigger interest bill, which feeds straight back into the deficit.
The CBO expects the point where borrowing costs overtake growth to arrive around fiscal year 2031, after which stabilising debt requires a primary surplus rather than merely a smaller deficit.
When big ASX news breaks, our subscribers know first
How does a Treasury market crisis actually start? The mechanics behind the fear
Who sets the marginal price of Treasuries? Skousen, citing Hanke, argues it is hedge funds and private equity, more than central banks. That matters because leveraged buyers sell when they must, not when they choose.
Start with the term premium: the extra yield investors demand for locking money into a long bond, as compensation for inflation and fiscal risk over the years ahead. CBO and the Committee for a Responsible Federal Budget (CRFB) commentary supports this reading of the rise.
Estimates of the term premium have swung by more than 200 basis points since March 2020, which suggests the repricing of long bonds is structural rather than a passing reaction to one auction.
Four channels that could break demand
- Hedge fund basis trade: leveraged bets on gaps between cash Treasuries and futures can unwind fast when volatility spikes or funding tightens.
- Yen carry unwind: Skousen puts the Japanese carry trade at about $1.5 trillion; a shift in Japanese rates could force sales.
- Private credit stress: a squeeze could first send investors into Treasuries, then force broader deleveraging.
- AI capital demand: Skousen, citing Paul Krugman, argues heavy AI investment competes with Treasury supply for capital, lifting real rates.
Current Japanese government bond yields and Treasury holdings data from the Treasury International Capital system or Bank for International Settlements were not found, so the scale of these channels today remains unverified.
A scenario view Skousen, aligning with Hanke, calls a Treasury crisis a “predictable black swan” with unknown timing, and admits it is guesswork.
Why Treasuries can fall when markets panic
In March 2020, the “dash for cash” saw Treasury yields spike and liquidity deteriorate, the opposite of the safe-haven script. Massive Fed purchases restored order.
What this tells you: the danger is forced selling by leveraged holders, not foreigners deciding to walk away. Watch funding stress and volatility, not just auction headlines.
What do 1980-82, Sweden 1992, and the Fed under Warsh tell us about the odds?
History offers a pattern, and it is mostly reassuring for a reserve-currency issuer.
| Episode | What happened | Why it resolved | Lesson for today |
|---|---|---|---|
| US, 1980-82 | Rates hit 21% twice; Treasuries reportedly had no bids on some days in 1980 | Investors believed in the anti-inflation regime and the dollar’s reserve status | Credibility preserves market access |
| Sweden, 1992 | Rates briefly hit 500% | Small economy, no reserve-currency privilege | The cushion matters |
| UK gilts, 2022 | LDI-driven forced selling | Bank of England purchases | Leverage turns shocks into dysfunction |
| US, March 2020 | Yields spiked, liquidity deteriorated | Massive Fed purchases | The Fed is buyer of last resort |
The dollar’s reserve role and the Fed backstop make a permanent strike less likely than temporary dysfunction. The backstop carries a cost: balance sheet expansion and political concern about monetising deficits.
Warsh and the credibility question
Kevin Warsh became Fed Chair on 22 May 2026. Skousen sees a potential Volcker-style inflation fighter, noting Warsh resigned from the Fed in 2011 over quantitative easing. He argues money growth of 4-5% (M2 about 5.7% per the St. Louis Fed) is incompatible with a 2% target without tighter policy and balance sheet unwinding.
The research did not include the current fed funds rate, recent FOMC decisions or balance sheet plans, so none are assumed here. Fiscal pressure also persists: Skousen criticises Iran war spending and calls for a balanced budget amendment, which is his view.
Any push to shrink the balance sheet runs into the Fed’s $1.93 trillion mortgage-backed securities portfolio, whose long weighted average life makes meaningful normalisation unlikely before the mid-2030s.
What this tells you: the variable to monitor is Fed independence and inflation, and that credibility is still unproven.
Why have stocks held up, and how should you stress-test a portfolio?
AI-driven earnings explain the calm. Chip makers report backlogs, and Microsoft, Micron, AMD and the Magnificent 7 are performing well.
Why stocks have held up
There are two kinds of rising yields. When growth and AI productivity push them up, equities can rise alongside. When term premium, inflation or fiscal risk drives them, valuations compress.
Your equity exposure is effectively a bet on which explanation holds. Check how much of your portfolio depends on the growth story.
Corporate credit spreads offer a useful cross-check on yields: investment-grade spreads near 0.80 percentage points suggest bond investors are not pricing systemic stress, even with the 30-year at a 19-year high.
A stress-scenario framework
| Scenario | Trigger | Likely yield behaviour | Equity impact | Defensive lever |
|---|---|---|---|---|
| Orderly grind higher (most plausible) | Deficits, term premium | Steady rise | Valuation pressure on growth | Review duration and AI concentration |
| Volatility episode (plausible) | Basis trade or carry unwind | Sharp spike, then retrace | Sudden drawdowns | Liquidity buffer |
| Disorderly strike (tail risk) | Loss of confidence | Disorderly surge | Severe; Skousen says tech could halve | Fed backstop is the circuit breaker |
Skousen offers one example of positioning, not a recommendation. He stays fully invested, and sees today’s bubble as more in Treasuries than the one before the 1987 crash, when the Dow fell 22.6%.
- AI tech, XLK: he says it has outperformed QQQ by 30%. Critique: valuation risk if yields rise for fiscal reasons.
- Cybersecurity (Palo Alto Networks, CrowdStrike): AI-security plays. Critique: still exposed to tech multiples.
- BLOK/bitcoin (about $87,000): Critique: volatile and unproven as a crisis hedge.
- Energy and income stocks: avoids utilities, staples and retail. Critique: defensive tilts can be crowded.
- Bearish on gold: disagrees with Hanke’s 6,000 forecast. Critique: leaves an inflation hedge off the table.
What the data supports, what it does not, and the signals worth tracking
The evidence supports a structural, rising-cost fiscal problem and episodic volatility risk. It does not yet support a buyers’ strike.
Four signals will tell you if that changes:
- Auction tails and indirect bid share: weaker bid-to-cover from 2.6-2.7 or fading indirect demand near 79%.
- Yield levels: the 10-year and 30-year against the 5% area.
- Yen and Japanese bond moves: early warning of carry unwinds.
- Fed communication under Warsh: signs of independence and inflation resolve.
This article is for informational purposes only and should not be considered financial advice. Investors should conduct their own research and consult with financial professionals before making investment decisions. These statements are speculative and subject to change based on market developments.