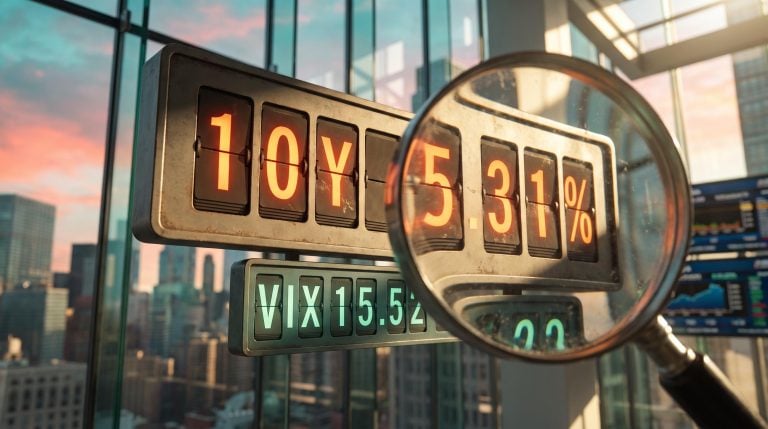
The S&P 500 closed near 7,774 on 5 October 2026, within reach of its 13 August record of 7,798.99. Over the same stretch, the 10-year Treasury yield climbed to roughly 5.31% and long bonds kept losing money. That is a stock bond divergence in plain view: two markets telling opposite stories, and only one of them can be right.
The gap is arriving with oil elevated (WTI near $91, Brent near $99 at times) and a US election approaching. Treat record highs as a clean all-clear and you risk missing a warning. Overreact to a signal that has misfired before and you risk selling a market that is still working.
Here is what past divergences signalled, which charts and numbers deserve your attention, and how to weigh AI-concentration risk against election-season noise.
What does the gap between record stocks and falling bonds actually look like?
Start with the numbers. The table below lays the two sides next to each other, with dates, because the readings come from different points in time.
| Indicator | Latest reading | Date | Direction |
|---|---|---|---|
| S&P 500 | about 7,774 (record: 7,798.99) | 5 October 2026 (record 13 August) | Near record |
| 10-year Treasury yield | about 5.31% | Early October 2026 | Rising |
| 10-year yield (earlier close) | 4.786% (reported) | 8 September 2026 | Rising |
| TLT year-to-date return | -7.81% (30-day SEC yield 5.54%) | Early October 2026 | Falling |
| WTI crude | $91.39 | 30 September 2026 | Elevated |
The 4.786% close and the 5.31% reading are not competing figures. They are two dates on the same climb, and the later one is the current one.
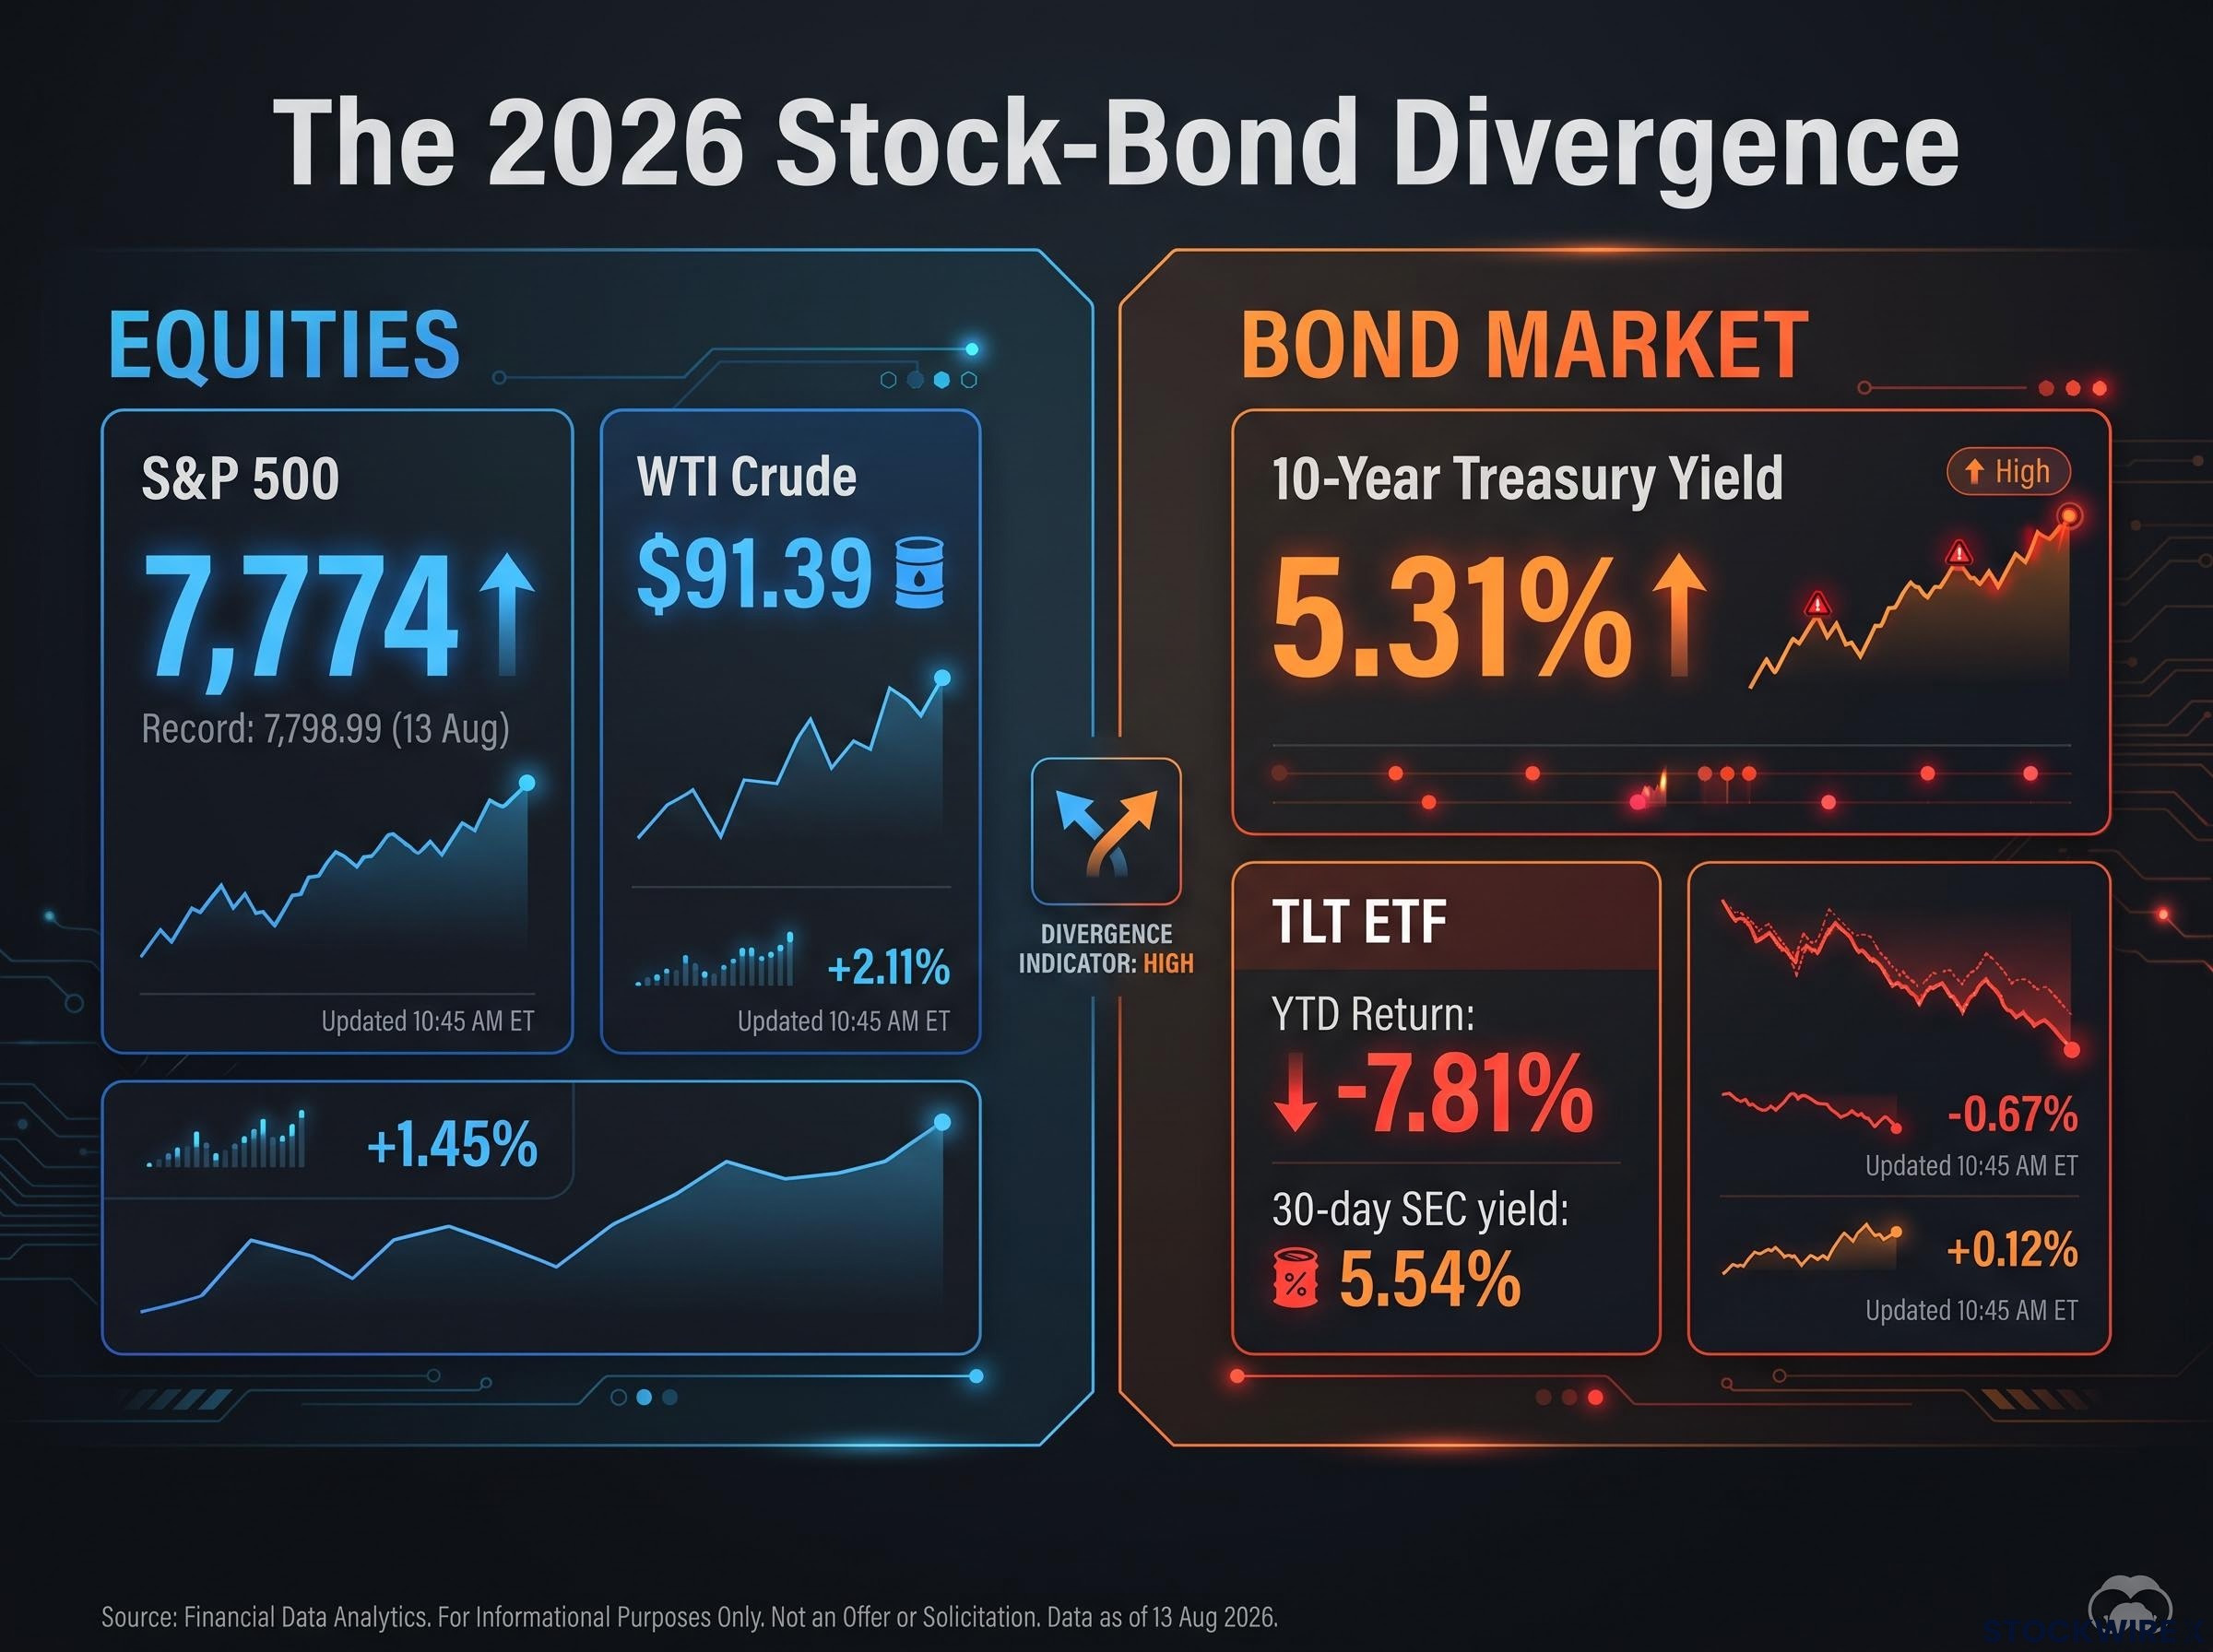
TLT is the iShares 20+ Year Treasury Bond ETF, a fund that tracks long-dated government bonds. Its -7.81% year-to-date return arrives alongside a 5.54% 30-day SEC yield (a standardised measure of the income a fund is currently earning). That combination shows how higher yields hurt existing bondholders: prices fall as yields rise, and the income only partly compensates.
The arithmetic is unforgiving, because higher yields hurt existing bondholders most when duration is long: a 100-basis-point rise can cost roughly a quarter of the capital in a 30-year zero-coupon bond.
The two markets are pricing different worlds. Equities are pricing AI growth and durable earnings, while bonds are pricing inflation, deficits, term premium (the extra yield investors demand for holding longer-dated debt) and geopolitical risk.
The uncomfortable chart A bond chart running from September 2024 onward would lead you to expect a bear market in stocks. The commentary behind this analysis makes that point directly, and the bear market has not arrived.
What this tells you is that equities are betting earnings growth can outrun a higher cost of capital. The wager is on earnings, not on rates, and a 60/40 holder feels the strain on the bond side even as the equity side looks healthy.
When big ASX news breaks, our subscribers know first
What have past stock-bond divergences signalled, and which one does this resemble?
A stock-bond divergence happens when one asset class reprices risk (rates, credit or inflation) while the other appears to ignore it. Bonds are often said to react to macro risk first, because their payoffs are fixed and a change in inflation or credit quality shows up quickly in price.
History offers four precedents, and they do not point the same way.
| Period | What diverged | What it signalled | Outcome |
|---|---|---|---|
| 1994 | Bonds sold off after aggressive Fed hikes; equities held up | Duration repricing | Not an equity bear market |
| 1999-2000 | Tech-led, narrow equity gains while bonds grew cautious | Late-cycle exuberance | 2000-02 bear market |
| 2007 | Credit spreads widened while indexes sat near highs | Default and liquidity risk | Credit moved first |
| 2021-22 | Low yields and strong stocks flipped as inflation surged | Higher real rates | Joint stock and bond selloff |
Three of the four ended badly for equities, and one did not. That split is the point: the divergence is a prompt to ask what the bond market knows, not a timing signal.
Today’s pattern looks closer to 1999-2000 than to 1994. It is narrow, tech-led and arriving late in the cycle, whereas 1994 was a rate-driven repricing that left equities largely intact. The fit is imperfect, because today’s AI firms are generating real cash flows, which is where the structural argument below comes in.
Structural versus cyclical: two readings of the same gap
The structural reading says AI and cloud firms earn exceptional cash flows and margins, which justifies high valuations despite higher long rates. Fiscal deficits, term premium and regulatory uncertainty keep yields high for reasons separate from the equity story. Evidence for it would be durable earnings.
The cyclical reading says equities are pricing disinflation and a soft landing, while bonds push back whenever data or oil threaten renewed inflation. On this view the gap closes if growth or policy shifts. Evidence for it would come from oil and inflation data.
Is AI the only thing holding the rally up?
Close to it. The commentary behind this analysis treats tech as the foundation of the bull market and AI as its main driver, with the Technology Select Sector SPDR Fund (XLK) at or near a record high and Nvidia at records. Its argument is blunt: without AI the market would be much lower, and a tech breakdown would end the rally.
The tech test A breakdown in tech, tracked through XLK, would signal the end of the rally, according to the commentary behind this analysis.
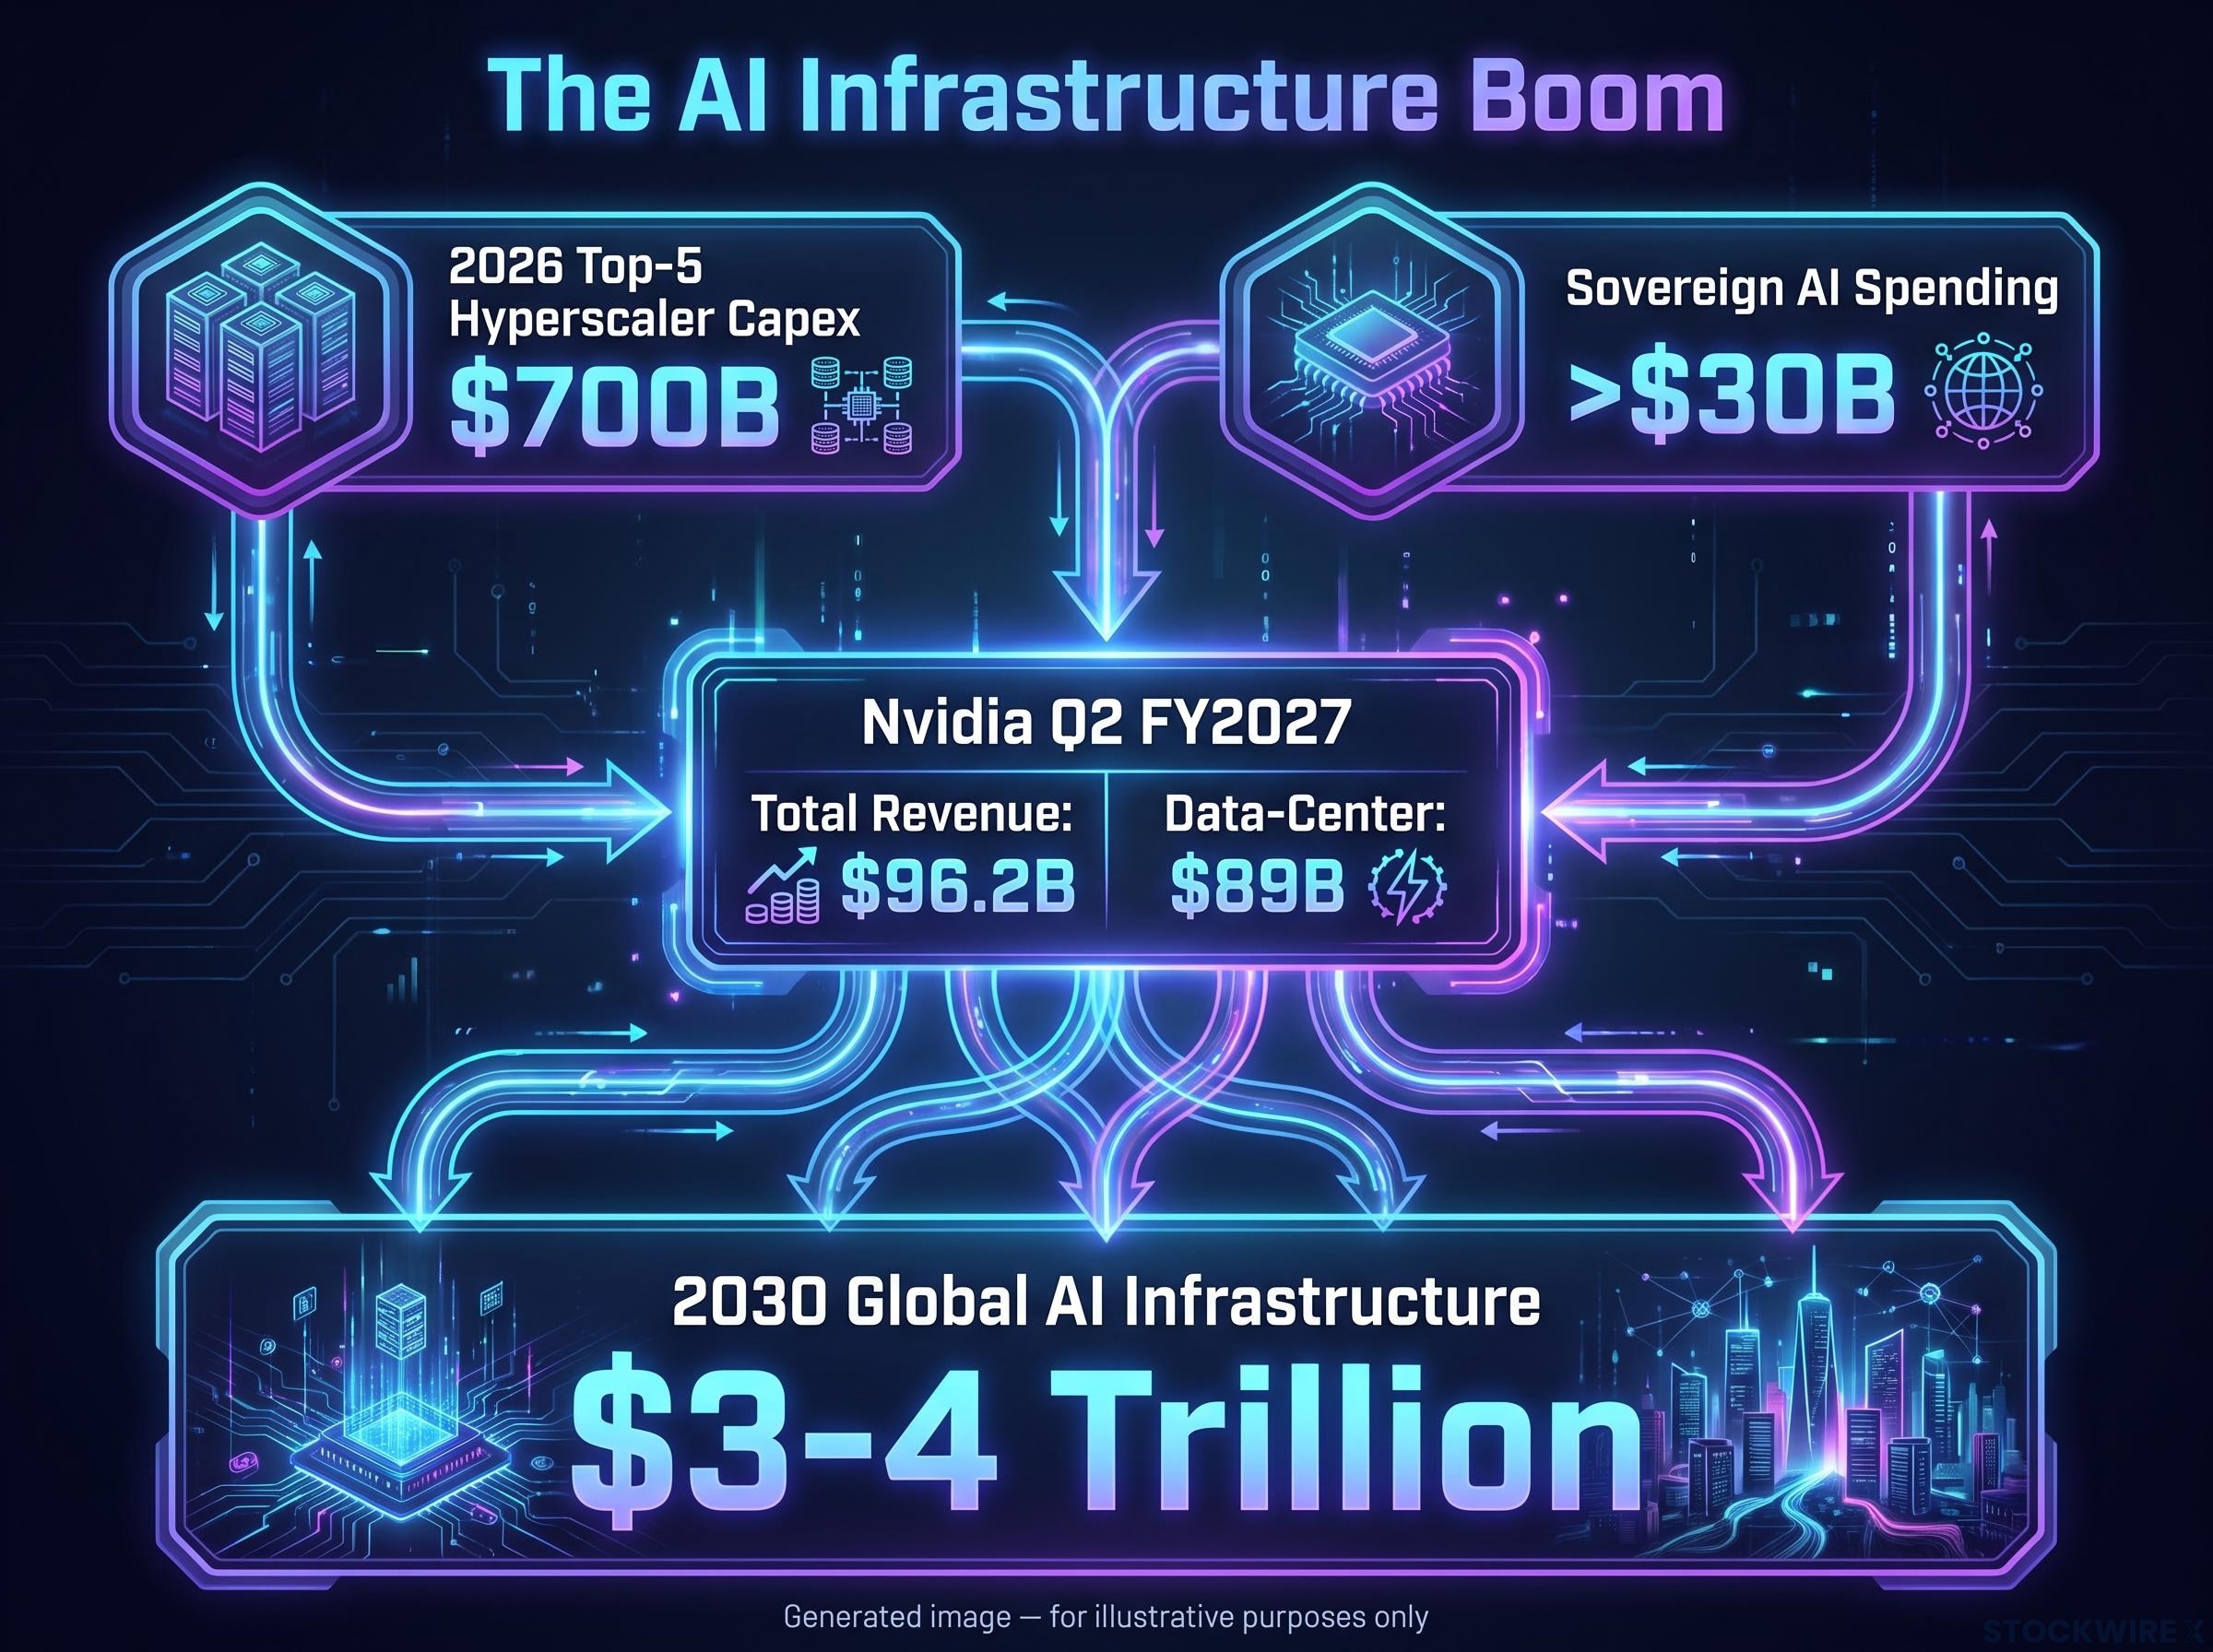
Nvidia’s numbers show why the weight is justified. For Q2 FY2027 (the quarter ended 26 July 2026), it reported revenue of $96.2B, up 106% year on year, with data-center revenue of $89B, up 117%. Adjusted EPS came in at $2.22 against a $2.09 consensus, and Q3 guidance sits near $108B (plus or minus 2%). Reports put the share reaction at nearly 9%, adding about $440B in market value in a single session, though that figure is unverified.
The money behind it is large. Top-five hyperscaler capex is approaching $700B in 2026, and Jensen Huang, Nvidia’s chief executive, has reaffirmed a $3-4 trillion global AI infrastructure envelope by 2030.
The weight is not confined to active bets: passive index funds now carry an implicit concentrated AI position, with the top 10 AI stocks accounting for roughly 36% of the US equity universe.
Semiconductors, though, gave a softer reading in the source session. Use this three-part health check:
- XLK: is it holding near its record?
- SOX: the Philadelphia Semiconductor Index rose only 0.03% and sat below the midline of a channel in place since the Liberation Day bottom, which has acted as resistance. SMH (a semiconductor ETF) gained about 0.5% but stayed under Friday’s high. Digestion or rotation could explain both.
- Nvidia: is it tracking its guidance?
Quantified SOX, SMH and XLK performance and tech’s index weight were not available, so no figures are offered here. For you, the point is that these charts are the earliest observable test of the rally. If they hold, the divergence has a defensible explanation; if they crack, the bond market’s caution looks justified.
The bull case: why this is not 1999 repeated
The counter-argument is that AI demand is producing realised revenue and profit, which earlier bubbles lacked. Multiple independent buyers are spending at once (US cloud platforms, non-US governments, industrial users), with sovereign AI spending above $30B. And because AI is a general-purpose technology, concentration may broaden over time.
What happens if AI financing unwinds, and does election season make it worse?
The mechanism is circular. Tech firms borrow or tap private credit to build capacity and buy chips from Nvidia, and Nvidia’s valuation in turn supports further investment and issuance. Specific figures on AI bond issuance, private-credit volumes and circular structures were not found, so this stays at the level of mechanism.
The dependence is on a single category: about $89B of quarterly data-center revenue sits behind a $108B guide. If that cycle breaks, the chain would run like this:
- Hyperscalers or sovereign buyers cut capex.
- Earnings estimates are revised lower.
- Chip and cloud valuations reset.
- Lenders funding data centres and chips take losses.
- The index, heavily weighted to these names, drags lower.
One commentator argues an AI collapse could be worse than 2008 given the trillions of debt involved, while conceding it might be a decade away or never. That is a strong opinion, not a forecast. The research counterpoint is that risk centres on valuation and capex cyclicality more than opaque bank leverage, though links to shadow banking could raise systemic risk.
Election season as amplifier, not cause
Markets tend to lean toward stability heading into elections, with volatility often subdued until a shock. In 2016, markets stayed steady with brief spikes. In 2000, a contested outcome compounded a dot-com unwind. In 2022, oil and yields hit growth stocks and long bonds together.
Sentiment warning Bank of America warned around early August that bullish sentiment had “gone too far,” as reported.
Early September showed how quickly rates and oil can intrude: the 10-year rose above 4.8% with Brent near $99 just before key inflation data (unverified). The election is unlikely to cause a drawdown. It could be the moment an existing weakness in AI spending or rates gets noticed, which makes position sizing in concentrated tech matter more than guessing the vote.
History offers some reassurance on timing: the S&P 500 has averaged a 14.5% gain from late August through March in midterm election years since 1950, driven by resolved uncertainty rather than which party wins.
Reading the divergence without panic or complacency
The gap is real and dated. History says it is a question, not a verdict, and AI is both the explanation for equity strength and its main vulnerability.
Three variables deserve your attention:
- The 10-year yield and oil prices.
- The XLK, SOX and Nvidia charts.
- Hyperscaler capex and guidance updates.
Concentration and duration exposure are the choices you control. The election is not one of them.
This article is for informational purposes only and should not be considered financial advice. Investors should conduct their own research and consult with financial professionals before making investment decisions. These statements are speculative and subject to change based on market developments and company performance.