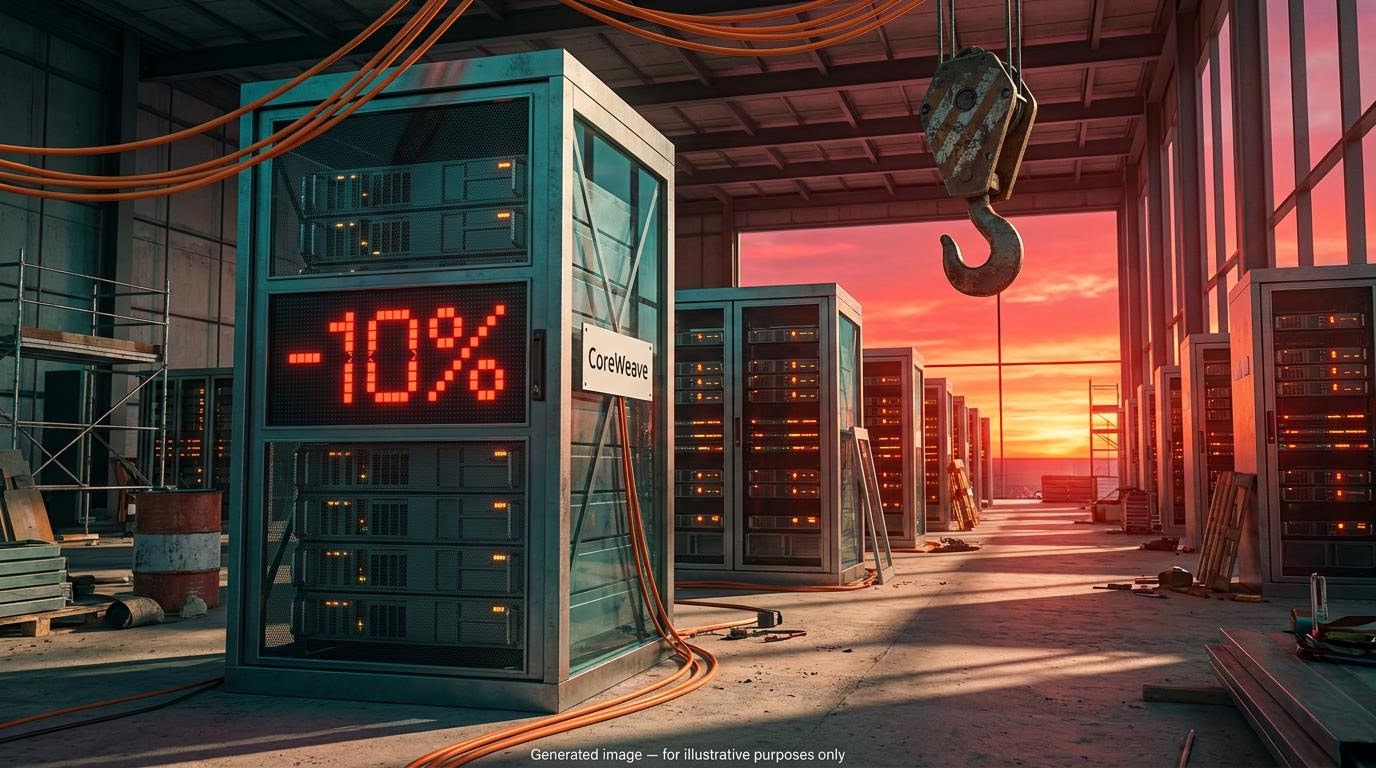
Revenue beat expectations. Shares fell anyway. On 22 October 2026, Meta dropped about 7% and CoreWeave slid about 10%, a split that points to a shift in how the market prices AI spending risk. Investors have stopped rewarding the size of AI budgets and started asking what those budgets will earn.
For two years, the market accepted that AI profits would arrive later. That patience has now run into harder questions about cost, financing and timing. The Nasdaq Composite reportedly fell about 2.6% on the day, its steepest drop since early June, according to press reports.
Here is a way to separate the cash-rich spenders from the leveraged ones using three measurable tests.
Why did strong earnings fail to lift tech stocks on October 22?
On the surface, the results did not explain the selloff. Meta grew revenue about 26% to roughly $64.6B. Tesla beat on both revenue and adjusted earnings.
The sell orders were aimed at numbers further down the page.
| Company | Approx. move, 22 October | Pressure point |
|---|---|---|
| Meta | -7% | Capex outpacing operating cash flow |
| Tesla | -2% to -3% | Falling margins, valuation tied to future ventures |
| Nvidia | -4.4% | Exposure to customers’ financing capacity |
| Micron | -6.3% | Exposure to AI hardware orders |
| CoreWeave | -10% | High bond yields and credit concerns |
| Oracle | -3% | Borrowing and data centre commitments |
Moves as reported by the financial press and not independently confirmed. The S&P 500 reportedly fell about 1.2% while the Dow finished roughly flat.
Demand for AI was not the problem. The common thread in the coverage was the amount being spent, who is financing it and how long the payoff will take.
The October selloff did not appear from nowhere; it extends the market’s shifting AI capex sentiment seen in August, when AMD, SpaceX and Sandisk all fell despite strong revenue beats.
The shift in one line Billy Leung of Global X ETFs said the market has moved from rewarding the size of capex announcements to asking who can earn an adequate return, as reported.
What this tells you is that revenue growth no longer shields a share price on its own. If you hold tech exposure, you now need to look at what each company spends to produce that growth.
When big ASX news breaks, our subscribers know first
How do Meta, Tesla, CoreWeave and Oracle compare on cash flow, capital intensity and financing?
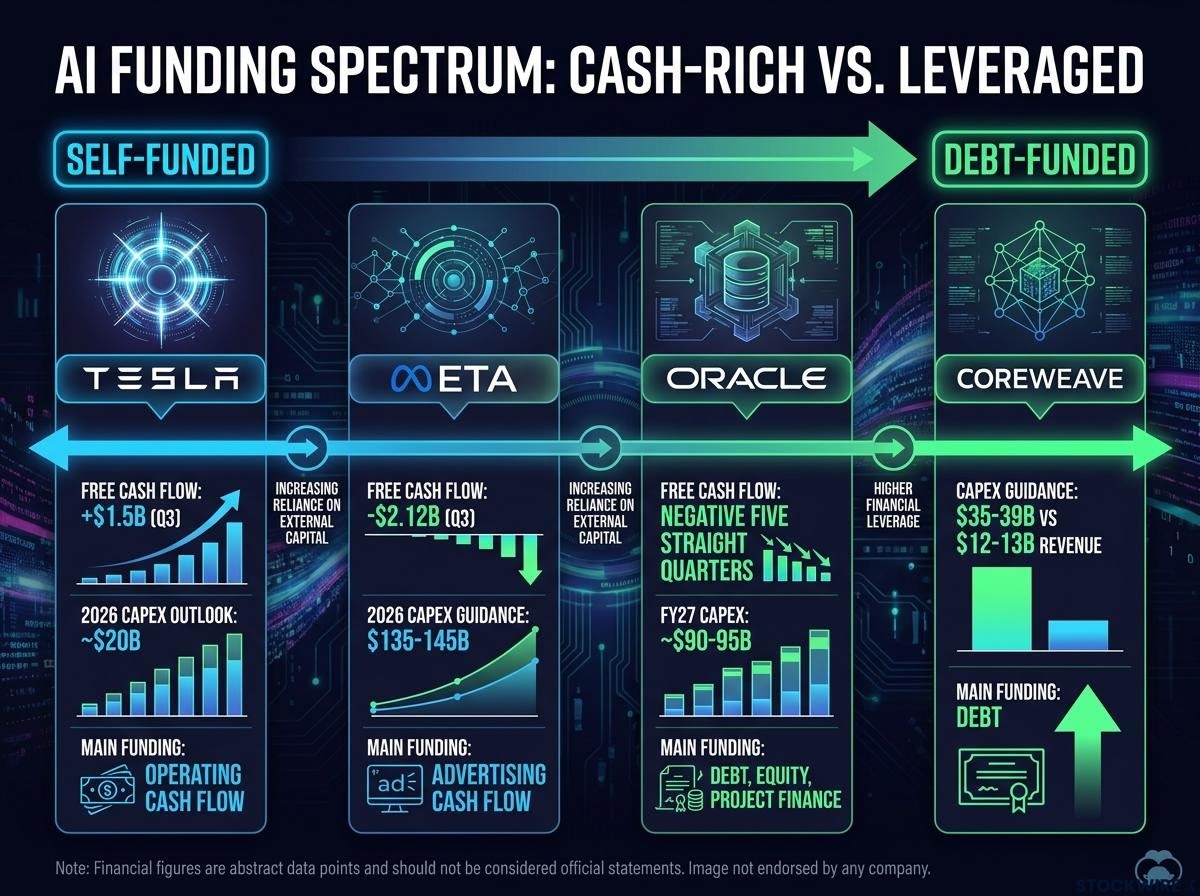
Placed side by side, the four companies sit along a spectrum. At one end, the business pays for its own AI build. At the other, lenders do.
| Company | Free cash flow | Capex position | Main funding source |
|---|---|---|---|
| Meta | -$2.12B (Q3) | 2026 guidance $135-145B | Advertising cash flow |
| Tesla | +$1.5B (Q3) | 2026 outlook cut to about $20B | Operating cash flow |
| CoreWeave | No Q3 release in coverage | $35-39B guidance vs $12-13B revenue | Debt |
| Oracle | Negative five straight quarters | FY27 about $90-95B | Debt, equity, project finance |
Meta and Tesla: funded from the core business
Meta generated about $32.79B in operating cash flow but spent $34.91B on capex, leaving free cash flow of about -$2.12B against roughly +$10.6B a year earlier. Its operating margin halved from 40% to 20%, although a legal settlement charge of nearly $9.9B explains part of that fall. The advertising engine still covers most of the bill.
Meta is not the first large spender to slip into negative free cash flow, as Alphabet posted its first such quarter as a public company in July after $44.9B of capex overwhelmed operating cash flow.
Tesla moved the other way, cutting its 2026 capex outlook from more than $25B to about $20B while producing positive free cash flow. It reportedly holds up to $30B of borrowing capacity with no planned draw. Its exposure lies in valuation rather than funding: George Noble of Noble Capital Advisors argued the robotics venture may be worth only about $30-40B of a roughly $1.4-1.5T market value.
CoreWeave and Oracle: leaning on outside capital
CoreWeave’s debt reached about $35.6B at 30 June, up from $11.2B a year earlier, and it plans to spend roughly $3 for every dollar of revenue. Its bonds traded at mid-teens yields during October, although sources differ on exact timing. HSBC projects an ROIC of 8.9% for 2026-2030, below its cost of capital.
Oracle has burned about $29B across five quarters despite roughly $664B in remaining performance obligations, meaning contracted revenue not yet delivered. It reportedly plans to raise about $40B, though no filing in the coverage confirmed the amount. A backlog is a signed promise, not cash to repay lenders.
Project Jupiter shows why. Oracle issued a force majeure notice over power delays at the campus, which carries about $18B of project financing, and its shares fell nearly 7% that day. That debt sits with the project, not necessarily in Oracle’s corporate bonds.
The comparison tells you that identical AI ambitions carry very different risk depending on whether a core business or a lender is paying.
How does AI spending risk build? The mechanisms behind the repricing
Spending on chips and buildings is only safe if the money comes back. When it doesn’t, several pressures start feeding each other.
- Capital intensity: Formerly asset-light firms now spend tens of billions a year on physical infrastructure.
- GPU depreciation: A graphics processing unit (GPU) is the chip that runs AI workloads, and a rented GPU loses value when a faster generation arrives.
- Collateral-value risk: Some CoreWeave loans are collateralised by Nvidia GPUs, so older chips may leave lenders holding less than they lent.
- Circular financing: A chip supplier may finance customers who then buy its chips, inflating apparent demand without proving end users will pay.
- The borrowing-cost loop: Reuters reported that a sharp rise in US 10-year Treasury yields pushed investors to test whether AI revenue could carry the debt.
- Construction and power delays: Project Jupiter showed that permits and grid connections can hold up revenue while interest keeps accruing.
How the loop feeds itself Costlier borrowing weakens project returns. Weaker returns make financing harder. Harder financing pushes yields higher still.
Demand is not the issue here. Nvidia chief executive Jensen Huang said neocloud demand is extremely strong but capital is scarce, and he expects that to be resolved.
For you, the point is that strong demand does not protect a company if its financing, collateral or construction schedule breaks first.
Is this a repeat of the late-1990s telecom overbuild?
The comparison is tempting. Telecom groups borrowed heavily to lay fibre ahead of demand, and many financiers lost badly even as the internet succeeded.
Where the parallel holds
- Debt-funded capacity built ahead of proven demand
- Optimistic forecasts and a belief that scarcity would last
- Computer and data centre investment reportedly at about 1.3-1.5% of GDP, against roughly 1.4% for telecom near the 2000 peak
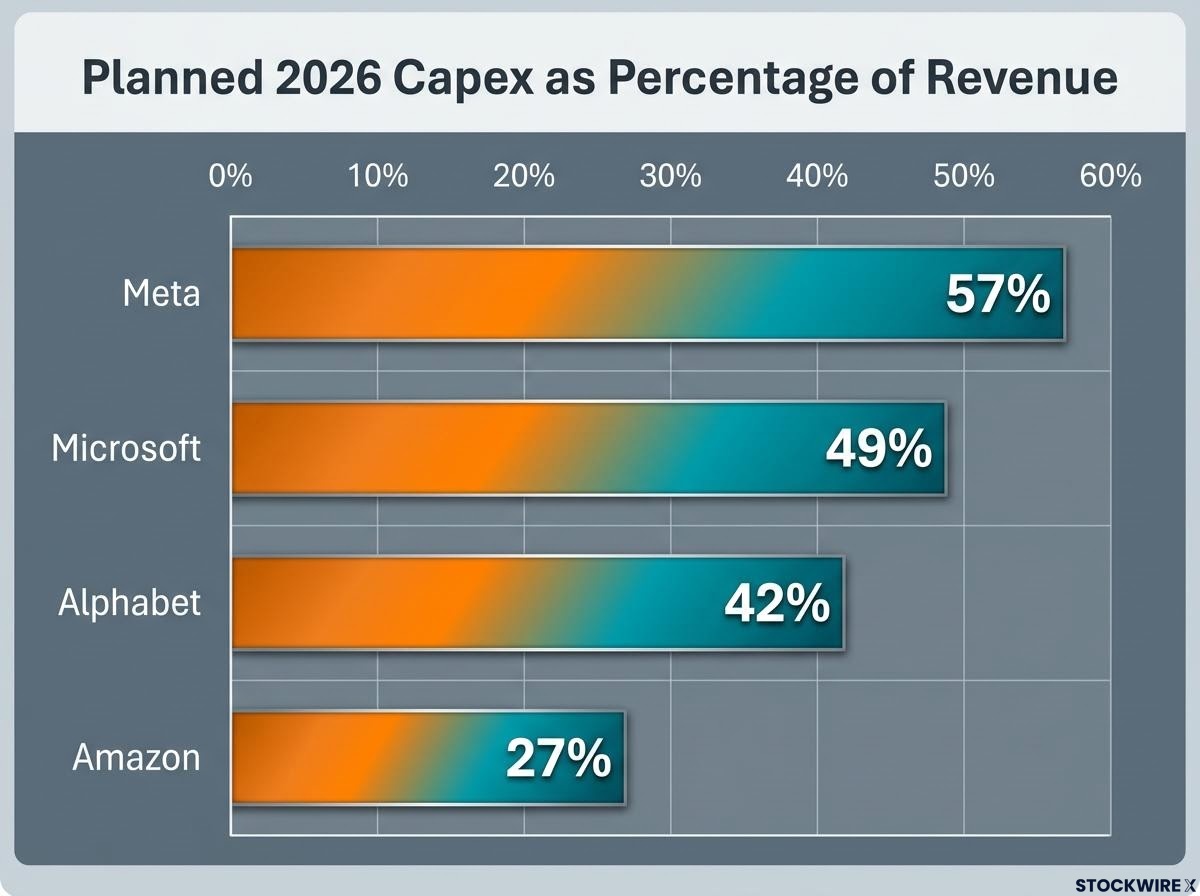
- Planned 2026 capex reportedly at about 27% of revenue for Amazon, 42% for Alphabet, 49% for Microsoft and 57% for Meta
Where it breaks down
- The largest AI spenders hold far stronger balance sheets than most telecom entrants did
- Customers are paying for AI capacity today
- Faster chip cycles add obsolescence risk but also generate repeat demand
The experts remain split, and the figures below come from press reports not independently confirmed.
| Viewpoint | Source | Core argument |
|---|---|---|
| Bullish | Andrew Sheets, Morgan Stanley | Borrowing at about 5.5-6% is rational if double-digit ROIC is expected |
| Bullish | Torsten Sløk, Apollo | Expected returns above 10% make the boom less sensitive to rate rises |
| Sceptical | Will Sommer, Gartner | About $3.6T of AI revenue against roughly $8.5T needed |
| Credit caution | Mark Zandi, Moody’s Analytics | AI bond issuance creates a larger leverage problem than the dot-com era |
The lesson concerns financing and utilisation, not whether AI works. Owning the winning technology and owning a profitable investment are different things, and the gap between them depends on what was paid for the capacity.
Planned 2026 spending at the largest hyperscalers is vast: combined hyperscaler capex plans of $720-745B would consume 93-94% of operating cash flow, with the gap funded largely by debt.
Which three metrics show AI infrastructure risk?
No single number settles the question. Read these three together.
- Free cash flow. Check operating cash flow minus capex, including finance-lease principal where relevant. The warning sign is a persistent shortfall: Meta’s -$2.12B is manageable if advertising keeps funding it, but troubling if debt begins filling the gap.
- Return on invested capital (ROIC). ROIC is after-tax operating profit divided by all the capital tied up in the business. Check it against funding costs, because a 5% return against 9% funding destroys value while 15% against 6% creates it before execution risk; Goldman Sachs analysis of China’s data centres reportedly found returns from about 5% to 43% depending on ownership model.
- Borrowing costs. Check bond yields, not only coupons. CoreWeave’s roughly 13-16% yields set a far higher hurdle than the 5-6% assumed in bullish hyperscaler cases.
| Metric | Healthy signal | Warning sign |
|---|---|---|
| Free cash flow | Temporary dip funded by the core business | Repeated negatives funded by new debt |
| ROIC | Comfortably above funding cost | Below cost of capital |
| Borrowing costs | Investment-grade spreads | Mid-teens yields |
Then stress-test the story:
- What happens if utilisation falls short of plan?
- How much would a one-generation GPU write-down cost?
- How dependent is revenue on one or two customers?
- What would lenders recover from the collateral?
Together, the three metrics tell you whether a cash shortfall is a temporary investment cycle or a structural problem financed by increasingly expensive debt. Past performance does not guarantee future results, and projections depend on market conditions.
What the selloff changes, and what it does not
The selloff did not cancel AI demand. It changed the test: capex now has to earn an adequate risk-adjusted return rather than being treated as automatically bullish.
Demand strength has historically favoured infrastructure suppliers over the spenders themselves, since a basket of 18 such suppliers gained 166% since late 2023 without any call on which model developer survives.
The spectrum holds. Cash-rich hyperscalers such as Meta have room to absorb a temporary investment cycle, while leveraged neoclouds and project-financed campuses have little margin for error.
Your next checkpoints are the coming earnings releases and credit-market moves. That is where free cash flow, ROIC and borrowing costs will show which spenders are building value and which are building debt.
This article is for informational purposes only and should not be considered financial advice. Investors should conduct their own research and consult with financial professionals before making investment decisions. Several figures cited come from press reports that have not been independently confirmed, and forward-looking statements are speculative and subject to change.