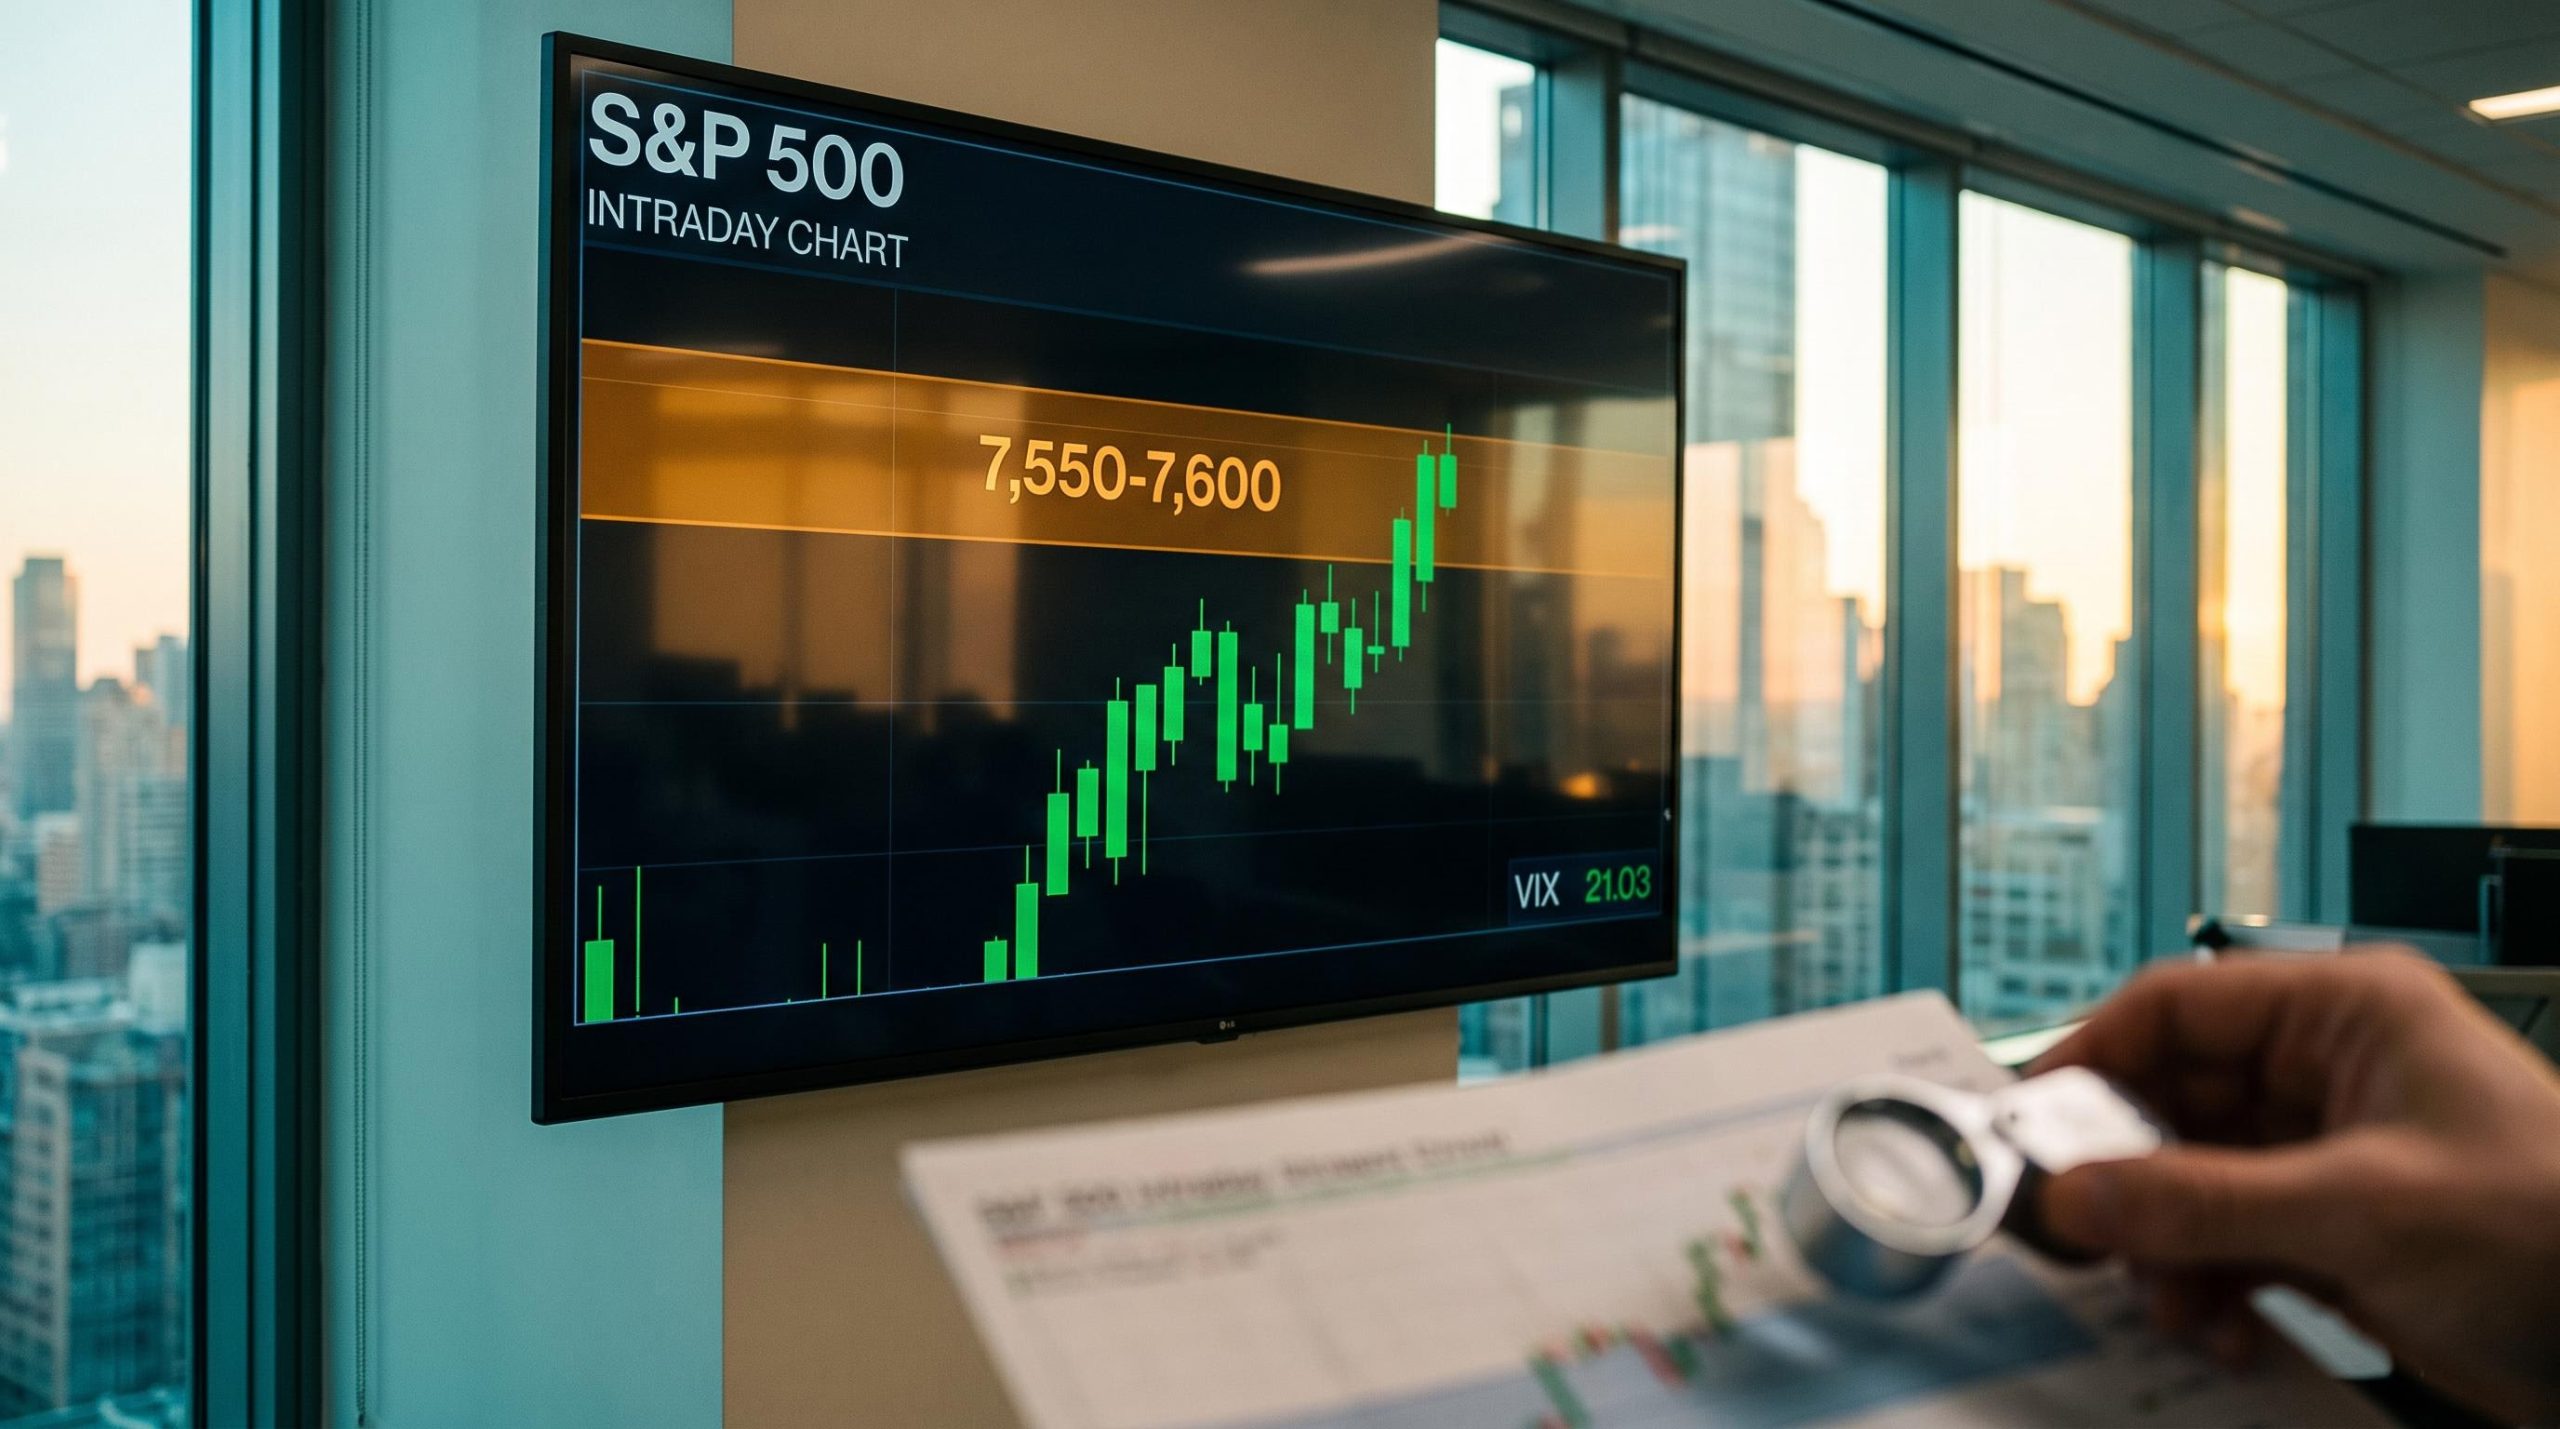
The S&P 500 rose as much as 1.93% on Monday 9 November 2026, and the Cboe Volatility Index (VIX) fell about 18% to near 21. At least one trader read that strength as a relief rally walking into overhead supply, and something to fade.
The timing matters. The October Consumer Price Index (CPI) lands Tuesday at 8:30 a.m. ET. It arrives after a month of net decline from 6 October to 6 November, so the open question is how much risk to carry into a binary event.
The session was still in progress when the data was captured, so all equity, volatility and metals figures here are intraday.
Here is how traders are applying supply zones, light exposure and volatility decay to this setup, and where the opposing views sit. With that, you can judge whether Monday’s bounce changes anything for your own positioning.
Why one trader expects the Monday bounce to stall at overhead supply
The rally had real force behind it. Schwab tied the early lift to a roughly 4% drop in crude and lower yields. Dip buyers then pushed tech higher, and that buying broadened into cyclicals and financials.
The market also shrugged off the Nvidia governance story. According to Barron’s, the S&P reached 7,519.37 intraday, against Schwab’s open snapshot of 7,376.86 (+0.31%). The gap between those figures reflects timing, not a dispute.
Strength alone does not make a good entry. Overhead supply is a price zone where former support broke, in this case on 5 November, and buyers who bought there are now trapped. When price climbs back to that zone, many of them sell to get out near breakeven, and that selling caps the advance.
The analyst maps cluster tightly around that zone.
| Analyst | Date | Key level or view |
|---|---|---|
| Robert Sluymer, RBC Wealth Management | 5 Nov | Support 7,508-7,578; resistance 7,770-7,845 |
| Schwab | 6-7 Nov | Broken neckline near 7,600; objective near 200-day average around 7,300 |
| Option Strategist | 6-7 Nov | Heavy resistance around 7,550-7,600 |
| Puru Saxena | 7 Nov | Selling exhaustion; possible multi-week rally |
| FXEmpire | 7-8 Nov | Nasdaq-100 structurally bullish despite correction |
The trader’s thesis follows from that overlap. The higher the index climbs, the thicker the supply gets, and in this view the easy part of the rally is already done. Exposure sits around 38%, with seven positions in one portfolio effectively in cash. The trader also sees SpaceX nearing exhaustion at supply.
Patience is the discipline that holds the plan together. Any short re-entries will likely wait until Tuesday, assessed stock by stock. The Nasdaq-100 picture is murkier, with Schwab flagging its broken 200-day average near 27,980 as possible resistance.
Treat 7,550-7,600 as a decision zone rather than a prediction. A rally into known resistance tells you the next move depends on whether buyers can absorb that supply.
The case against fading it
Saxena argues that forced selling, washed-out sentiment and elevated volatility have already removed many marginal sellers. FXEmpire sees the Nasdaq-100 holding a bullish structure.
Schwab adds a warning that cuts both ways: oversold markets can stay oversold. A VIX spike can mark a panic low, or it can mark the start of a deeper break.
When big ASX news breaks, our subscribers know first
What are gold, silver and Treasuries signalling into CPI?
The same falling oil that lifted stocks has been working through metals and bonds. Gold traded around $4,100-$4,140/oz, up from an 30 October low near $3,870-$3,880. Silver climbed from below $49 to roughly $52.74-$53.
Silver moved further because it carries two exposures. It trades as a monetary metal like gold, and it is also an industrial input, which tends to make its swings larger.
Silver’s pricing forces extend beyond oil and inflation: the dollar, real yields, Chinese solar demand and Indian consumer buying all act at once, which is why its swings outrun gold’s.
| Asset | Latest level | Recent extreme | Driver |
|---|---|---|---|
| Gold | $4,100-$4,140/oz | $3,870-$3,880 (30 Oct) | Lower oil, safe-haven demand |
| Silver | $52.74-$53/oz | Below $49 | Monetary and industrial demand |
| 10-year yield | 4.84-4.86% | About 5.21% (mid-Oct) | Easing inflation risk from oil |
The 10-year yield was down roughly 7 basis points on the week. A basis point is one hundredth of a percentage point. For the trader, silver’s return above its trend line is the signal that metals strength has returned, and the hope is for a multi-month metals rally.
The bond view pulls the other way. The trader holds March 2027 puts on IEF, the iShares 7-10 Year Treasury Bond ETF, and sees them as cheap. A put gains value if the price falls, which happens to bonds when rates rise.
The trader describes it as a patient bond short. It stays valid only while IEF does not break above a horizontal resistance level, and IEF’s Monday move was not available. A co-host has already exited long bonds after bonds and gold failed to rally on Thursday.
The soft-CPI case argues the opposite: a mild reading would extend the bond rally.
What this tells you is that metals and bonds are both pricing lower inflation pressure from oil. A CPI surprise could hit both at once, so treat them as one exposure, not two diversifiers.
How do put butterflies and short volatility work around an event?
A second trader, mostly short volatility, put on a put butterfly at 7,400/7,300/7,200 expiring at the end of the week. A put butterfly is a four-option trade that pays most if the index finishes near the middle strike.
- Buy one 7,400 put. This is the upper leg, and it starts gaining value as the index falls below 7,400.
- Sell two 7,300 puts. This is the middle leg, and the premium received cheapens the trade.
- Buy one 7,200 put. This is the lower leg, and it caps losses if the index falls further.
- Payoff zone. The maximum gain sits near 7,300 at expiration, and the maximum loss is the debit paid.
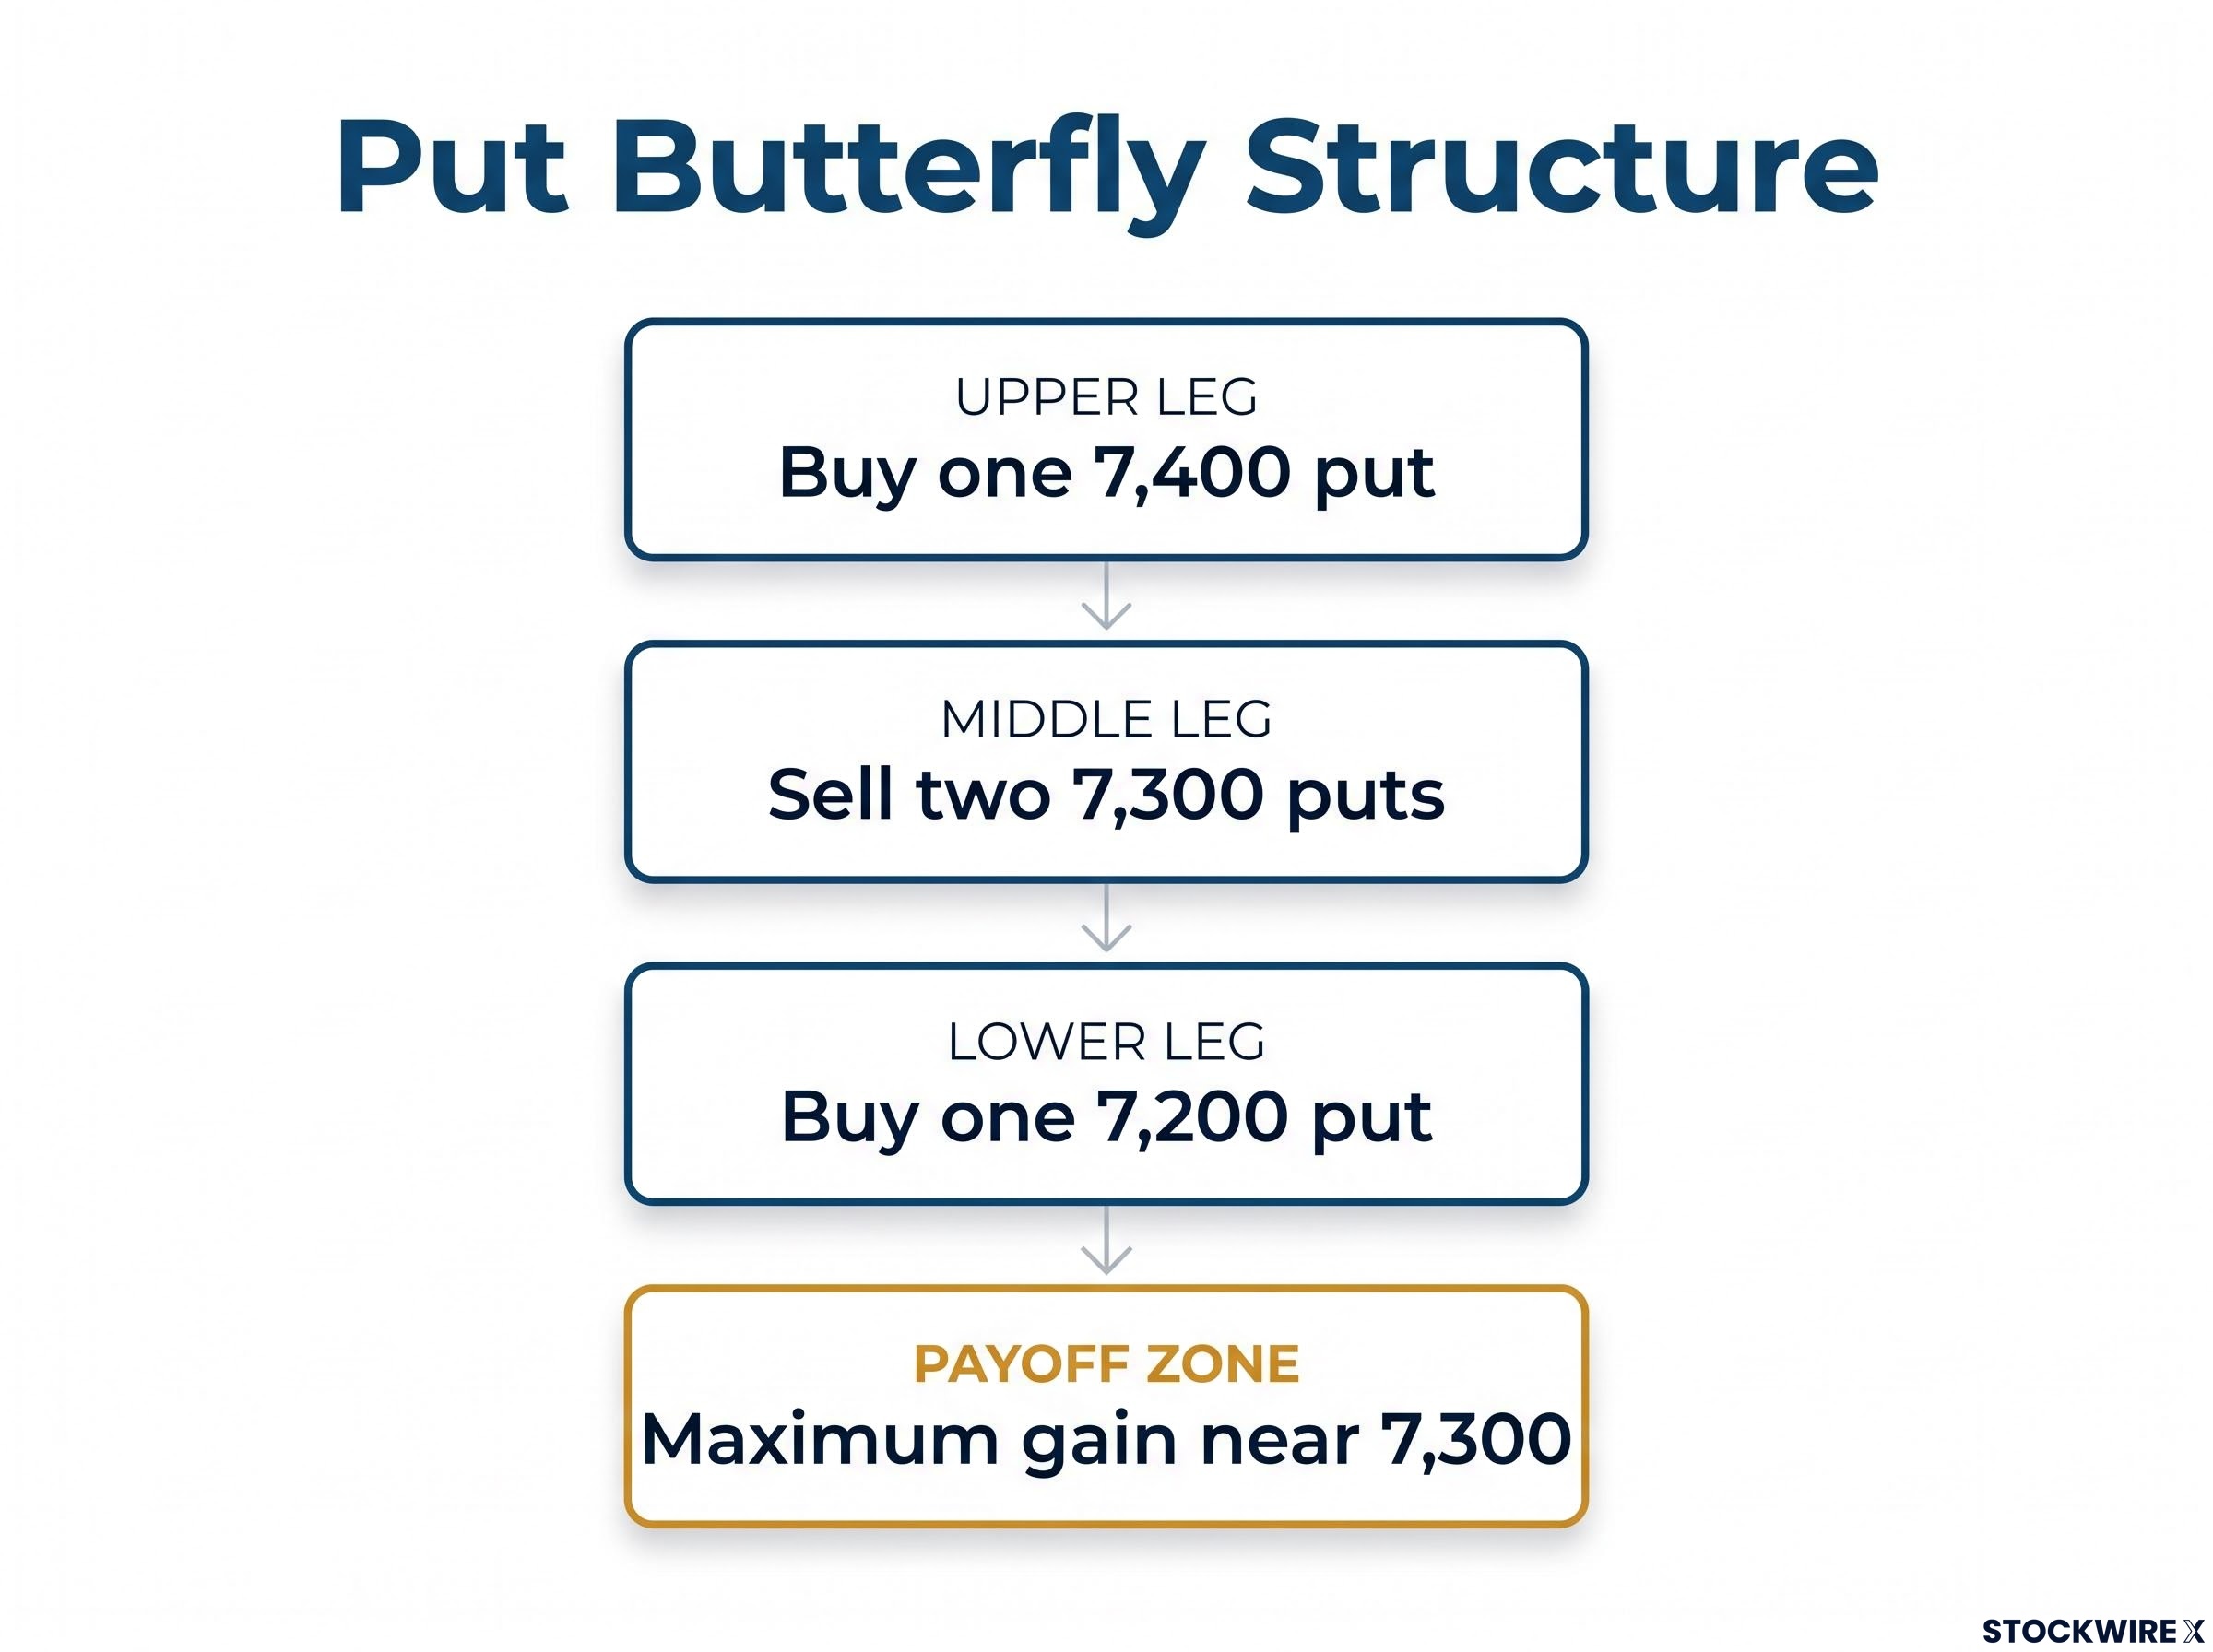
The put butterfly structure involves buying a 7,400 put and a 7,200 put while selling two 7,300 puts, with a maximum gain near 7,300.
The same trader holds short puts on MNQ, the Micro E-mini Nasdaq-100 futures, at about the 32,250 strike expiring 27 November. The book also includes in-the-money puts on MES, the Micro E-mini S&P 500 futures, as part of a year-long roll. The position collects about $400 a day in decay and is short roughly 900 vega.
Three option sensitivities, known as Greeks, explain what that means.
- Theta measures daily time decay. It helps a short-vol book, and this is where the $400 comes from.
- Vega measures sensitivity to implied volatility, the market’s priced-in expectation of future swings. Being short 900 vega means the position loses as implied volatility rises.
- Gamma measures how fast an option’s direction exposure changes. It hurts short options near expiration, when small moves cause outsized swings.
The VIX sat at 21.03, with futures at 20.75, 20.30 and 20.80. Heavy trading in SPY 730 puts expiring 12 November shows that others are hedging the release.
A VIX drop before CPI doesn’t remove event risk; IV can reprice sharply afterward.
Volatility compression patterns help explain why sellers of premium feel comfortable in calm tapes, yet the same data shows worst-case losses jumping once the selection filter lifts, which is why decay income carries real tail risk.
Where each structure can go wrong
The butterfly can lose its full debit if the index does not finish near the payoff zone. Short volatility suffers when a gap or a trend arrives alongside rising implied volatility. Losses then become convex, meaning they grow faster than the move itself.
Overnight skew and gamma near expiration add to that risk. Daily decay feels like income, but it is payment for carrying gap risk. Size these trades to survive a hot CPI rather than to maximise carry. This is general education, not personalised advice.
What could CPI change for these trades?
The release lands Tuesday, 10 November, at 8:30 a.m. ET. Consensus for headline CPI sits at about +0.2% to +0.3% month on month, with core at about +0.2%. September came in at +0.6% headline, +0.3% core, and 3.7% headline year on year.
The forecasts are not uniform. ING expects 0.3% for both headline and core, enough in its view to keep a December rate increase likely. Schwab cited 0.3% headline and 0.2% core.
There is a data caveat. October 2025 CPI was not produced during the government shutdown, so official year-on-year comparisons are unavailable. FactSet’s median estimates of 4.0% headline and 2.8% core conflict with that and should be treated cautiously.
| Scenario | Yields | Equities | Metals | Volatility |
|---|---|---|---|---|
| Soft | Likely lower | Supportive | Supportive | Likely eases |
| In-line | Little changed | Supply zone decides | Trend holds | Event premium bleeds out |
| Hot | Likely higher | Pressure on growth stocks | Pressured | Abrupt spike possible |
RBC’s Sluymer flagged the 5.17% area on the 10-year as a likely stall point for bond-yield bounces, which gives a reference if a hot print pushes yields higher. These scenarios are speculative and subject to change based on market developments.
The 10-year yield reaction after each inflation release has been the market’s real-time verdict, and the June episode showed a hot headline need not de-rate equities if core detail is judged manageable.
A soft print helps bonds and metals, while a hot one hurts growth stocks and short-vol books. Decide in advance which outcome your positions actually depend on.
What the bounce settles, and what only CPI can
Monday showed buyers willing to step in, but it did not resolve the setup. Price has rallied into thick supply. Exposure is light, bearish hedges carry defined risk, and short-vol positions are opportunistic, all waiting on one number.
Three markers will tell you the most after the release:
- Whether the S&P clears 7,600
- How the 10-year yield behaves around 4.84-4.86%
- Whether silver holds above its trend line
The useful decisions are the ones you can control: position size, defined risk and patience. Waiting for confirmation costs little compared with being caught on the wrong side of a gap.
This article is for informational purposes only and should not be considered financial advice. Investors should conduct their own research and consult with financial professionals before making investment decisions.