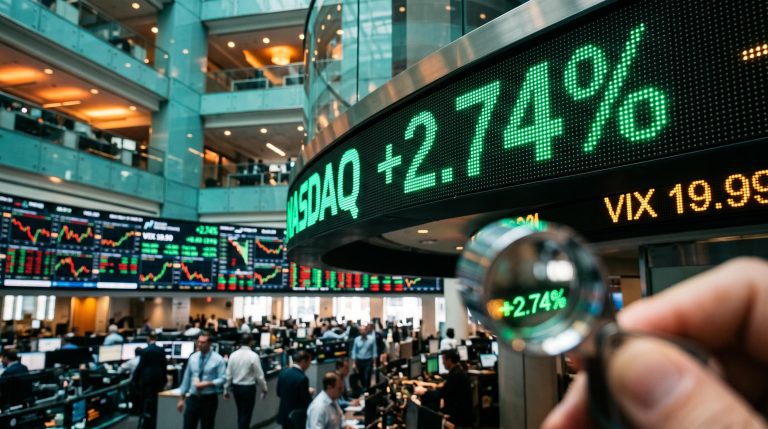
Oil fell almost 4.5% on Monday, to about US$86.37 a barrel for WTI crude. On paper, that should have hurt the commodity-linked Australian dollar. Instead, AUD/USD rose about 0.88% to roughly 0.6924, which complicates any simple forecast that ties the Australian dollar to oil.
The timing explains why the move matters. It came one day before the October US consumer price index (CPI) report, due on Tuesday 10 November. CPI measures the change in prices US consumers pay for goods and services. Markets are already pricing an 82% chance that the Federal Reserve raises rates in December, and the pair sits between important chart levels.
Here is the framework for reading how oil, rate expectations and chart levels combine in this pair. It also sets out the CPI outcomes that would test the rebound, and the levels each one points to.
Why did the Australian dollar rise as oil fell?
The answer starts with the other half of the pair. AUD/USD prices the Australian dollar in US dollars, so a weaker US dollar lifts it mechanically. According to TMGM and FXStreet, the Australian dollar was the strongest currency against the greenback on 9 November.
That strength followed reports of revived US-Iran nuclear talks. Al Arabiya and Al Jazeera described a Qatari-Pakistani proposal that would reportedly let the US accept Iranian uranium enrichment up to 3.67%. These are proposals and ongoing talks, not a concluded deal, and parts of the reporting come from unconfirmed newswire items.
President Donald Trump, 9 November 2026 Trump said there was “positive momentum” and that a resumption of strikes was “quite unlikely.”
How the oil channel works
The headline travels through five channels:
- Oil and geopolitics: a credible peace process lowers the chance of supply disruption, which pulls oil and risk premiums down.
- US dollar and yields: cheaper oil can lower expected US inflation and Treasury yields, which weakens the dollar.
- Risk sentiment: less Middle East risk supports shares and other risk-sensitive assets, which generally helps the Australian dollar.
- Australian terms of trade: terms of trade compare export prices with import prices. Lower oil cuts import costs but weakens energy export revenue and commodity sentiment.
- China exposure: the Australian dollar trades as a liquid proxy for Chinese and Asian growth. ING said renewed US-China tension or a Chinese slowdown would hurt the currency.
Why the dollar leg dominated
On Monday, channels two and three overpowered channel four. Safe-haven demand for the US dollar faded and risk appetite improved, which outweighed the hit to Australia’s terms of trade.
The reverse happened in late October and early November. FXStreet noted that Middle East escalation then fed a “tighter-for-longer” Fed loop, with higher oil feeding inflation fears and supporting the dollar.
What this tells you is that AUD/USD is as much a US dollar trade as an Australian one. When an oil headline lands, ask first what it does to Fed expectations, because that is where most of the move comes from.
When big ASX news breaks, our subscribers know first
How hawkish is the Fed, and what does US CPI need to show?
If Fed expectations drive the pair, the evidence heading into Tuesday points one way. According to CME FedWatch data cited by TMGM, the probability of a December hike sits at 82%, up from 76% the previous Friday. Last week’s nonfarm payrolls report pushed that pricing higher.
December Fed hike pricing also reflects a supply-driven inflation backdrop, with producer energy prices accounting for most of the rise in goods prices, which is one reason a hold would be the bigger surprise.
Fed officials added weight on Monday:
- Thomas Barkin, Richmond Fed: said risks are tilted toward the inflation side of the Fed’s dual mandate.
- Austan Goolsbee, Chicago Fed: said services inflation has accelerated in recent months, which undercuts the view that high prices stem only from tariffs.
Consumers are not expecting relief either. The New York Fed’s October Survey of Consumer Expectations showed median expected inflation of 3.9% at one year, 3.3% at three years and 3.0% at five years. All were unchanged, and all sit above the Fed’s 2% target.
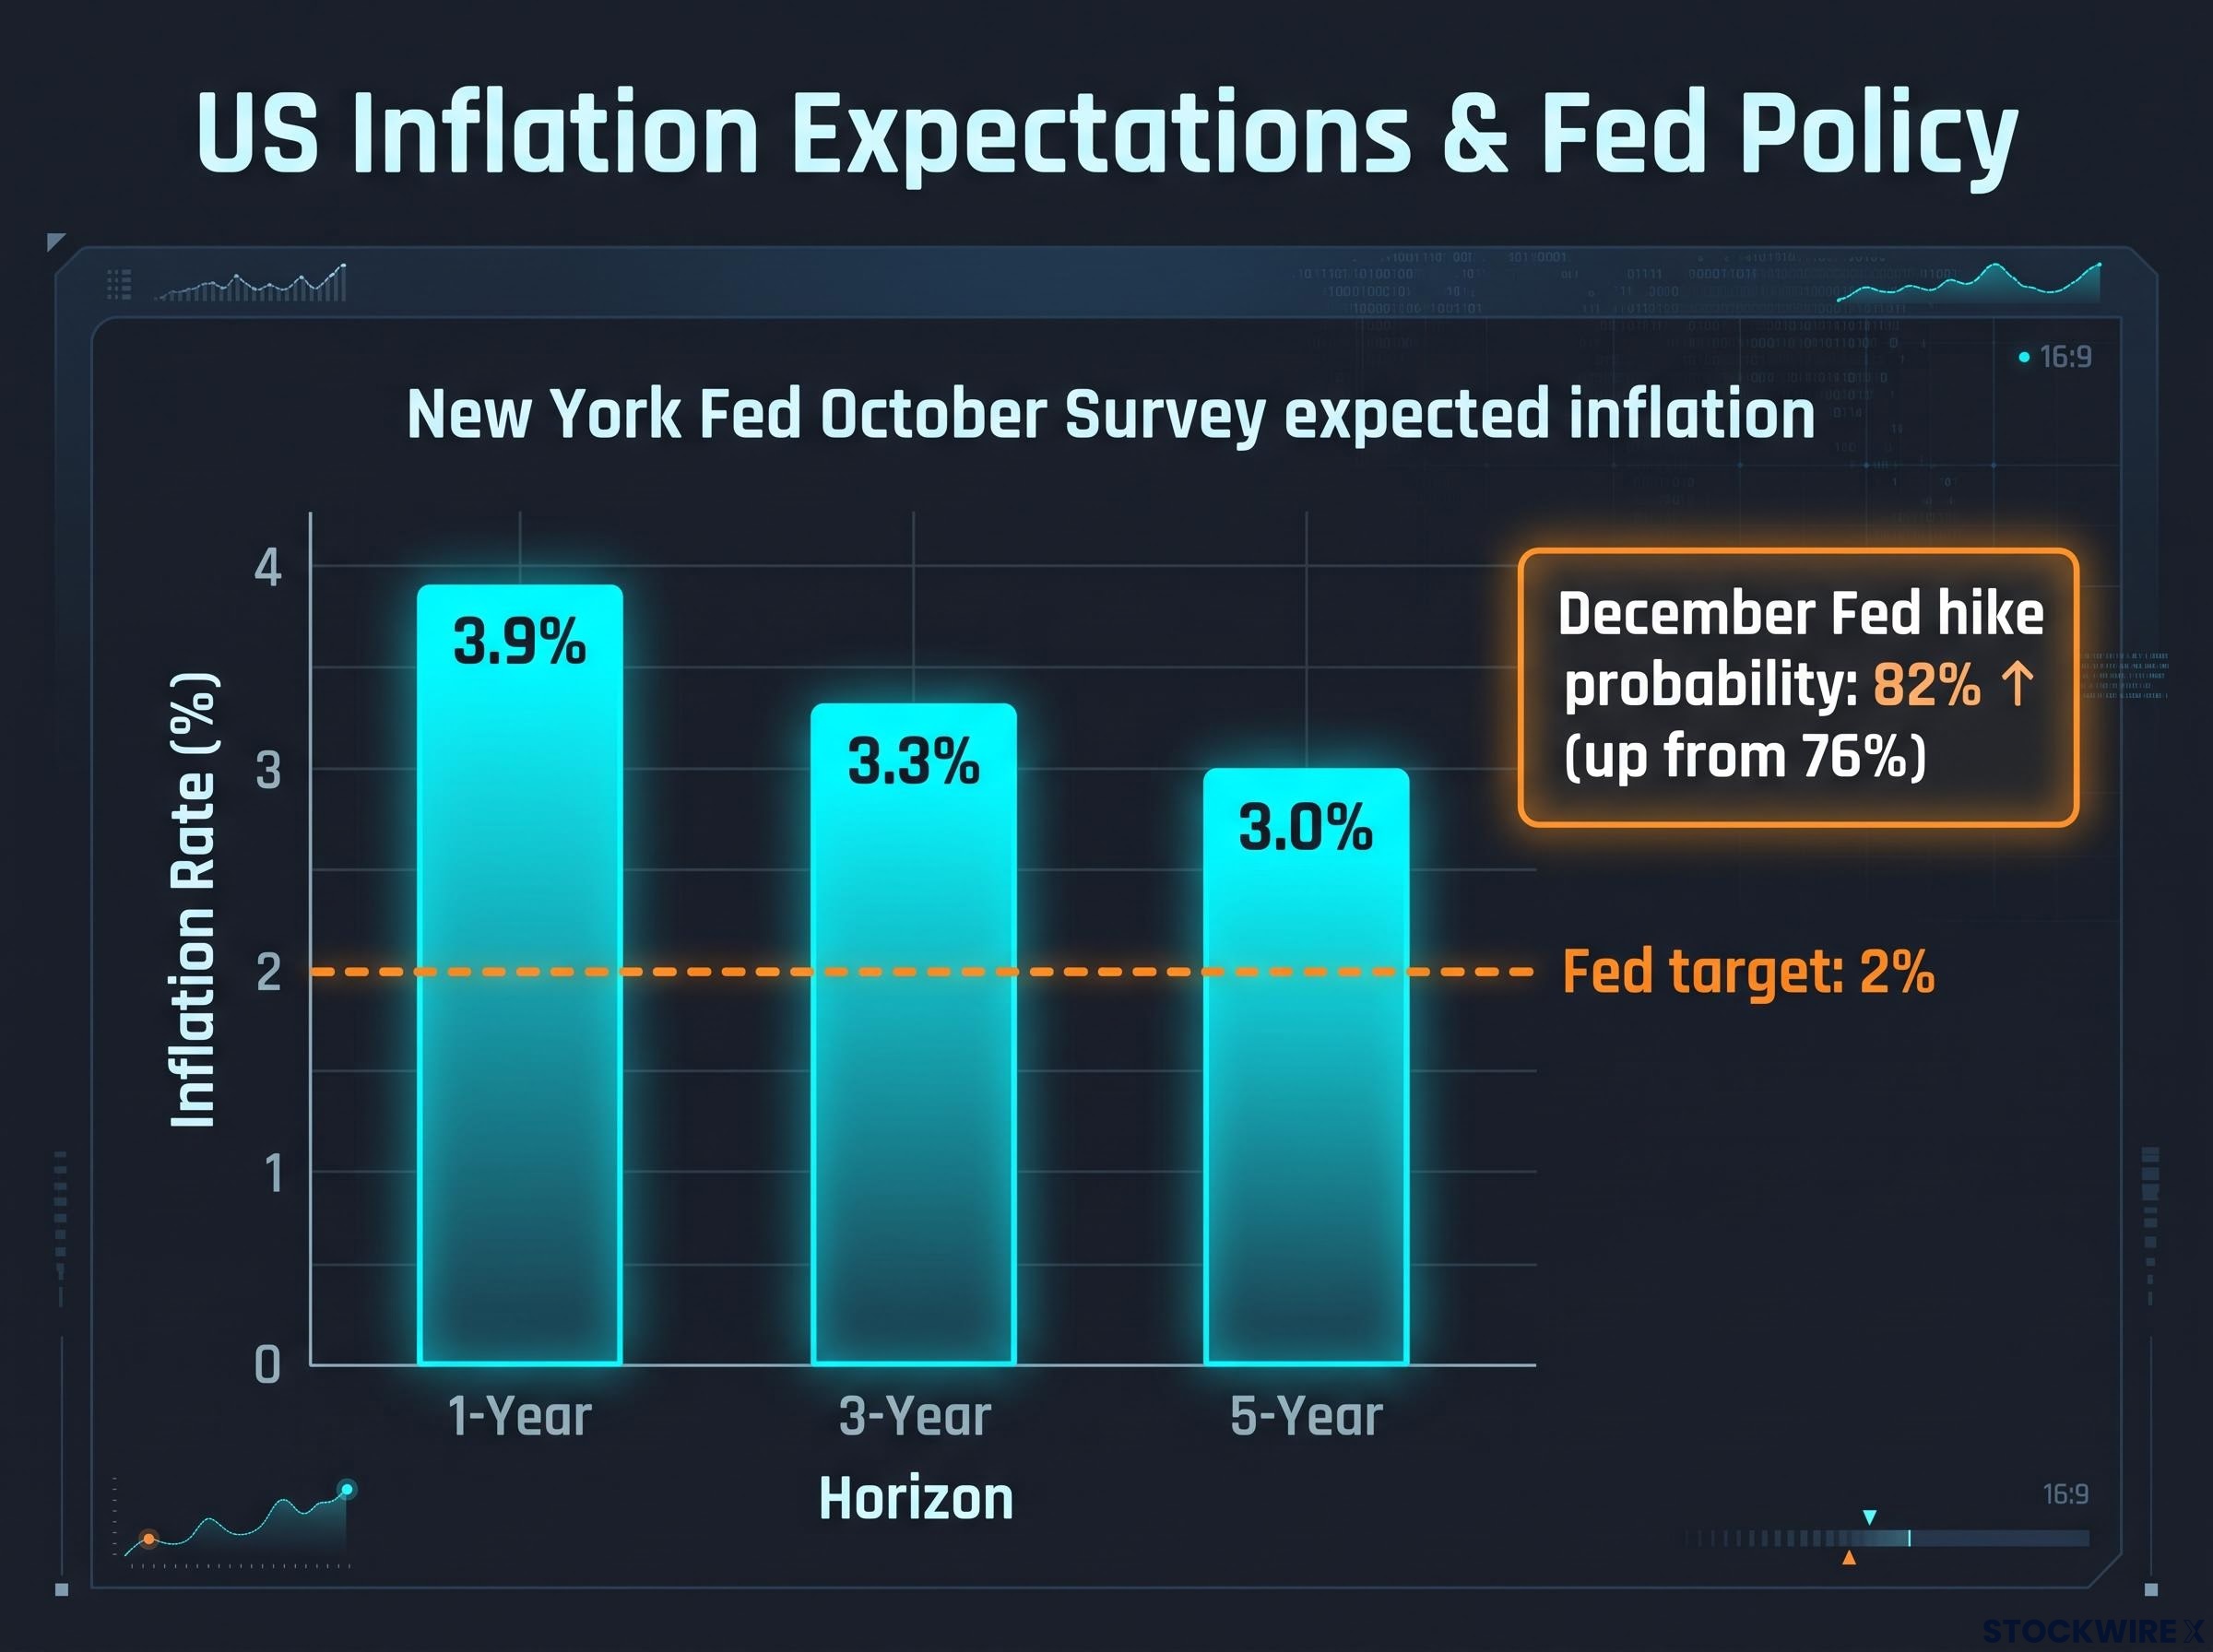
The New York Fed’s October Survey shows expected inflation sits well above the 2% target, with the December Fed hike probability at 82%.
That stacked evidence sets a high bar for Tuesday’s print. StoneX lists the consensus forecasts below.
| Indicator | Latest/Consensus | Prior |
|---|---|---|
| December Fed hike probability | 82% | 76% (previous Friday) |
| Headline CPI, October YoY (consensus) | 3.9% | 3.7% |
| Headline CPI, October MoM (consensus) | 0.3% | n/a |
| Core CPI, October YoY (consensus) | 2.8% | 2.6% |
| Core CPI, October MoM (consensus) | 0.2% | n/a |
Core CPI strips out volatile food and energy prices, so the Fed treats it as a cleaner read on underlying inflation.
Here is the catch. The market has already priced a great deal, and the quick jump in hike odds after payrolls leaves dollar positioning open to profit-taking if CPI fails to confirm it.
For you, that means the surprise against consensus matters more than the headline figure. A hot print largely confirms what is priced. A soft print forces a repricing, and repricings move currencies further.
Where does the RBA leave the Australian side of the pair?
A 4.85% cash rate sounds like strong support for the Australian dollar. The Reserve Bank of Australia (RBA) raised rates by 25 basis points on 3 November in a 6-3 vote, yet OANDA and Commerzbank both read it as a dovish hike. A basis point is one hundredth of a percentage point.
The dovish reading came from the RBA’s greater concern about weakening employment and the absence of explicit guidance toward further increases. Commerzbank added that Australian growth and labour forecasts were softening, and that inflation was partly driven by external oil shocks.
RBA monetary policy tends to move the currency through the gap between what the central bank delivers and what markets expected, which is why a hike read as dovish can still leave the Australian dollar without a clear lift.
That tone contrasts with the data that set up the hike. Australia’s September CPI rose to 4.3% year on year from 4.0%, above the 4.2% consensus, which had lifted hike expectations. ANZ now expects the RBA to hold in December. Westpac says further hikes are not its base case, though the risk of a February move has risen.
China adds little help. TMGM reported October Chinese CPI at 0.7%, below the 0.8% expected, a sign of weak domestic demand in Australia’s largest trading partner.
Competing readings of the rate gap
The rate differential, the gap between US and Australian rates, cuts two ways. In the near term, an 82% hike probability and a pausing RBA widen the gap in the US dollar’s favour. Over a longer horizon, several banks still forecast the pair above spot.
| Institution | View/Target | Reasoning |
|---|---|---|
| Westpac | About 0.72 end-2026 | Further RBA hikes not the base case (earlier 2026 forecast) |
| NAB | About 0.73 end-2026 | Support now, moderation later (earlier 2026 forecast) |
| MUFG | About 0.71 Q4 2026 | US dollar strength easing (earlier 2026 forecast) |
| ING | Near 0.7100 year-end | Acknowledges near-term USD and dovish-RBA pressure |
Treat these as medium-term views that depend on US dollar strength fading, not predictions for the days after CPI. The Monday rebound leaned on US dollar weakness, not Australian strength.
Past performance does not guarantee future results. Financial projections are subject to market conditions and various risk factors.
Which AUD/USD levels matter, and how do CPI scenarios map onto them?
With the fundamentals pulling in different directions, the chart shows where the tug of war currently stands. Spot sits near 0.6924, with the 14-day relative strength index (RSI) at 41.8. RSI measures momentum on a scale of 0 to 100, and a reading below 50 signals downside pressure without oversold conditions.
Support below spot
Forex.com describes the pair as technically bearish below 0.6925. OANDA flagged breaks below 0.7000 and 0.6918 as signs of deteriorating momentum, and StoneX sees near-term downside risk focused on the March low.
Resistance and the moving-average cluster
A simple moving average (SMA) is the average closing price over a set number of days. The 50-, 100- and 200-day SMAs bunch near 0.7040, forming a heavy barrier.
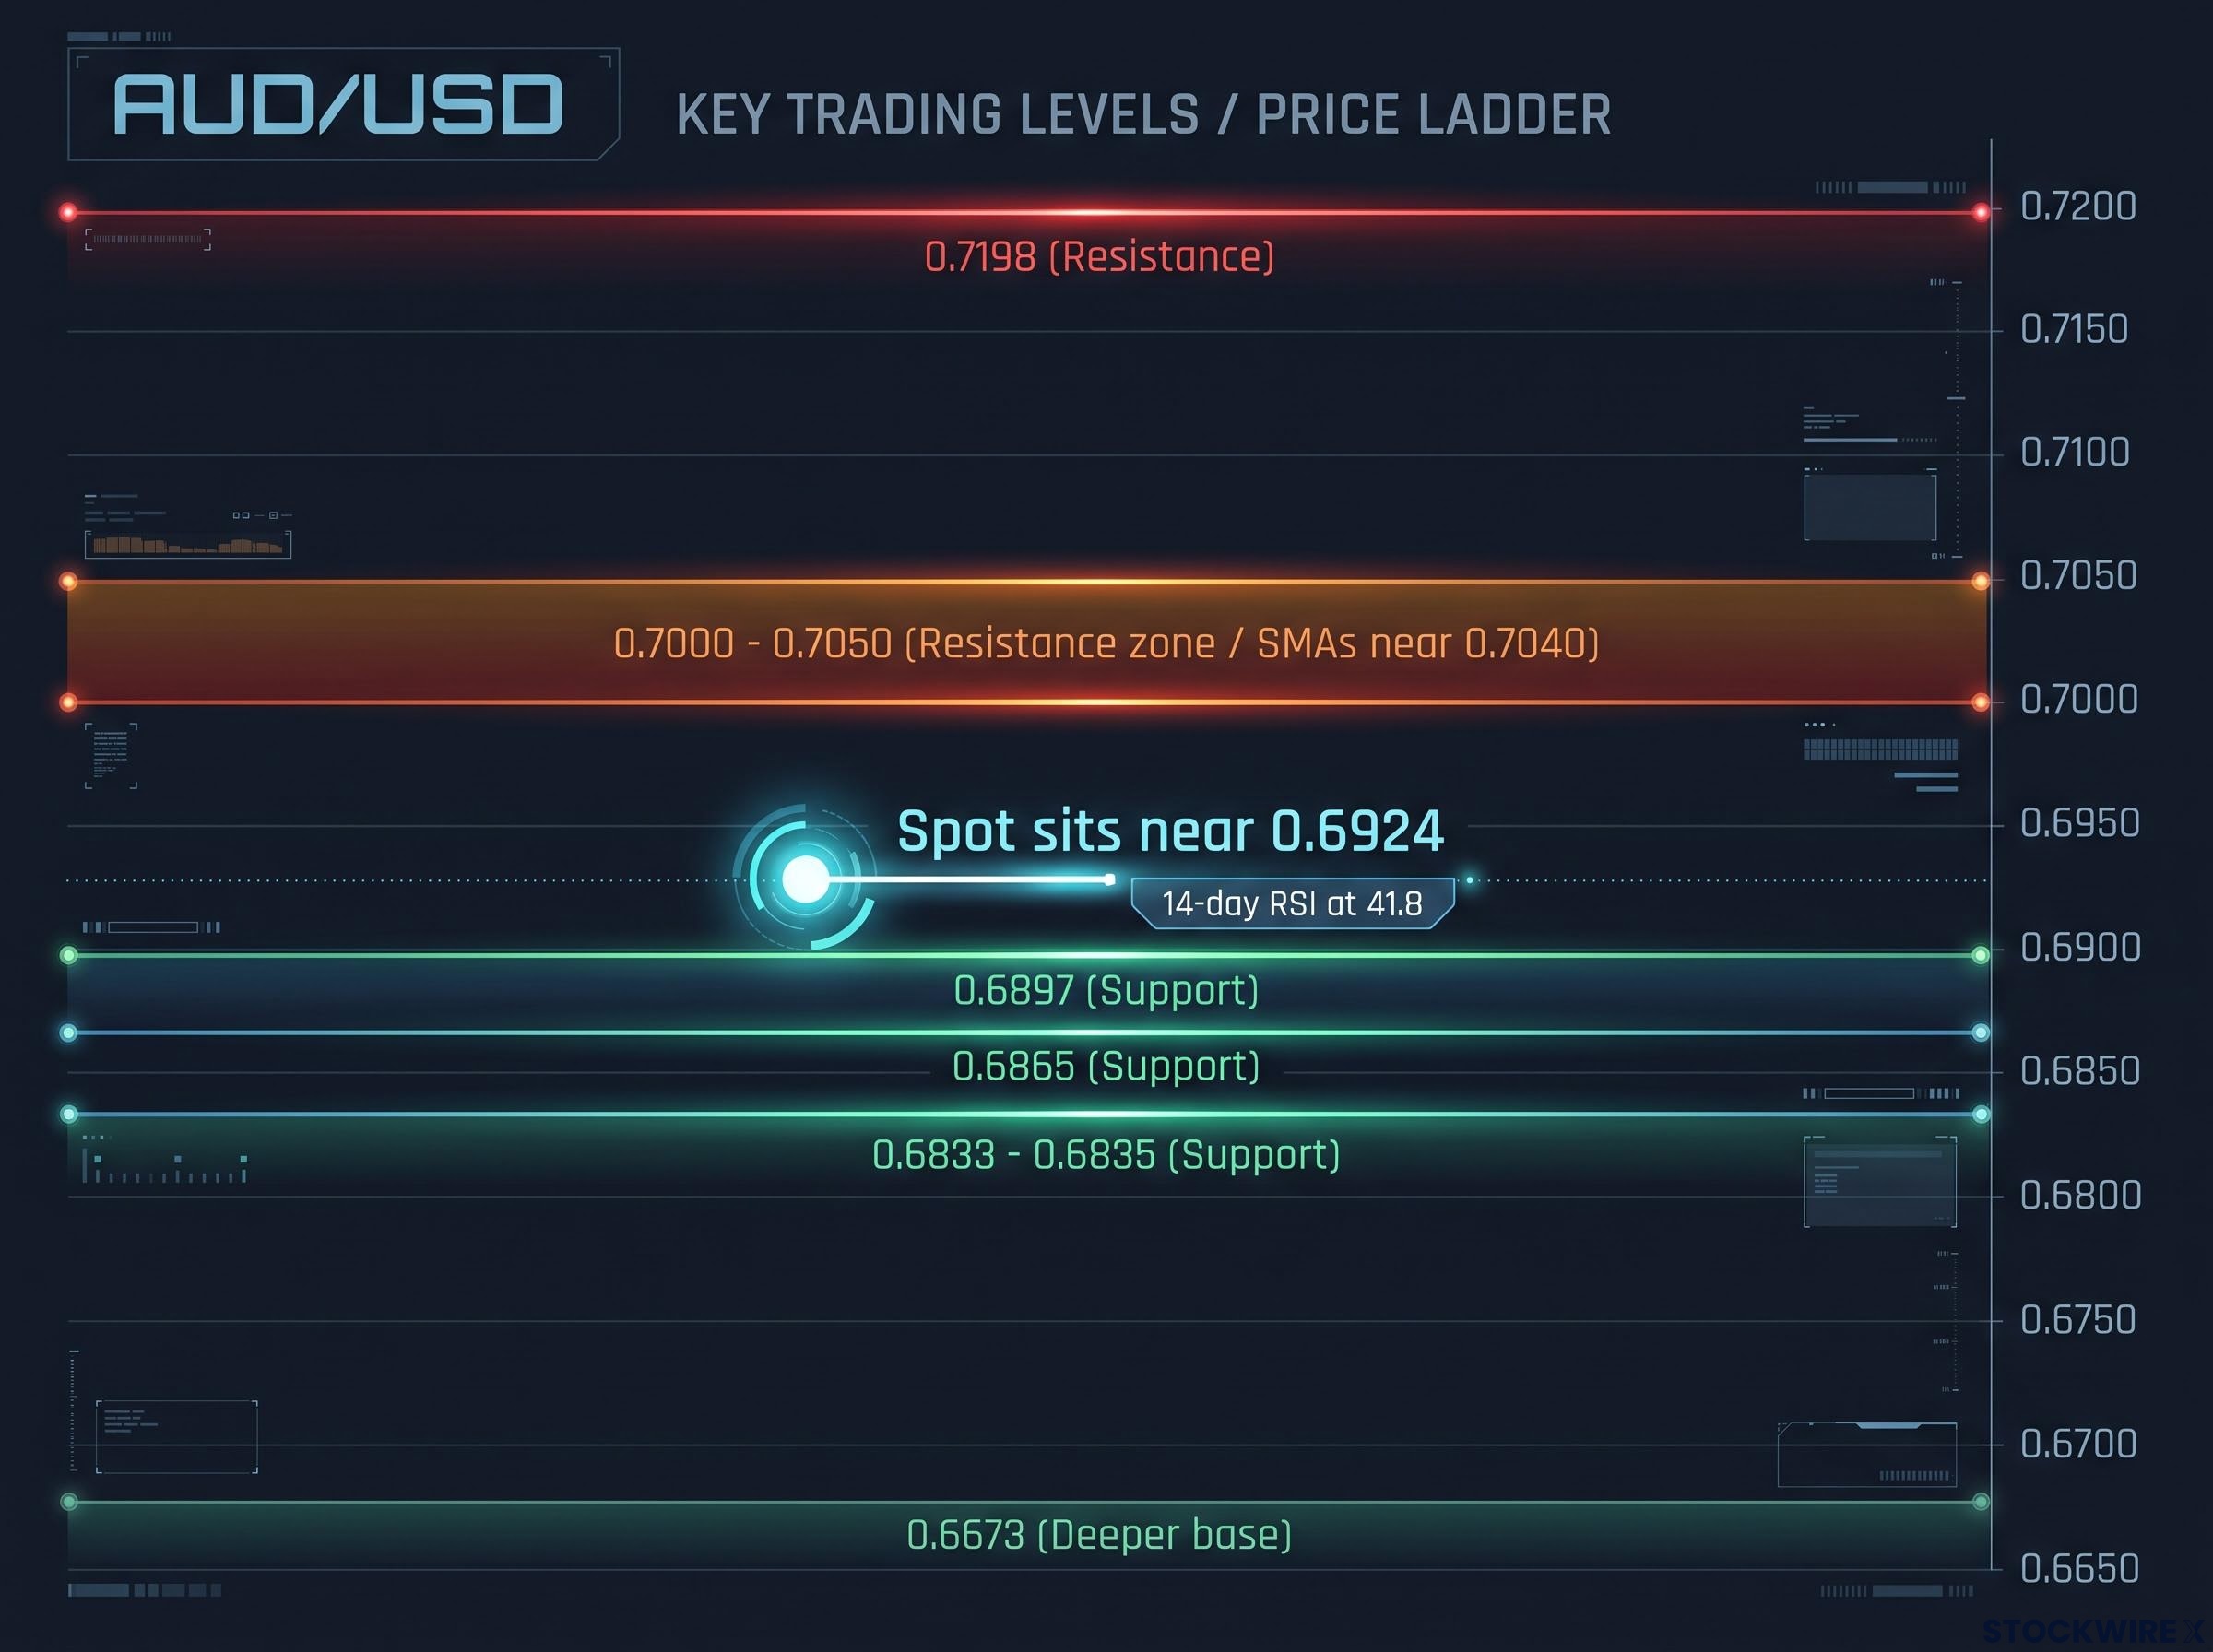
With the spot near 0.6924 and 14-day RSI at 41.8, the pair faces resistance at 0.7198 and finds support down to 0.6673.
| Level | Type | Source/Meaning |
|---|---|---|
| 0.7198 | Resistance | Beyond the moving-average cluster |
| 0.7000-0.7050 | Resistance zone | 50-, 100- and 200-day SMAs near 0.7040 |
| 0.6897 | Support | Trend-line pivot |
| 0.6865 | Support | June-low area |
| 0.6833-0.6835 | Support | March-low area, next downside target |
| 0.6673 | Deeper base | Rising trend-line origin |
A long-term downtrend line from 0.8015 sits far above. The FXStreet technical section behind several of these levels was produced with an AI tool, and every level describes momentum, not fundamental value.
The CPI outcomes map onto those levels like this:
- Hot CPI: OANDA says an upside surprise could lift terminal-rate expectations and yields, strengthening the dollar and pushing the pair through 0.6897 toward 0.6865 or 0.6835.
- In-line CPI: the print would largely confirm current pricing, leaving the pair tested around 0.6897 with the bearish bias below the moving averages intact.
- Soft CPI: by inference from OANDA and StoneX rate-channel analysis, lower hike odds and yields could weaken the dollar and allow a recovery toward 0.7000-0.7050.
Two risks could override any scenario. A collapse in US-Iran talks could spike oil and revive safe-haven dollar demand, and another Australian inflation surprise could revive RBA hike pricing.
The way a CPI print transmits through real yields to the dollar, gold and AUD/USD together was visible in April, when a 3.8% reading pressured all three markets and stalled the Aussie at multi-year resistance.
What this tells you is that 0.6897 is the first test of whether the rebound holds. A move through 0.7040 is what it would take to change the bias.
What the CPI print decides, and what to watch after it
The threads now line up. Oil and Iran headlines set the tone, Fed expectations set the direction, a dovish RBA caps Australian upside, and chart levels frame the reaction. The bottom line: hot CPI favours 0.6865-0.6835, while soft CPI could restore 0.7000-0.7050.
Watch the sequence in this order:
- US CPI against consensus on 10 November
- Developments in US-Iran talks
- Further Fed speakers
- The next Australian inflation data and RBA signals
- Chinese economic data
The US-Iran talks remain unconfirmed, and no outcome on any of these fronts is certain. These statements are speculative and subject to change based on market developments.
This article is for informational purposes only and should not be considered financial advice. Investors should conduct their own research and consult with financial professionals before making investment decisions.