
The Memo That Halved Meta’s AI Infrastructure Cost Estimate
5 hrs ago

Reece Ltd’s dividend yield has quietly climbed to roughly 1.86-1.98%, nearly double its 5-year historical average of approximately 1.06%. For a stock that has rarely offered income investors much to get excited about, that shift deserves scrutiny.
With the RBA cash rate still elevated and term deposits offering 4-5%, Australian income investors are recalibrating which equities justify the risk premium. A yield elevation in a quality blue-chip can mean two very different things: a genuine valuation opportunity, or a warning sign dressed as a bargain. The distinction matters, and it requires more than a glance at a stock screener.
This analysis unpacks what Reece’s yield movement actually signals, how to read it alongside earnings growth and payout ratios, and whether REH belongs in an income-focused ASX portfolio right now. The framework applied here, comparing current yield to historical averages in the context of earnings quality and rate conditions, is one income investors can reuse well beyond this single stock.
The numbers create their own tension. Reece Ltd’s trailing twelve-month dividend sits at approximately 18 cents per share, fully franked. At the current share price, that translates to a yield of roughly 1.86-1.98%, with some data sources placing the figure as high as 2.22% depending on measurement basis and timing.
Set that against the historical record:
“Reece’s current yield of approximately 1.98% sits nearly twice its 5-year historical average of 1.06%, driven largely by a 3.5% share price retreat since early 2025.”
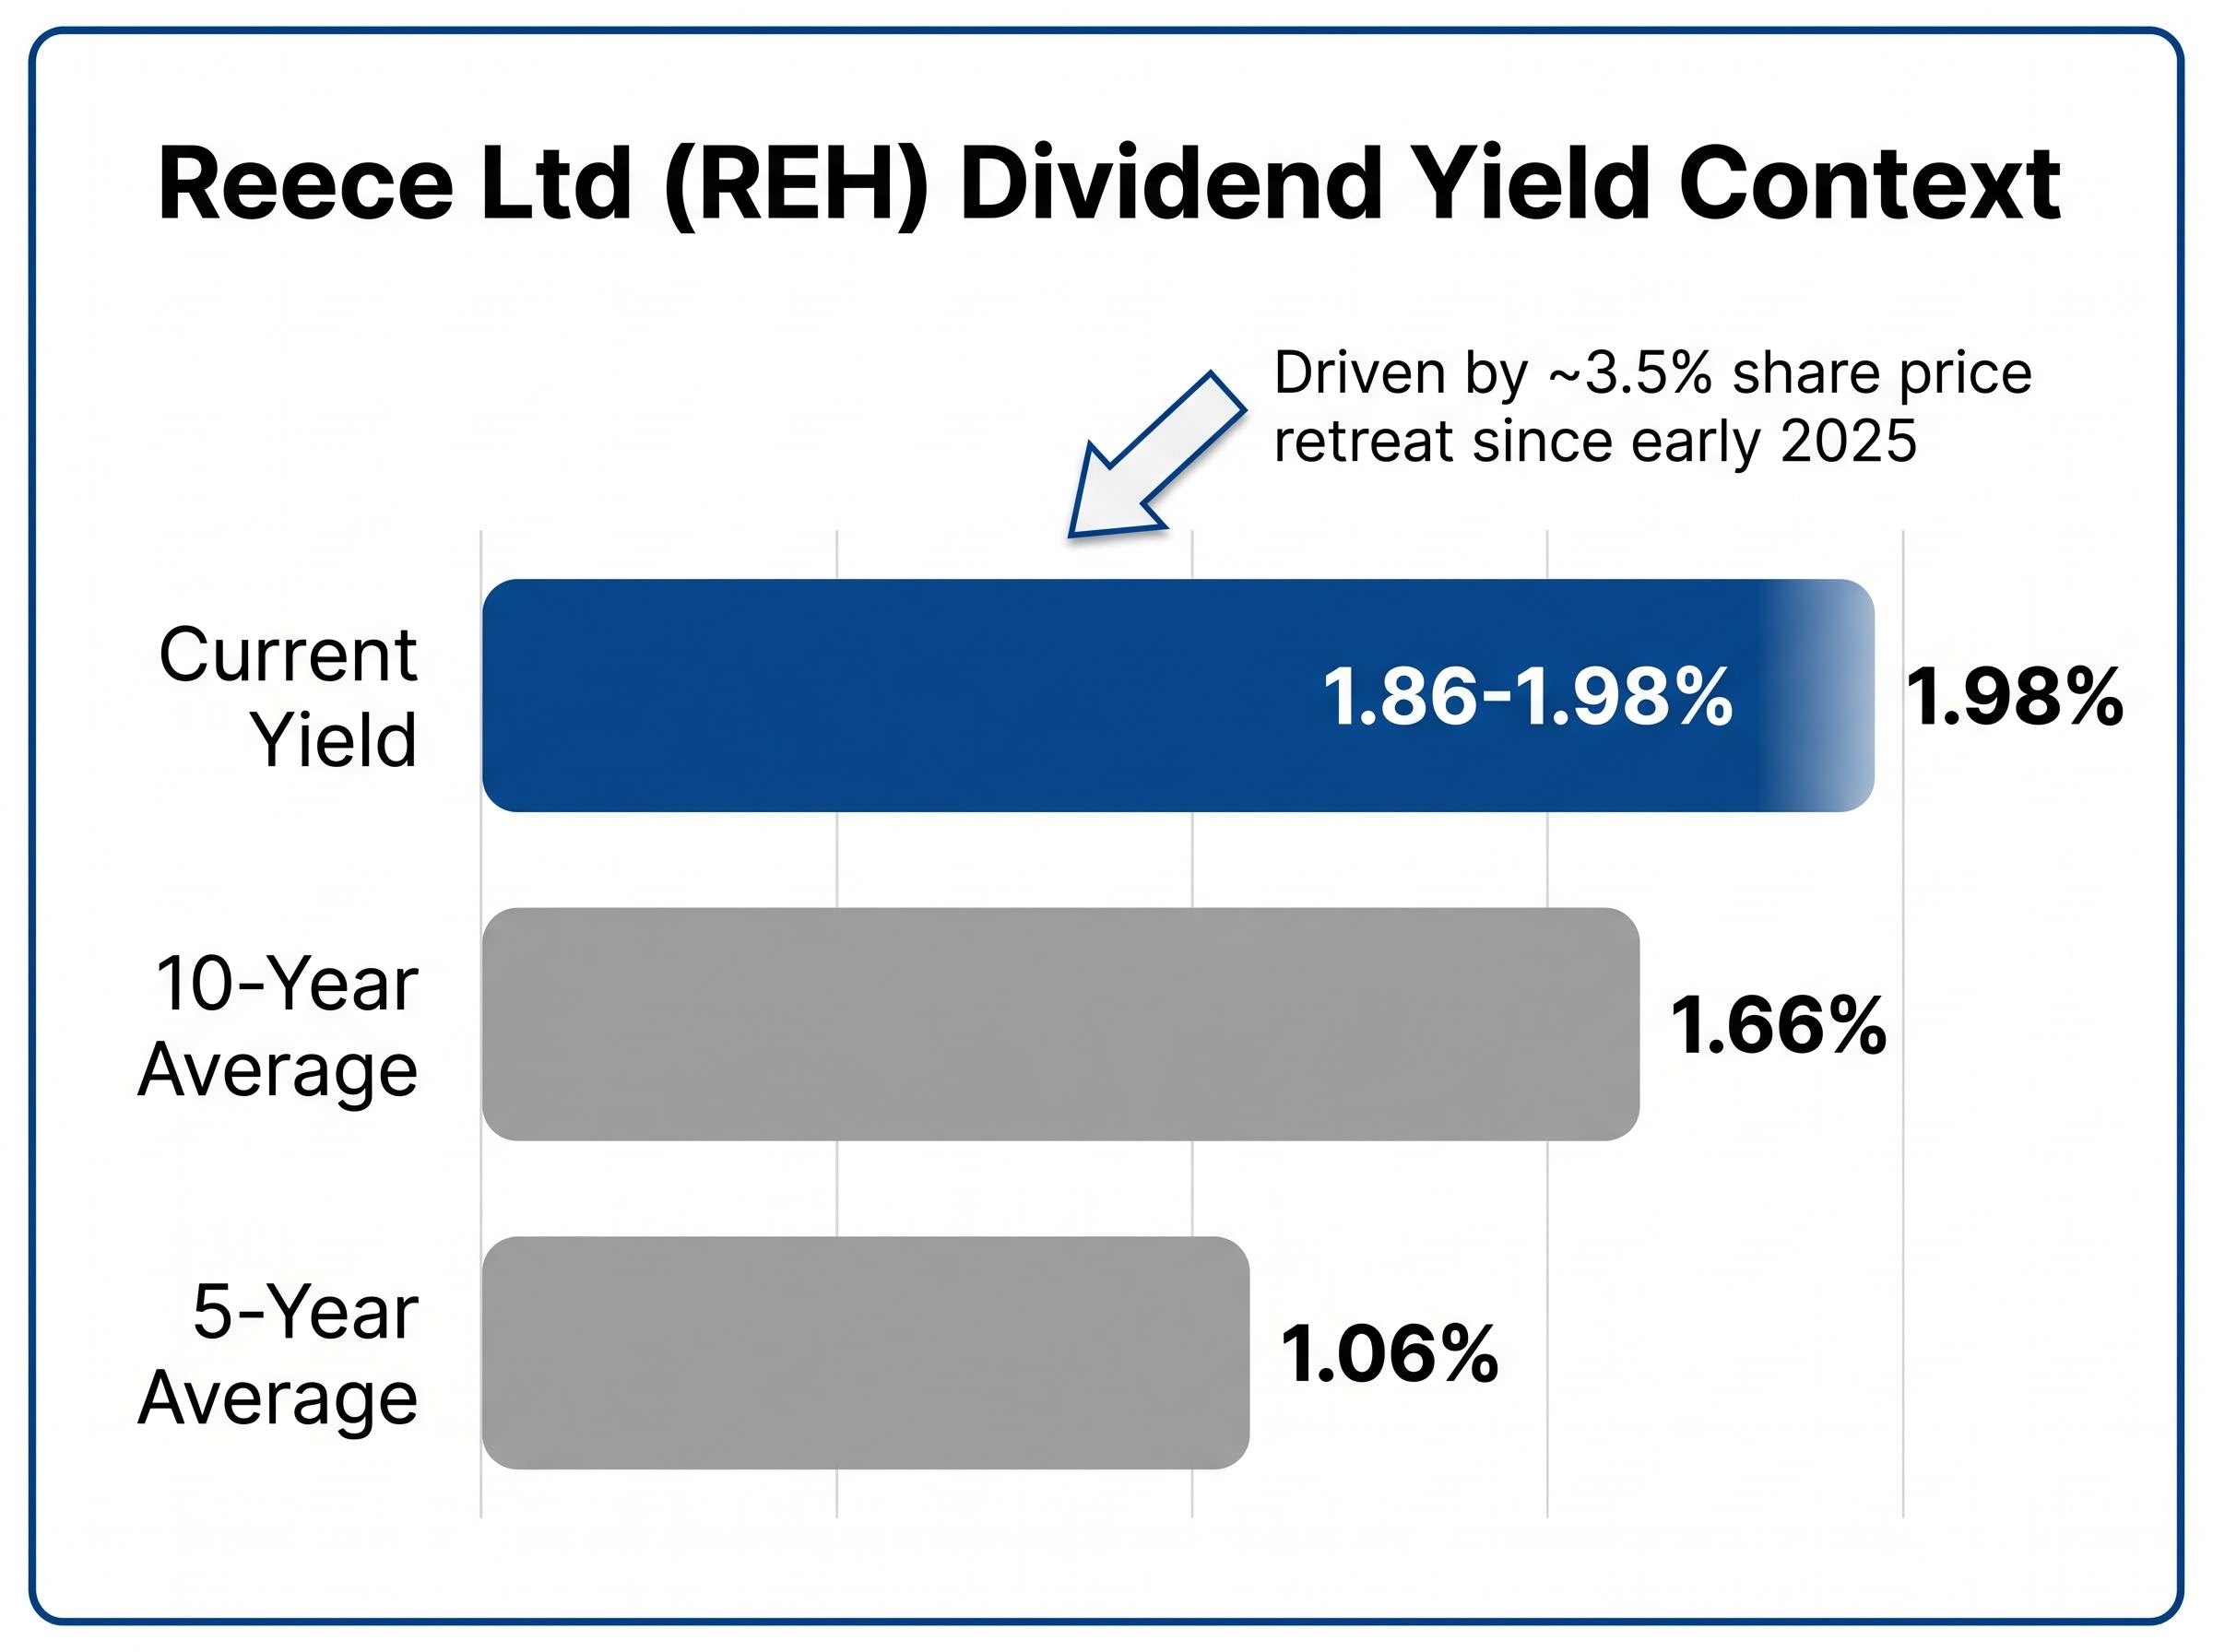
The share price decline of roughly 3.5% since early 2025 is the primary mechanical driver here, not a dramatic increase in the dividend itself. That distinction opens the interpretive question at the centre of this analysis: is this a value signal, or simply a reflection of a broader structural re-rating in a higher-rate environment?
For income investors screening ASX industrials, the data point alone is enough to put REH on the watchlist. Whether it belongs in the portfolio requires a closer look at the mechanics behind the number.
Dividend yield is a ratio: annual dividend divided by share price. It moves inversely with price and proportionally with dividend changes. That means a rising yield can tell two fundamentally different stories, and the first question any investor should answer is which story applies.
When yield rises because the dividend grew, the business is returning more cash to shareholders. When yield rises because the price fell, the market is repricing the stock, and that repricing may or may not reflect a deterioration in fundamentals.
Reece illustrates the price-driven case. The TTM dividend of approximately 18 cents has not changed dramatically; the share price decline of roughly 3.5% since early 2025 has done the work.
The distinction between dividend yield and total return is foundational to interpreting any yield movement correctly; a rising yield that coincides with sustained capital erosion is not a valuation opportunity but a warning, and research across more than 500 S&P 500 firms confirms that ex-dividend price drops average approximately 99.8% of the payout size.
A disciplined approach to interpreting this signal follows three steps:
For investors seeking a more comprehensive valuation, Discounted Cash Flow (DCF) and Dividend Discount Models (DDM) offer deeper analytical rigour. Yield comparison is a starting point, not a final answer.
Comparing a stock’s current yield to its own history neutralises industry-level differences. A 2% yield on an industrial compounder means something different from a 2% yield on a utility, and cross-company comparisons can obscure more than they reveal.
The limitation is that historical averages embed past market conditions. The 5-year average of 1.06% for Reece was set during a period of lower interest rates and different growth expectations, conditions that may not return in the near term.
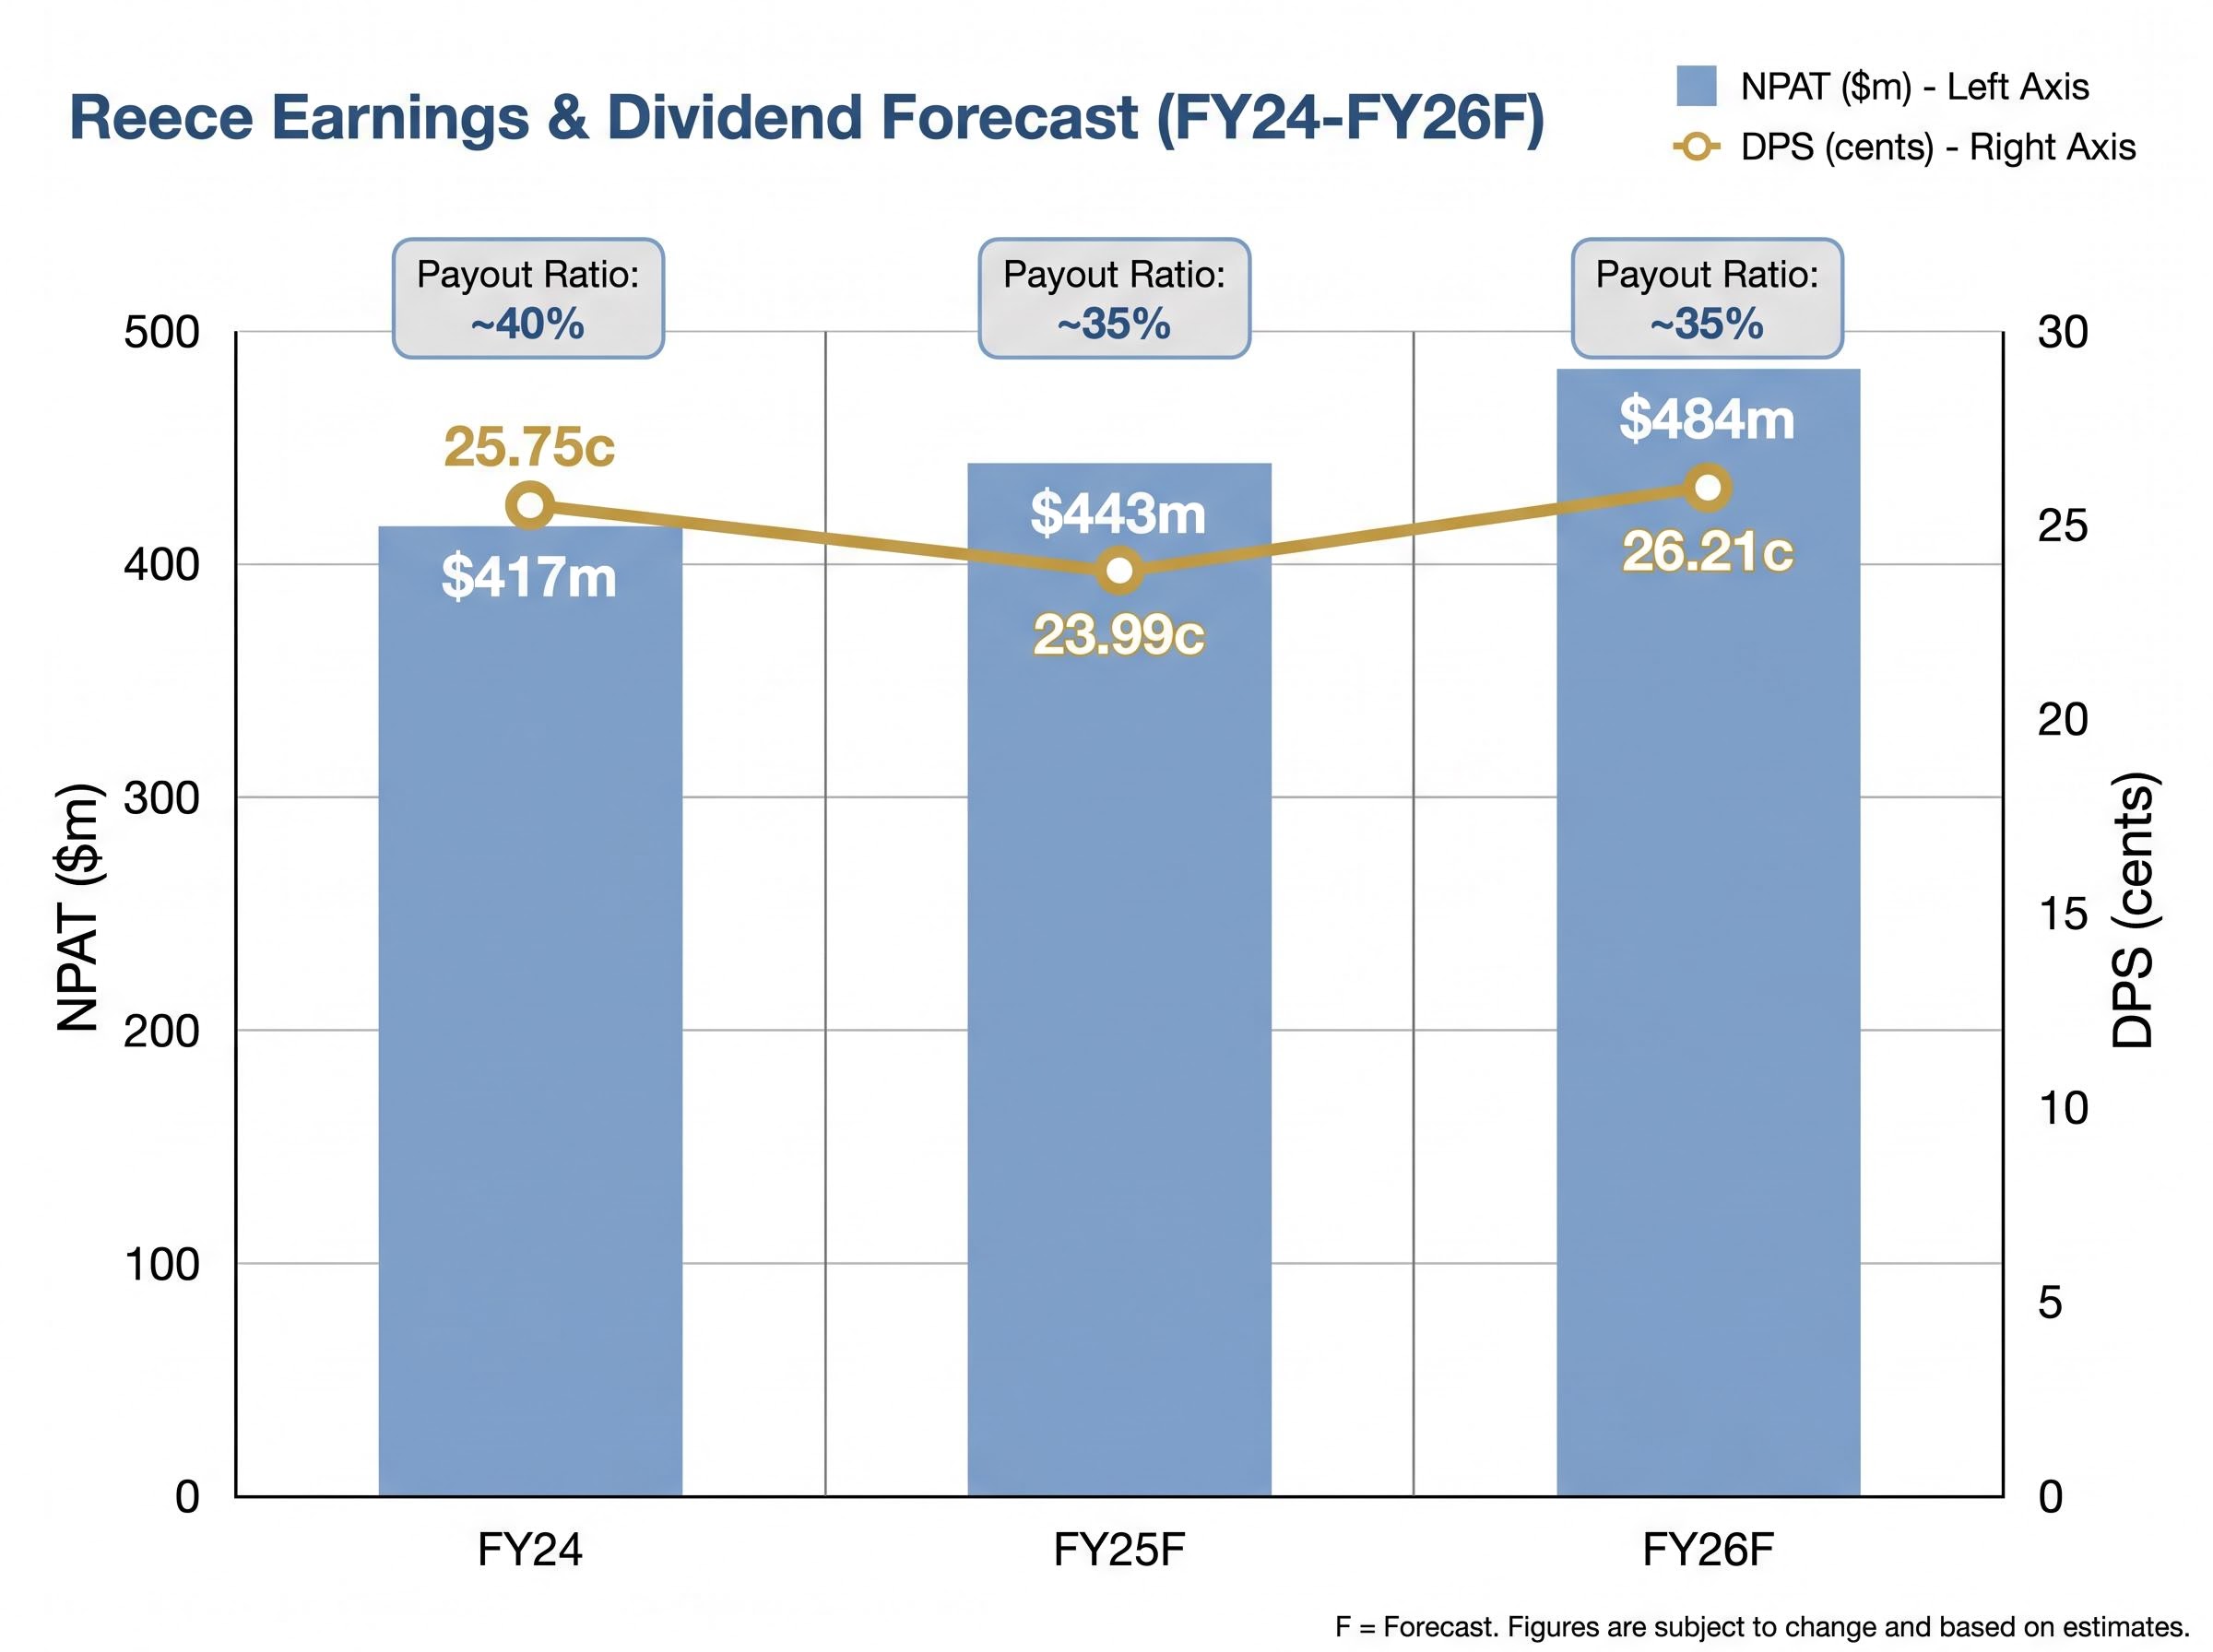
The recent dividend declarations tell a story of consistency rather than generosity. Reece declared an interim dividend for H1 FY26 of 11.86 cents per share, fully franked, paid on 22 October 2025. The final dividend for H2 FY26 came in at 5.44 cents per share, fully franked, paid on 1 April 2026.
That brings the FY26 total declared to approximately 17.3 cents per share. For comparison, the FY25 final dividend was 6.5 cents per share, fully franked, paid on 2 April 2025.
| Financial Year | DPS (cents) | Franking | NPAT (A$m) | Payout Ratio (approx.) |
|---|---|---|---|---|
| FY24 (actual) | 25.75 | 100% | $417 | ~40% |
| FY25F (consensus) | 23.99 | 100% | $443 | ~35% |
| FY26F (consensus) | 26.21 | 100% | $484 | ~35% |
Consensus forecasts from Intelligent Investor point to DPS of 26.21 cents for FY26F, suggesting a lift beyond the current TTM run-rate as earnings grow. The NPAT trajectory, from $417 million in FY24 to a forecast $483 million in FY26F, underpins that expectation.
“At 100% franking, Reece’s dividend carries a grossed-up yield meaningfully above the headline figure for investors in higher Australian tax brackets.”
A consistent payout at a sub-50% ratio against growing earnings is the clearest indicator of dividend sustainability. This is a business that could pay more but chooses not to, prioritising reinvestment over distributions.
Dividend sustainability is only as strong as the earnings producing it, and Reece’s earnings come from two distinct geographies with different risk profiles.
In Australia, the core business sits in trade plumbing and renovation, segments that are more defensive than greenfield construction. High interest rates and cost inflation have slowed new residential starts, but a structural housing undersupply and strong migration underpin the medium-term outlook. Renovation and maintenance activity, where Reece has deep exposure via trade plumbers, has held up better than new-build volumes.
The earnings trajectory reflects this resilience. FY26F consensus NPAT of $483.51 million represents approximately 9.3% growth versus FY25F, a steady mid-single-digit to low-double-digit progression that supports the dividend without straining it.
The risks are real, though not existential at this stage:
Post-COVID supply chain normalisation has been a positive for cash generation stability, with more normalised shipping costs and better product availability reducing the risk of working capital shocks.
Reece’s US operations, acquired through the MORSCO deal, continue to expand through branch openings, IT upgrades, and distribution improvements. Revenue growth in the US, albeit from a smaller base, helps diversify earnings away from purely Australian housing cycles.
The trade-off is straightforward. US growth strengthens dividend resilience over the medium term, but it absorbs capital expenditure that might otherwise increase the payout ratio. Management’s conservative capital allocation philosophy, progressive but flexible dividends with reinvestment prioritised, is consistent with a sub-50% payout and unlikely to change while the US expansion is in its build-out phase.
The comparative picture is where the income case for Reece encounters its most direct challenge. At approximately 1.86-1.98% fully franked, Reece’s yield grosses up to roughly 2.7-2.8% for an investor on the 30% marginal tax rate. That is a meaningful uplift, but it still falls short of what most income-focused alternatives deliver today.
| Asset | Approx. Yield | Franking | Yield Type |
|---|---|---|---|
| Reece (REH) | ~1.9% | 100% | Dividend (growth) |
| CBA (representative bank) | ~4-5% | Partial to full | Dividend (income) |
| Telstra | ~4% | Partial | Dividend (income) |
| Term Deposit | ~4-5% | N/A (unfranked) | Interest |
| ASX 200 Average | ~3.5-4% | Varies | Dividend (blended) |
“REH’s dividend yield sits below the bottom quartile of Australian dividend-paying stocks, even at its current elevated level relative to its own history.”
According to Simply Wall St data, the bottom 25% threshold for Australian dividend payers sits at approximately 2.9%. Reece falls below that line. For investors whose primary goal is maximising current income, REH is not the answer.
For investors building a portfolio of quality businesses that grow dividends over time, the calculus shifts. The elevated yield relative to Reece’s own history makes the current entry point more interesting than it has been in years, even if the absolute number remains modest.
Dividend-growth strategies that screen for payout sustainability and earnings quality have historically produced stronger long-run total returns than pure high-yield approaches, a pattern confirmed by OSAM Research and 2026 Morningstar commentary, which is precisely the framework that makes a sub-2% grower like Reece worth considering alongside higher-yielding but less resilient alternatives.
The yield elevation signals a de-rating driven by share price softness in a higher-rate environment, not a change in the underlying business quality or dividend policy. Earnings are growing. The payout ratio has headroom. Franking is full. The business is diversifying into the US.
At approximately 30x FY26F earnings, Reece is still priced for quality. That means limited margin of safety on a pure income basis, even after the modest de-rating. The yield of approximately 1.98% versus the 5-year average of 1.06% and 10-year average of 1.66% confirms the entry point is relatively attractive by Reece’s own standards, but those standards have always been low in absolute terms.
Consider REH if:
Look elsewhere if:
Management’s capital allocation philosophy, progressive but flexible dividends with reinvestment prioritised, means dividend cuts are unlikely absent a severe downturn. Large increases are equally unlikely while the US expansion absorbs capital.
The method demonstrated here is transferable. Compare current yield to the company’s own historical average. Assess the payout ratio against the earnings trajectory. Then measure the resulting yield against the alternatives available in the current rate environment. That three-step process applies to any ASX dividend stock, not just Reece.
Applying yield analysis alongside NTA and earnings trajectory is the standard extension of this framework for holding companies and diversified industrials, where dividend stability can persist even as underlying portfolio composition shifts in ways that headline yield figures alone cannot capture.
REH illustrates a distinction that income investors need to make before they screen: the difference between a high-quality dividend grower and a high-income stock. Knowing which type belongs in the portfolio is a prerequisite, not an afterthought.
One forward-looking variable is worth noting. If RBA rate cuts materialise through 2026-2027 and compress term deposit rates, the relative attractiveness of fully franked equity yields improves across the board.
UOB’s RBA rate cut forecasts projected two 25 basis point reductions in late 2025 and early 2026, targeting an official cash rate of 3.1%, a trajectory that, if sustained, would compress term deposit rates and gradually improve the relative competitiveness of fully franked equity yields like Reece’s.
“If RBA cuts compress term deposit rates through 2026-2027, REH’s grossed-up fully franked yield becomes considerably more competitive without the stock moving at all.”
For investors who want more rigorous valuation beyond yield comparison, DDM and DCF models are the recommended next step. Dividend yield analysis done well is a starting point, not an endpoint. The framework applied here to Reece should serve as a template for every ASX income decision that follows.
For investors wanting to move beyond yield comparison to a more rigorous intrinsic value estimate, our full explainer on the dividend discount model walks through the Gordon Growth Model formula with worked examples for ASX income stocks, covering how to set the growth rate, choose an appropriate discount rate, and interpret results alongside payout ratio data.
This article is for informational purposes only and should not be considered financial advice. Investors should conduct their own research and consult with financial professionals before making investment decisions. Past performance does not guarantee future results. Financial projections are subject to market conditions and various risk factors.
Reece Ltd's current dividend yield sits at approximately 1.86-1.98% fully franked, with some data sources placing it as high as 2.22% depending on measurement basis and timing.
The yield increase has been driven primarily by a share price decline of roughly 3.5% since early 2025, not a significant change in the dividend itself, which sits at approximately 18 cents per share on a trailing twelve-month basis.
Reece's current yield of approximately 1.98% is nearly double its 5-year historical average of 1.06% and sits above its 10-year historical average of approximately 1.66%, making the current entry point relatively attractive by the company's own historical standards.
Reece maintains a payout ratio of approximately 35-40% against growing earnings, with consensus NPAT forecast to rise from $417 million in FY24 to $484 million in FY26F, indicating meaningful headroom and a low risk of a dividend cut absent a severe downturn.
Reece's dividends are 100% franked, which grosses up the headline yield of approximately 1.86-1.98% to roughly 2.7-2.8% for an investor on the 30% marginal tax rate, providing a meaningful uplift over the raw figure.


