Australia’s headline inflation rate fell to 4.2% in the twelve months to April 2026, down from 4.6% in March, according to data released by the Australian Bureau of Statistics (ABS) on 27 May 2026. The number looks like progress. But beneath the surface, electricity prices surged 22.5% over the year as government rebate programmes expired, housing costs held near their highest levels in the current cycle, and the Reserve Bank of Australia’s (RBA) preferred measure of underlying inflation ticked higher, not lower. What follows breaks down where costs are genuinely easing, where they are worsening, and what the composition of this print signals for monetary policy and household budgets.
Headline inflation eases, but the improvement is narrower than it looks
The April 2026 monthly CPI indicator printed at 4.2% annually, a meaningful step down from the 4.6% recorded in March 2026. For context, the same measure sat at just 2.4% in April 2025, underscoring how sharply inflation has reaccelerated over the past twelve months.
- April 2026: 4.2% annual CPI
- March 2026: 4.6% annual CPI
- April 2025: 2.4% annual CPI
Seven of eleven CPI expenditure groups recorded slower annual growth in April. That sounds broad. In practice, the deceleration was heavily concentrated in Transport, a category driven by fuel prices that are volatile by nature and were directly affected by a government excise cut in April.
The monthly movement offers a more encouraging signal: the CPI rose 0.4% in April, a considerable slowing from the 1.1% monthly increase recorded in March. One month does not confirm a trend, but momentum is clearly softer than it was four weeks earlier.
According to Sue-Ellen Luke, ABS Head of Prices Statistics, the April data reflected a broad moderation across most spending categories, though housing and energy costs continued to exert upward pressure on the aggregate figure.
When big ASX news breaks, our subscribers know first
Why electricity bills are the real inflation story in April 2026
Housing remains the single largest contributor to Australia’s inflation reading. The housing group recorded annual growth of 6.3% in April 2026, easing only marginally from 6.5% in March. Three forces are converging within that figure: electricity prices, new dwelling construction costs, and rents.
| Category | April 2026 annual change | March 2026 annual change | Key driver |
|---|---|---|---|
| Housing (total group) | 6.3% | 6.5% | Electricity, new dwellings, rents |
| Electricity | +22.5% | N/A | Rebate programme expiry |
| New dwelling construction | +4.7% | N/A | Elevated freight and oil-linked logistics costs |
| Postal services | +12.4% | N/A | Freight cost passthrough |
Electricity is doing the heaviest lifting. The 22.5% annual rise in power prices is not the result of a supply shortage or a spike in wholesale energy markets. It is the direct consequence of a policy decision: the expiry of Commonwealth and state government electricity rebate programmes that had been actively suppressing household bills.
New dwelling construction costs, up 4.7% annually, reflect a different channel of energy-price pressure. Higher oil prices have pushed up freight and logistics costs, feeding into the cost of building materials and delivery. Postal services, up 12.4%, tell a similar story.
What the removal of electricity rebates means for consumers
Both Commonwealth and state-level electricity rebate programmes had been reducing household power bills through direct bill credits. With those programmes no longer in effect, consumers are now paying the full unsubsidised cost of electricity, and the CPI is capturing that shift.
This is a one-time level adjustment in prices rather than an ongoing inflationary spiral. However, the annual comparison effect will persist until the twelve-month measurement window moves past the period when rebates were still active. Until then, electricity will continue to inflate the housing component of CPI.
The Energy Bill Relief Fund expiry that drove electricity prices 25.4% higher in March set the base from which April’s 22.5% annual reading is measured, meaning the two months together capture the full removal of Commonwealth bill credits that households had relied on since mid-2023.
Fuel prices fell sharply in April, but the relief is partial and fragile
Transport was the expenditure group that gave headline inflation the most room to fall in April. The group’s annual rate dropped from 8.9% in March to 6.6% in April, driven almost entirely by a 7.0% monthly decline in automotive fuel prices.
That drop deserves context. It followed a 32.8% surge in fuel prices in March, triggered by the Middle East conflict’s disruption to global oil supply chains. The April reversal reflects two factors: a partial unwinding of the March spike and a halving of the fuel excise that took effect on 1 April 2026.
- February 2026 (pre-conflict baseline): fuel prices at their lowest recent level
- March 2026: automotive fuel surged 32.8% month-on-month as conflict disrupted supply
- April 2026: fuel fell 7.0% month-on-month, aided by the excise halving
- Current annual position: fuel prices remain 18.6% higher than a year ago, and 23.5% above the February 2026 pre-conflict baseline
Average regular unleaded (91 octane) fell from 228 cents per litre in March to 206 cents per litre in April. Diesel, however, moved in the opposite direction, rising from 256 cents per litre to 292 cents per litre despite the excise cut.
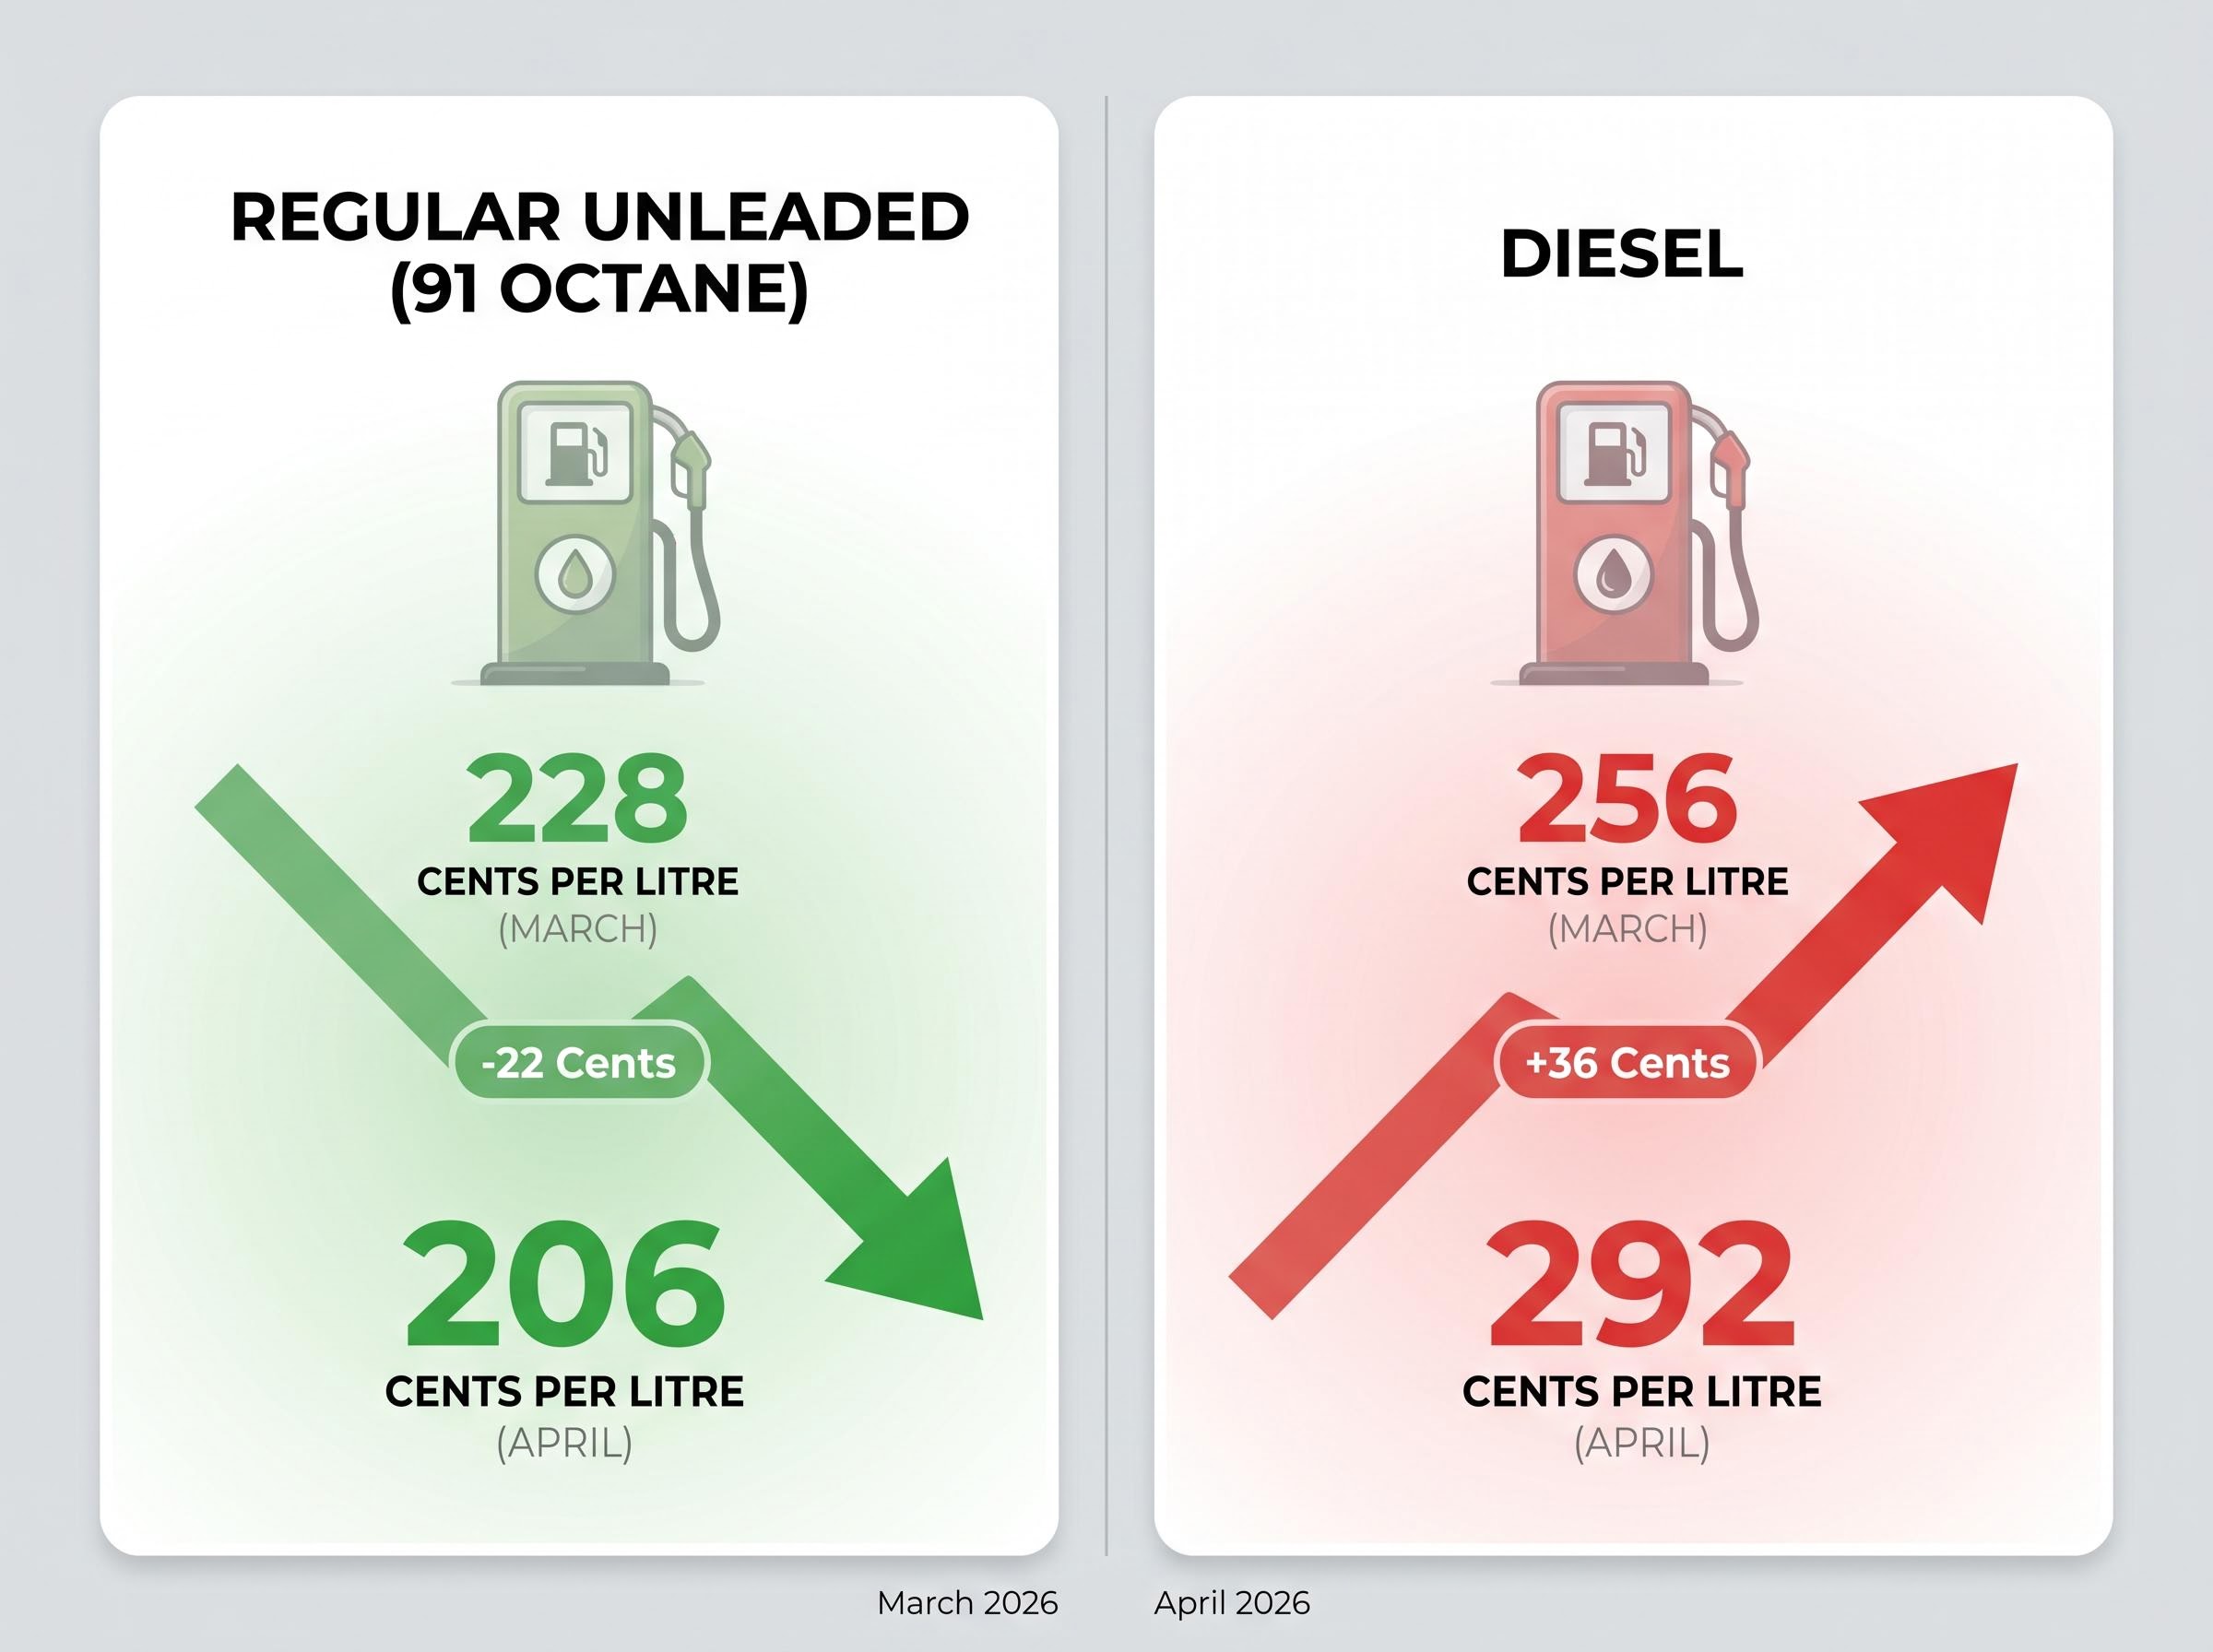
Diesel prices rose 14% month-on-month even with the excise halving in effect. For transport-dependent industries and regional households, the fuel relief captured in headline CPI does not reflect their actual cost experience.
Automotive fuel was excluded from the trimmed mean calculation in both March and April due to extreme price movements, a technical detail with direct implications for how the RBA reads this data.
What underlying inflation tells us that the headline number does not
Underlying inflation, measured by the trimmed mean, strips out the most volatile price movements in the CPI basket to reveal the structural trend beneath the noise. It is the measure the RBA treats as its primary inflation gauge when making interest rate decisions.
Trimmed mean inflation works by excluding the most extreme price movements in the CPI basket from both ends of the distribution, leaving only the central mass of price changes to reveal the structural trend; that technical construction is precisely why the RBA treats it as a more reliable policy signal than the volatile headline figure.
In April 2026, trimmed mean inflation rose to 3.4% annually, up from 3.3% in March. That is a tick higher, not lower, and it sits above the RBA’s 2-3% target band.
The RBA Statement on Monetary Policy published in May 2026 outlines the board’s trimmed mean forecasts and the conditions under which underlying inflation is expected to return to the 2-3% target range, providing the clearest official view of how the central bank is weighing the current data against its rate decision framework.
The trajectory over the past year sharpens the picture. The trimmed mean peaked at 6.8% in December 2022, then fell steadily to a low of 2.8% in June 2025, briefly touching the top of the target band. Since then, it has drifted back up: 2.8% to 3.4% over ten months.
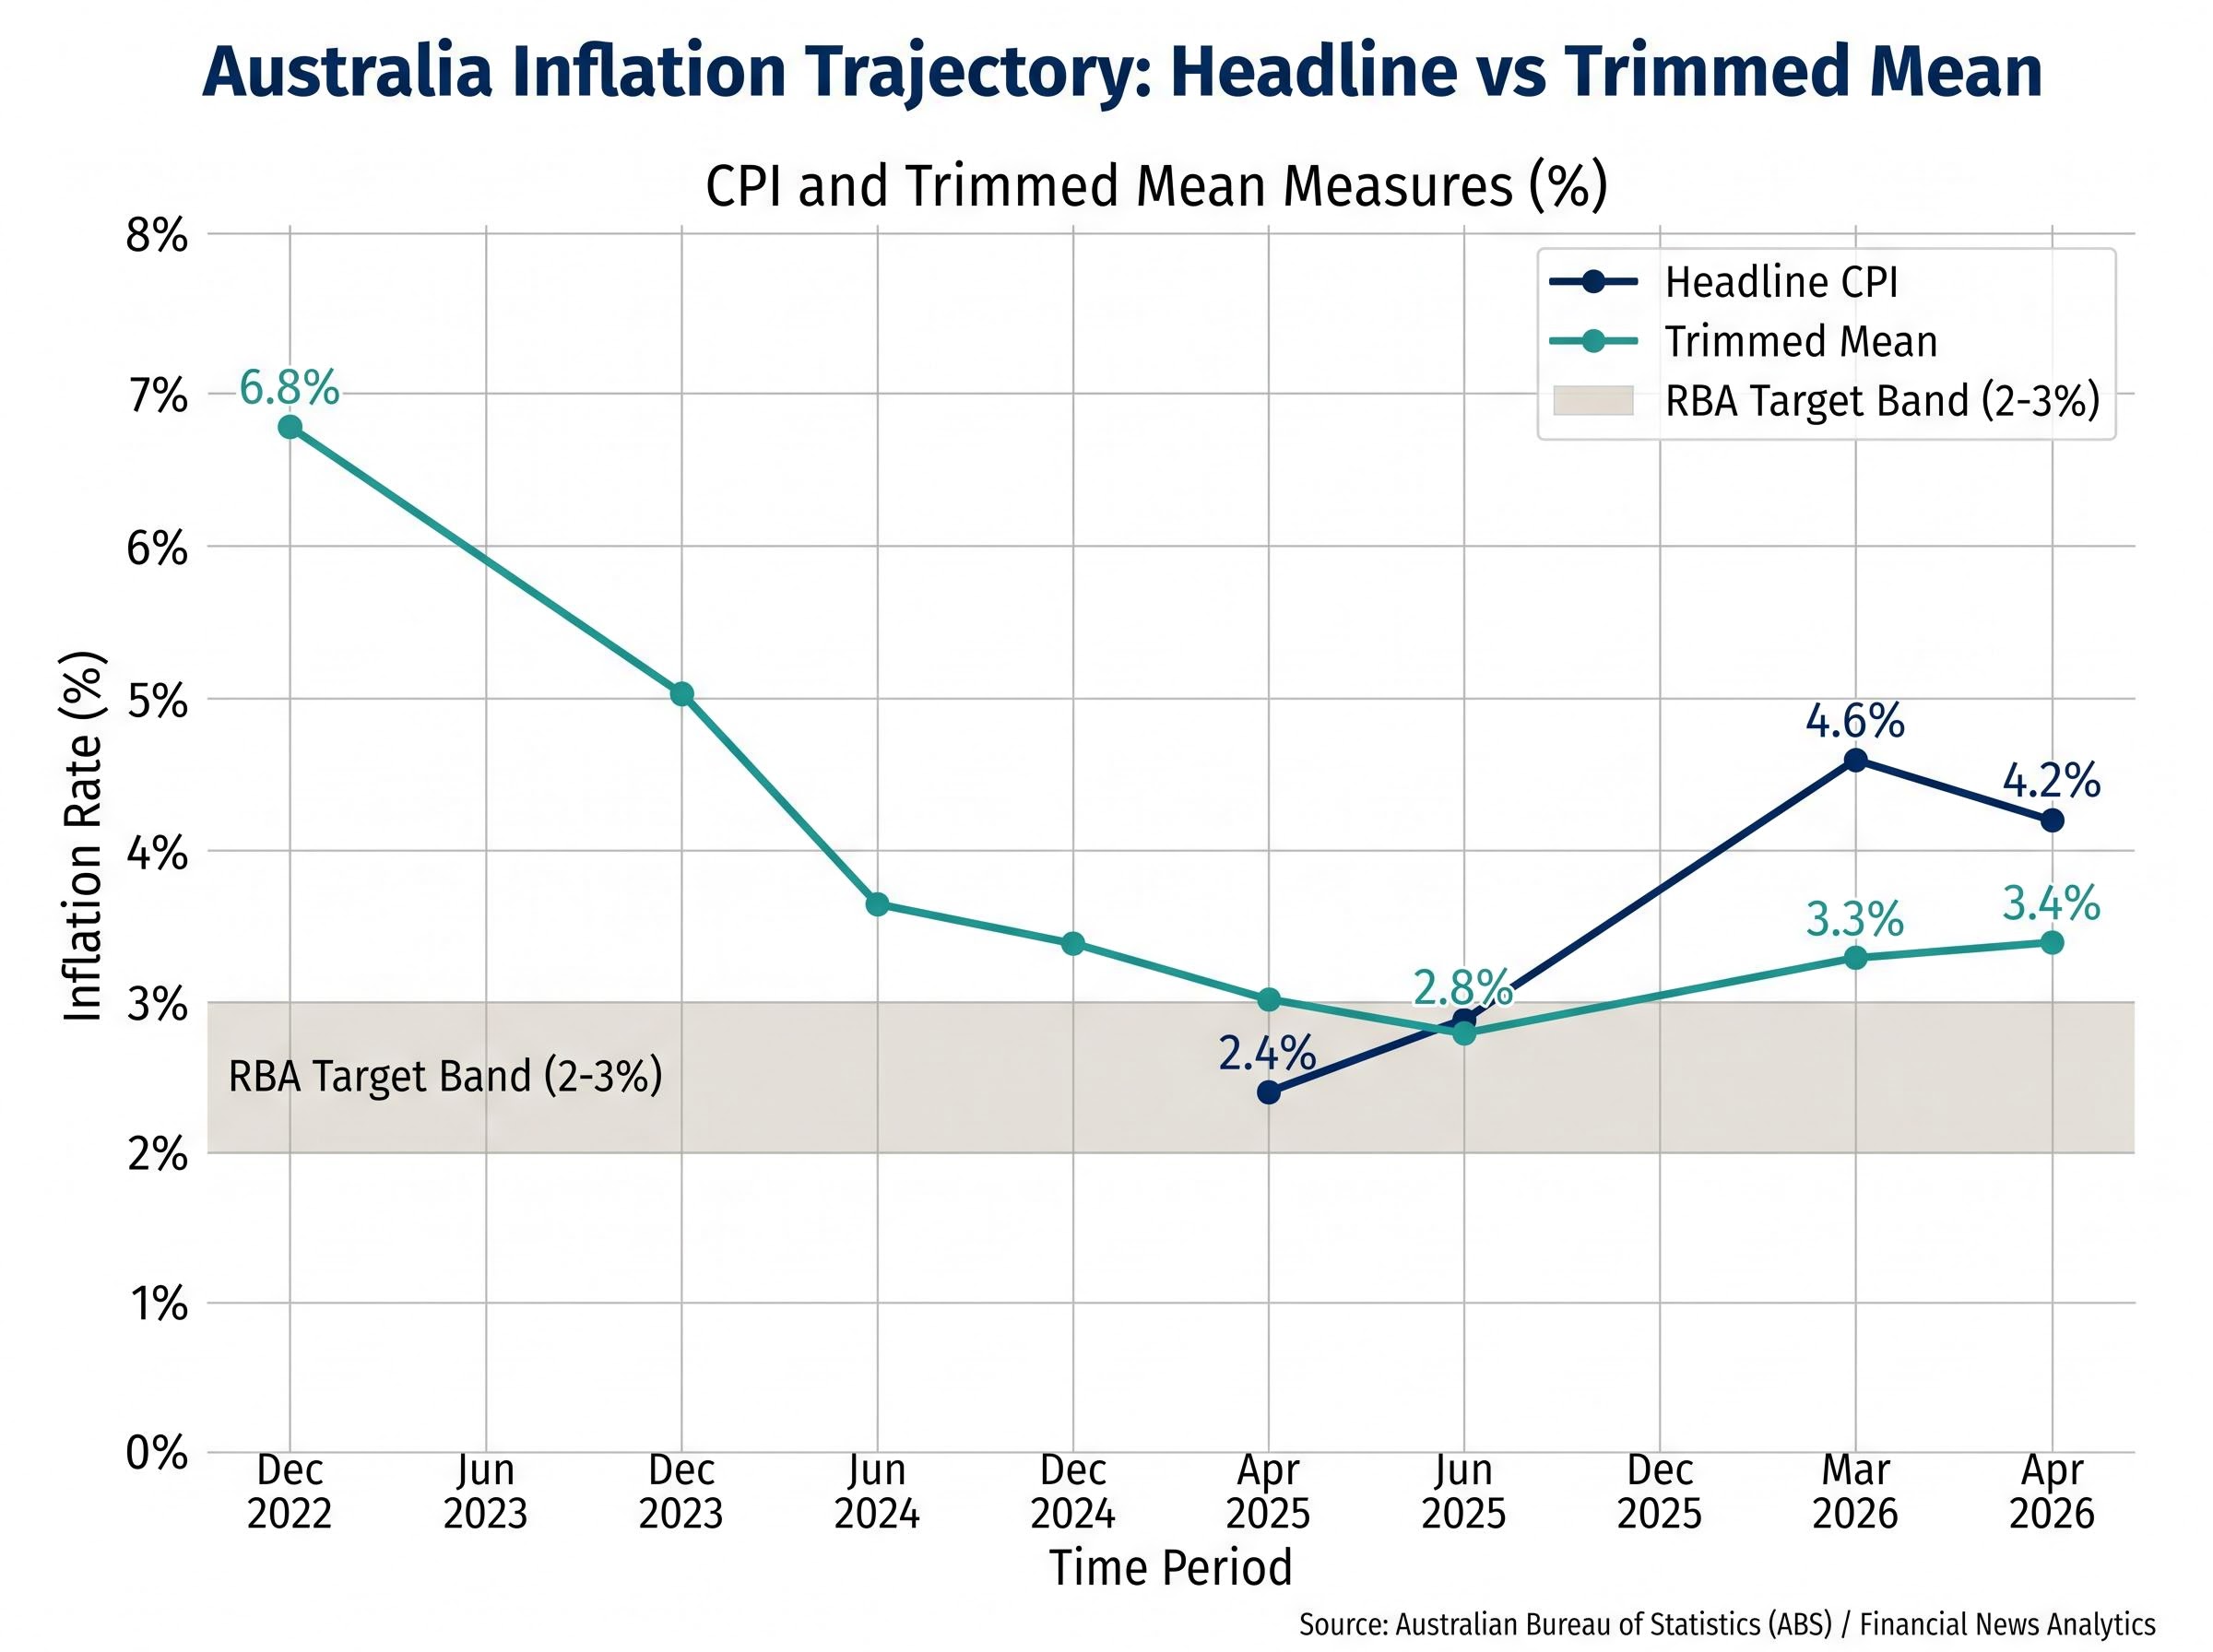
The trimmed mean has risen from 2.8% in June 2025 to 3.4% in April 2026. That gradual reacceleration complicates any argument that Australia’s disinflation trend remains intact.
What a rising trimmed mean means for RBA rate expectations
The RBA uses the trimmed mean, not headline CPI, as its primary inflation gauge. A reading of 3.4%, sitting above the top of the 2-3% target band, leaves limited room for the board to justify near-term rate cuts on inflation grounds alone.
The tension is visible. Headline CPI is falling, which may generate public and political pressure for rate relief. But the underlying measure, the one the RBA’s framework is built around, tells a more cautious story. Until trimmed mean inflation moves convincingly back toward the target band, the data supports a patient stance from the board.
For investors wanting to understand how financial markets and major bank economists positioned ahead of the policy response to this inflation cycle, our full explainer on the May 2026 RBA rate decision preview covers the 76% market probability of a hike, the federal budget policy conflict, and what Governor Bullock’s press conference signalled about the board’s reaction function.
How the other spending categories moved in April 2026
Beyond housing and transport, the April data showed a broad, if modest, softening across most expenditure groups. Health was the sole category to accelerate meaningfully.
| Expenditure Group | April 2026 annual change | March 2026 annual change |
|---|---|---|
| Clothing and footwear | 5.9% | 7.1% |
| Education | 4.8% | 4.8% |
| Alcohol and tobacco | 4.3% | 4.4% |
| Health | 4.0% | 3.0% |
| Insurance and financial services | 3.0% | 2.8% |
| Food and non-alcoholic beverages | 2.8% | 3.1% |
| Recreation and culture | 2.5% | 2.8% |
| Communications | 1.5% | 1.4% |
| Furnishings, household equipment and services | 1.2% | 1.4% |
- Health was the only group to accelerate meaningfully, jumping from 3.0% to 4.0%, making it the standout mover in April.
- Clothing and footwear recorded the largest deceleration of any group, falling from 7.1% to 5.9%.
- Education held unchanged at 4.8%, reflecting structurally persistent annual fee increases that tend to reset at the start of the academic year.
Insurance and financial services edged up to 3.0%, a category with direct relevance for anyone managing personal finance or investment portfolios. Food and non-alcoholic beverages eased to 2.8%, offering some relief to household grocery budgets.
The broad pattern is one of gradual softening across demand-driven categories, even as supply-side and policy-linked pressures in housing and energy remain elevated.
The inflation picture is improving at the surface, but the foundations remain under pressure
The April CPI print offers a headline number moving in the right direction. But the composition of that improvement matters more than its magnitude.
Headline CPI at 4.2% is still well above the RBA’s 2-3% target band. Trimmed mean inflation at 3.4% is moving the wrong way. Housing at 6.3%, powered by a 22.5% electricity price surge rooted in a policy decision already made, is unlikely to normalise quickly. The electricity base effect will weigh on annual comparisons until the rebate-removal anniversary passes through the twelve-month measurement window.
The central tension in the April print is clear: headline inflation is falling while underlying inflation is rising, and the largest single cost driver, housing, reflects the withdrawal of government support rather than a supply or demand shock.
For RBA watchers and investors assessing rate expectations, three forward-looking signals warrant close attention:
- Whether the trimmed mean continues to edge higher in the months ahead, confirming a stalling of the disinflation trend
- How long electricity base effects persist in the annual comparison and whether state or federal governments intervene with replacement programmes
- Whether the RBA adjusts its forward guidance in response to the widening divergence between headline and underlying inflation
Progress is real, but conditional. The forces keeping inflation above target, housing costs, energy policy effects, and a reaccelerating trimmed mean, are not yet resolved.
For readers wanting to follow the policy response that followed April’s data, our dedicated guide to the May 2026 RBA rate decision outcome covers the 8-1 board vote, the forward guidance language that preserved optionality on a fourth hike, and what the decision means for variable-rate mortgage holders and term deposit savers in the current cycle.
This article is for informational purposes only and should not be considered financial advice. Investors should conduct their own research and consult with financial professionals before making investment decisions.