The Bureau of Economic Analysis released July’s Personal Consumption Expenditures (PCE) inflation data on schedule, and the headline number told an easy story: prices are cooling. The harder question, the one that actually shapes what the Federal Reserve does next, is whether the gauges policymakers trust most are confirming that progress or quietly contradicting it.
July’s report lands at a moment when Fed officials have been explicit about what they need before cutting rates. A single favourable print is not enough. They want broad-based, durable evidence of disinflation across multiple measures, not just a headline that cooperates for one month. With the reference month now behind us, the shift from forecasting to interpreting is where the real signal sits.
Here is what the July numbers actually showed, which of the Fed’s preferred inflation gauges are closest to the 2% target, and what specific readings in the next two to three PCE releases will tell you whether rate cuts are approaching or still on hold.
What July’s PCE numbers actually showed
Headline PCE rose +0.1% month over month in July, reversing June’s -0.1% dip. On a year-over-year basis, it eased to 3.6%, down from 3.7% the prior month. Direction: right. Pace: modest.
Core PCE, which excludes food and energy to capture underlying price trends, posted a monthly gain of +0.2%, stepping up from +0.1% the previous month. On an annual basis, the reading held firm at 3.3% for the second consecutive month, leaving the year-over-year pace exactly where it was. That unchanged annual reading is the detail that matters most for policy, because it tells you the underlying trend is drifting lower rather than accelerating downward.
Core PCE year over year: 3.3%, unchanged from the prior month. The Fed is watching disinflation that is drifting, not breaking lower, and that distinction separates a “patient hold” from a “cutting cycle begins.”
Adjusted for inflation, consumer outlays were unchanged on a monthly basis in July, pulling back sharply from the +0.4% advance recorded in June. Households pulled back. That completes the demand-side picture: spending momentum is fading, which should ease price pressure over time, but the effect has not yet shown up in the core rate.
July’s PCE figures were consistent with the weaker CPI and retail sales readings that had already been published for the month, adding further weight to an established trend rather than introducing a new one.
The May PCE release told a structurally similar story: core PCE held at 3.4% year-over-year, precisely matching consensus, and the in-line print removed immediate hawkish risk while providing no basis for rate cuts, locking in the same data-dependent holding pattern that July’s figures now extend.
| Indicator | July figure | Prior month | Policy significance |
|---|---|---|---|
| Headline PCE (MoM) | +0.1% | -0.1% | Overall price direction |
| Headline PCE (YoY) | 3.6% | 3.7% | Year-over-year cooling pace |
| Core PCE (MoM) | +0.2% | +0.1% | Underlying inflation momentum |
| Core PCE (YoY) | 3.3% | 3.3% | Key unchanged reading |
| Real personal spending (MoM) | 0.0% | +0.4% | Demand-side pressure easing |
The gap between headline improvement and a core rate that refuses to break lower is the gap the Fed is actually watching. Understanding it is the difference between reading a number and understanding what policymakers learn from it.
When big ASX news breaks, our subscribers know first
Why the Fed looks beyond the headline to trimmed mean and median PCE
Headline and core PCE are the figures that make the news. But the Fed’s internal confidence test relies on two additional gauges that most coverage ignores: the Dallas Fed trimmed mean PCE and the Cleveland Fed median PCE. Both are published as supplementary research series by their respective regional Federal Reserve Banks, released around the New York market close on the same day as the headline PCE report.
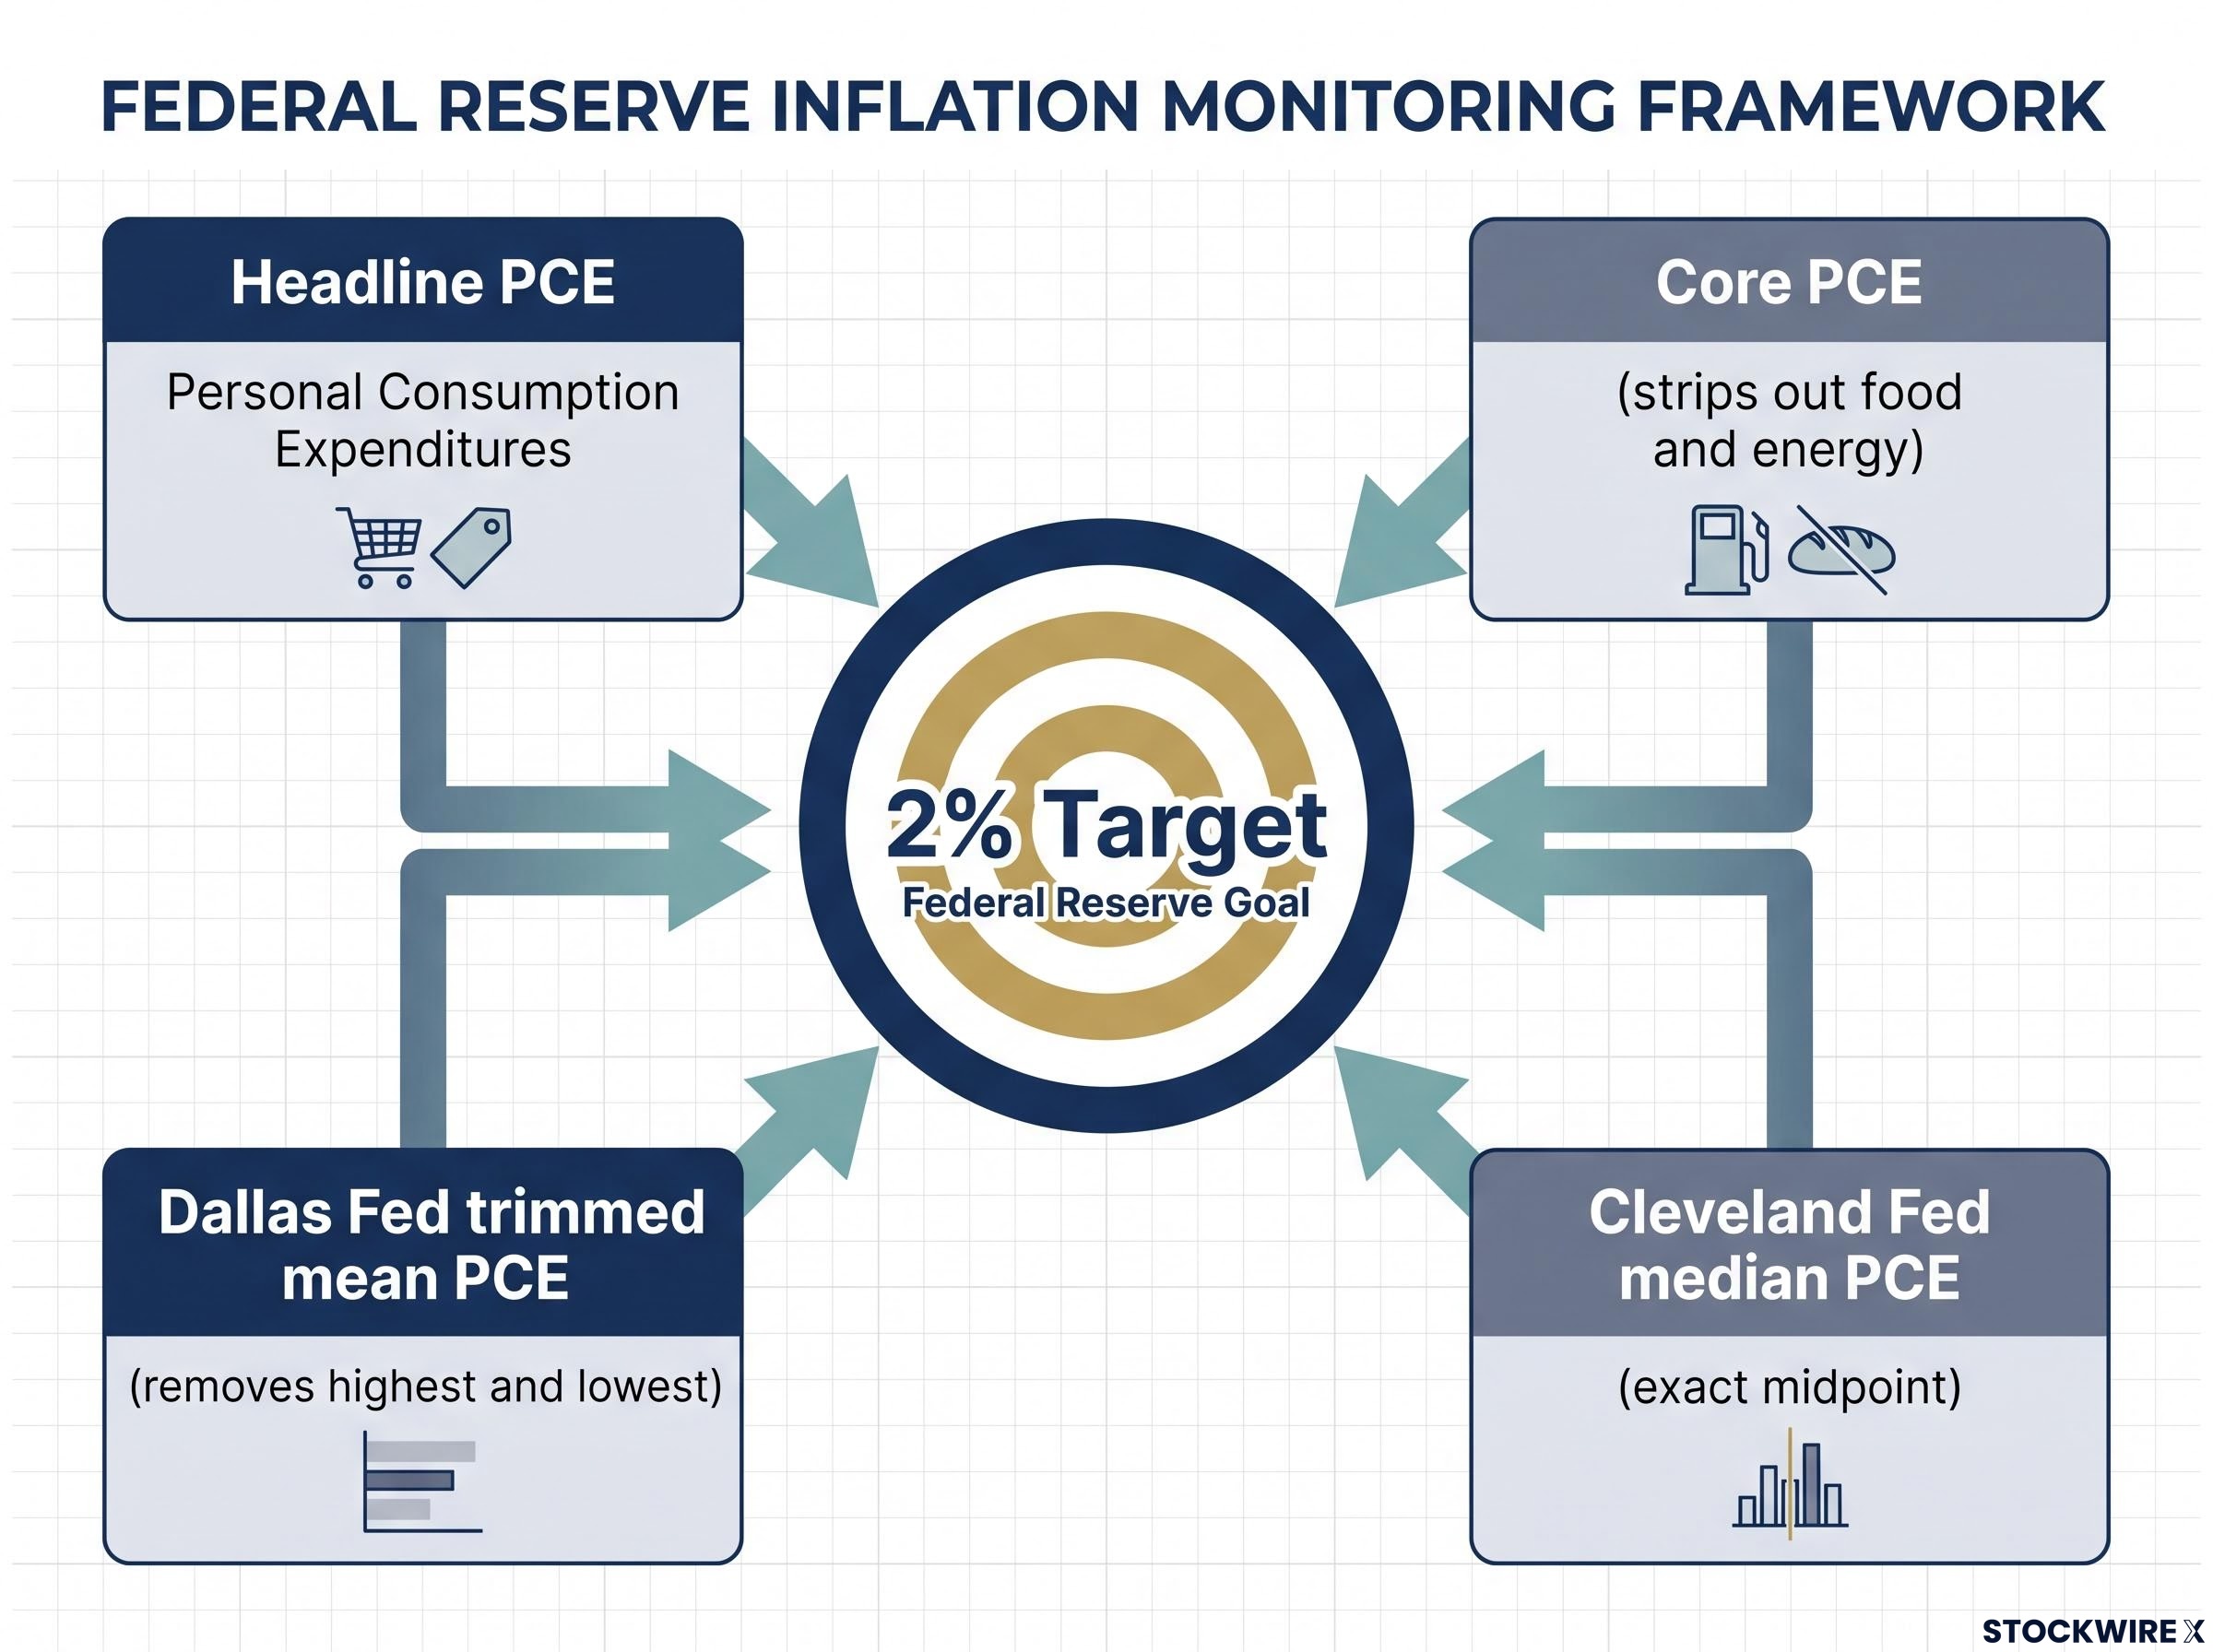
The four gauges the Fed monitors as a convergence framework:
- Headline PCE: The broadest measure of consumer price changes, covering the full basket of goods and services.
- Core PCE: Strips out food and energy to isolate underlying demand-driven inflation.
- Dallas Fed trimmed mean PCE: Removes the highest and lowest monthly price movers and averages what remains, filtering out category-level volatility.
- Cleveland Fed median PCE: Identifies the single component sitting at the exact midpoint of the ranked price distribution, the most extreme outlier-proof measure available.
The BEA’s core PCE methodology weights expenditures using chain-type indexes that update basket composition annually, which is why core PCE tends to show lower shelter inflation than the CPI equivalent and is the measure the Fed has historically found most relevant for assessing underlying price trends.
Elias Haddad of BBH has specifically flagged these two alternative measures as the cleaner signal for underlying price trends, giving them weight well beyond academic interest.
Kevin Warsh has publicly indicated a preference for trimmed mean PCE as his primary inflation scorecard, a signal with direct implications for how markets should interpret each regional Fed gauge relative to the headline number when assessing the pace of any eventual pivot.
Dallas Fed trimmed mean PCE: cutting out the noise at the extremes
The trimming mechanism works by removing the PCE components with the largest and smallest monthly price changes, then averaging everything that remains. If used-car prices spike 3% in a single month or energy costs plunge, those readings get excluded. What is left is a view of inflation that reflects the broad middle of the price distribution rather than the tails.
On a 12-month basis, the Dallas Fed trimmed mean stepped down from approximately 3% in early 2024 toward the mid-2% range by mid-2024, with the June reading (the most recent before July’s report) near 2%. That trajectory matters because it tells you the middle of the basket is cooling, not just the volatile edges.
Cleveland Fed median PCE: what the middle of the distribution reveals
The Cleveland Fed takes a different approach. It ranks every PCE component by its monthly price change, from lowest to highest, and identifies the single item sitting at the midpoint. One number. No averaging. No trimming.
This makes the median PCE even more insulated from extremes than the trimmed mean. A handful of categories surging or collapsing cannot shift the median unless the movement is so broad that it changes what sits in the middle. As of June, the Cleveland Fed median PCE was trending toward the 2% area, reinforcing the same signal the trimmed mean was sending.
When both of these measures approach 2% alongside core PCE, it tells you disinflation is broad across the price distribution, not a story being told by one or two categories doing the heavy lifting.
What convergence across all four gauges would mean for rate decisions
The Fed’s “greater confidence” language is not a feeling. It is a convergence test. All four inflation gauges need to move toward 2% in a durable, broad-based way simultaneously, not in rotation where one improves while another stalls.
The Fed’s longer-run target: 2% PCE inflation (symmetric). Every gauge is measured against this single benchmark. Until they all approach it together, restrictive rates stay in place.
Consider why a single favourable headline is not enough. If headline PCE drops because crude oil falls 15% in a month, the trimmed mean and median will strip that energy effect out. If those alternative measures remain elevated while the headline improves, the Fed reads the progress as fragile, driven by a temporary commodity move rather than genuine underlying moderation.
The Fed operates a formal look-through framework for supply-side price shocks, meaning a temporary commodity move that suppresses headline PCE without moving the trimmed mean or median carries little policy weight and does not bring a rate cut closer on its own.
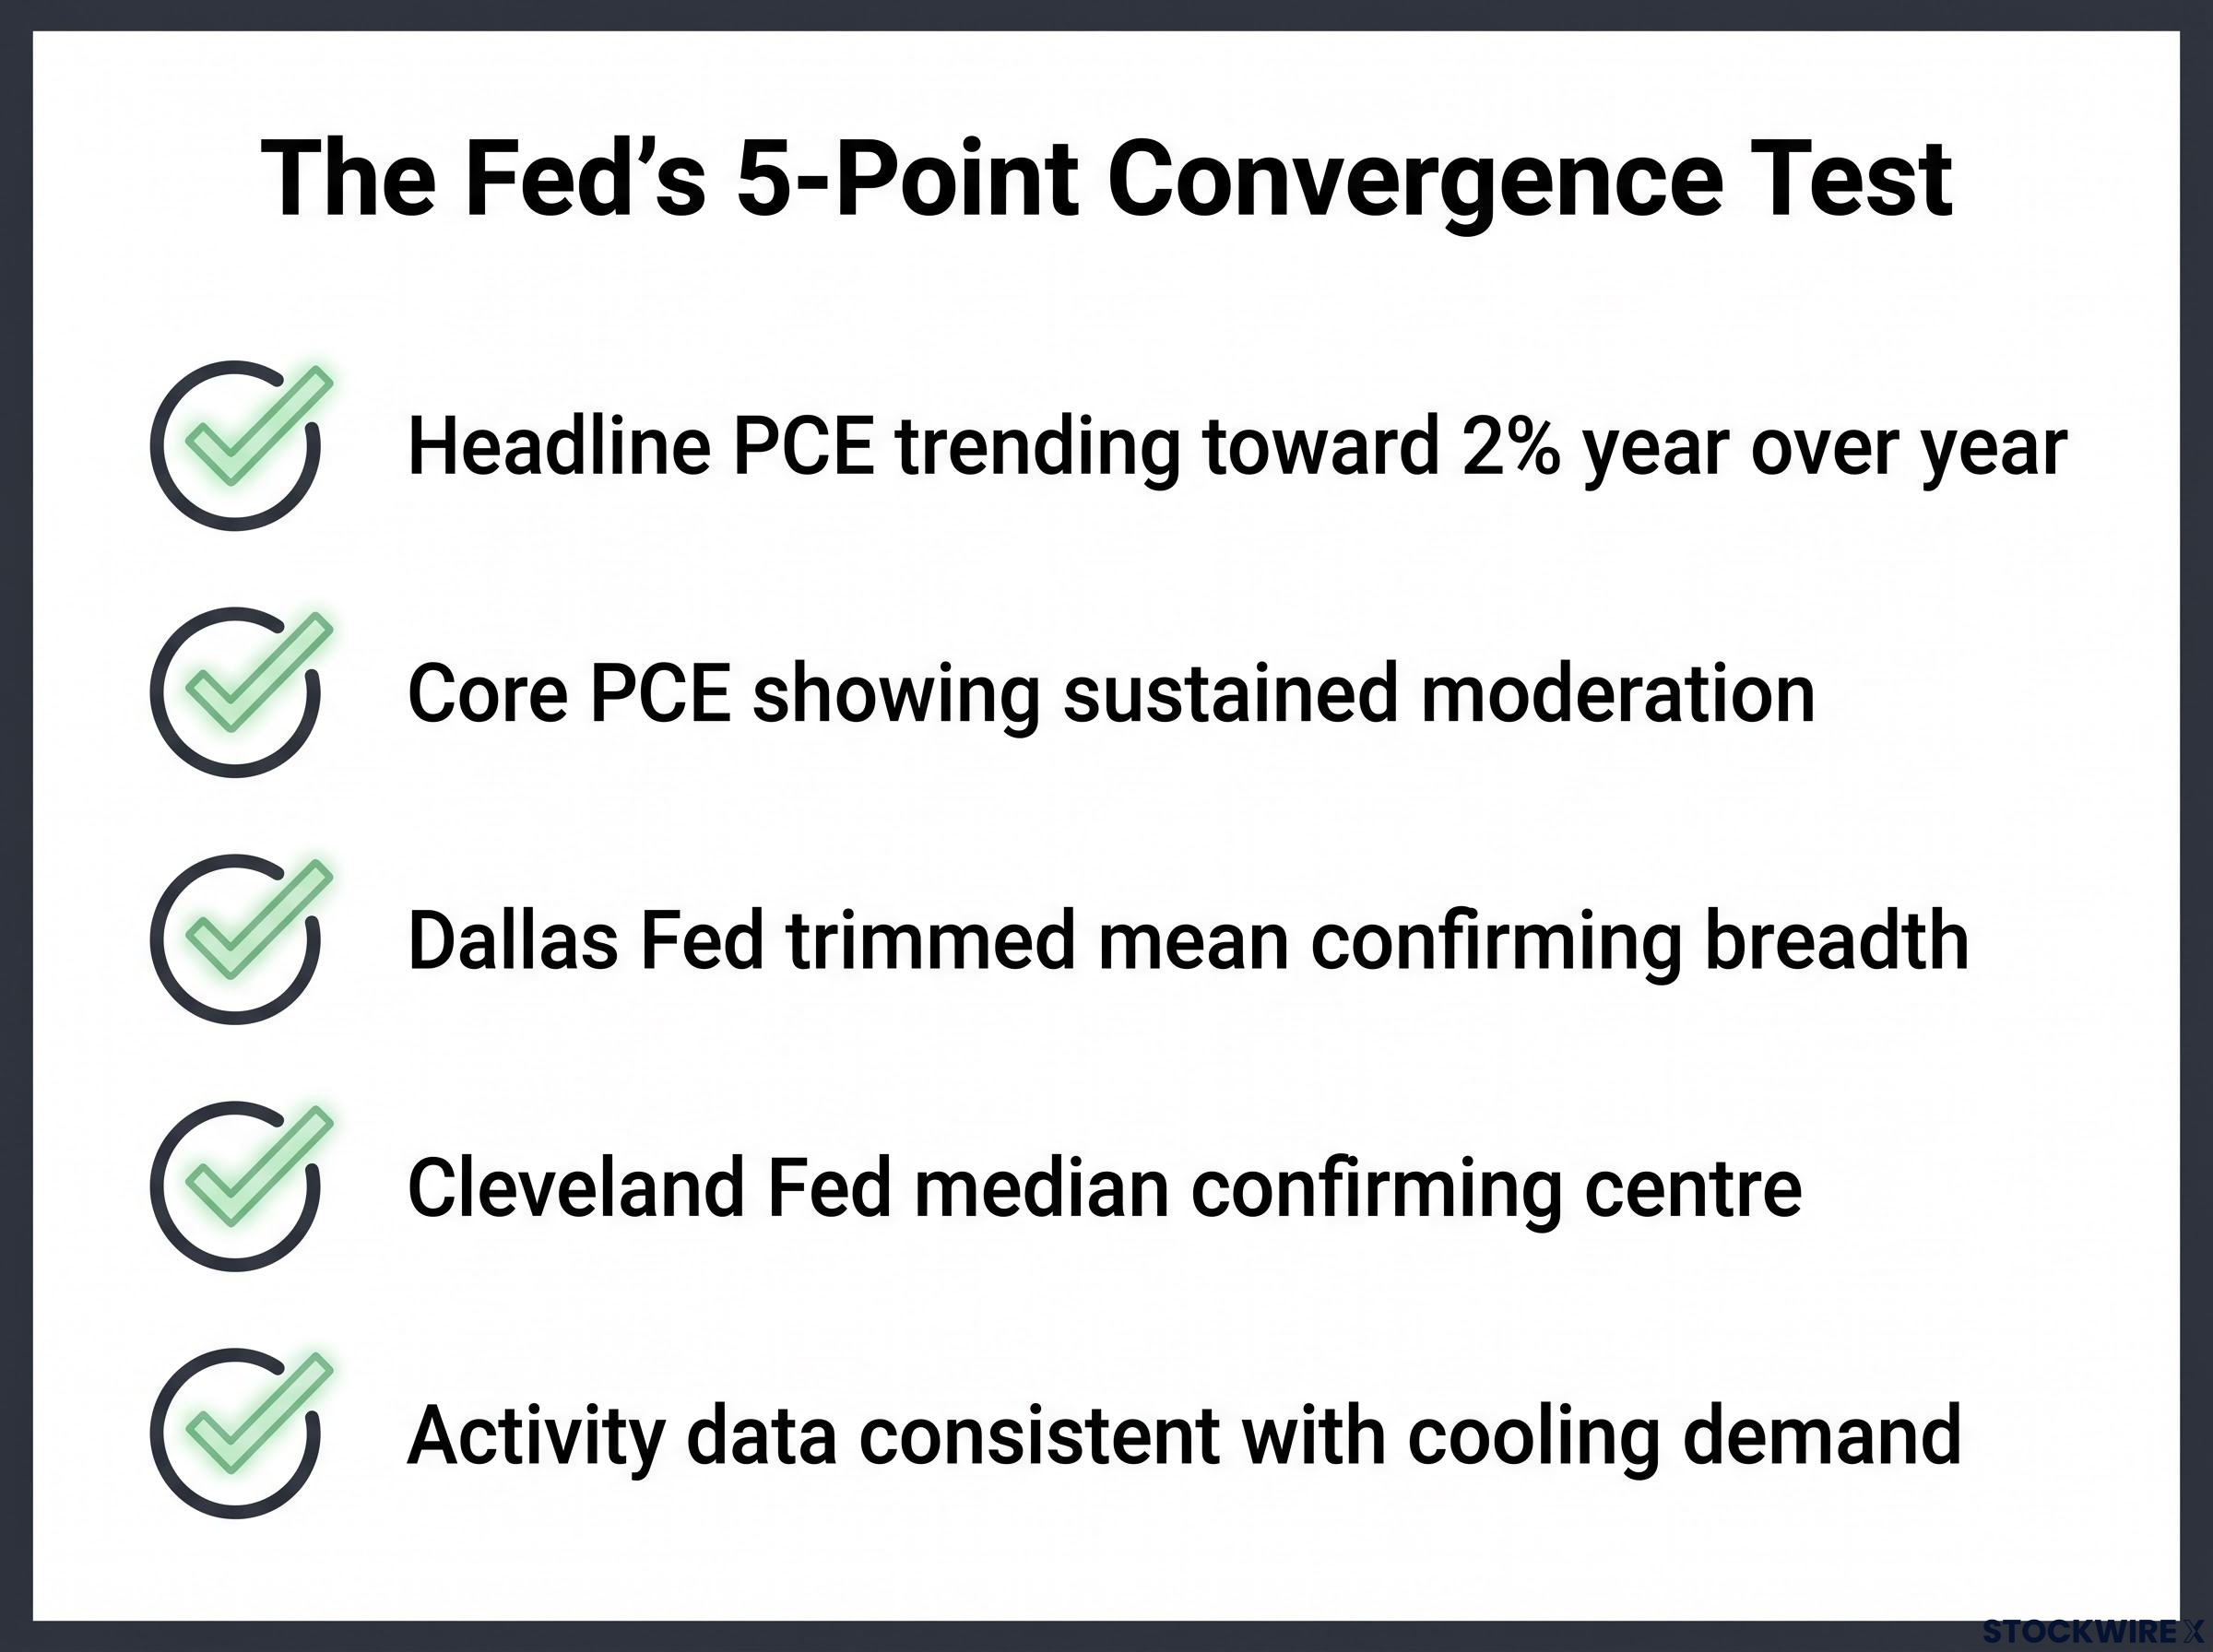
The convergence test the committee applies before shifting to easing:
- Headline PCE trending toward 2% year over year
- Core PCE showing sustained moderation, not just a one-month dip
- Dallas Fed trimmed mean confirming breadth of disinflation across the basket
- Cleveland Fed median confirming the centre of the distribution is easing
- Activity data (spending and labour markets) consistent with cooling demand-side pressure
July’s constellation of data supports a patient hold. Real personal spending at 0.0% confirms that demand-side price pressure is cooling, a necessary but not sufficient condition for cutting. The headline eased. Core held steady. The alternative gauges were already near 2% as of June. The pattern is consistent with soft CPI and retail sales data for the same month.
For a reader holding rate-sensitive assets or planning rate-dependent decisions, the July data tells you the Fed’s next move is a cut rather than a hike. But the timing depends on whether the next two to three PCE releases show the alternative gauges closing the remaining gap to 2% on a sustained basis.
This article is for informational purposes only and should not be considered financial advice. Investors should conduct their own research and consult with financial professionals before making investment decisions.
What to watch in the next PCE releases before calling the turn
The July print is behind you. The question now is what specific readings in August and September’s PCE reports will tell you whether the disinflation story is confirmed or reversed.
Elias Haddad of BBH has specifically recommended monitoring the Dallas Fed trimmed mean and Cleveland Fed median as the cleaner underlying trend indicators. Both are published around the New York market close on PCE release days, with August’s PCE data due in late September 2026.
Three items to track in upcoming releases:
- Dallas Fed trimmed mean trajectory: Does it hold near 2% or drift back toward mid-2%? A sustained move at or below 2% would confirm breadth of disinflation.
- Cleveland Fed median trajectory: The same question. If the median stays near 2% across multiple months, the centre of the price distribution is genuinely moderating.
- Core PCE year over year: If it breaks below 3.3% on a sustained basis, that is the signal the Fed’s internal confidence threshold may be approaching.
One cross-check matters alongside these gauges. If real personal spending rebounds to +0.4% or above in coming months, that demand-side pressure complicates the disinflation narrative even if the inflation gauges improve.
The gap between where these gauges sit today and a clear, sustained run at 2% is the practical distance between “rates on hold” and “the Fed begins cutting.” Watching that gap close, or not, is how you track this story going forward.
These statements regarding the Fed’s potential rate path are forward-looking and subject to change based on incoming economic data and policy developments.
When all the gauges agree, the Fed will move
July’s PCE report is one data point in a multi-gauge convergence test. Its significance is that it keeps the test alive rather than deciding it. Headline inflation eased. Core held steady. The alternative gauges were already approaching 2% heading into the print. Nothing broke the pattern. Nothing resolved it either.
The Dallas Fed trimmed mean and Cleveland Fed median are the measures that will confirm or undercut the disinflation story in the months ahead. They are the gauges that filter out the noise headline numbers cannot avoid, and they are the ones the Fed’s framework relies on most when assessing whether progress is broad enough to act on.
The policy posture is clear: the Fed holds, watches, and will move when the evidence is broad and durable. Not when a single favourable print appears. The question is no longer whether the committee will cut. It is what breadth of evidence across these specific gauges will give policymakers the “greater confidence” they have set as their threshold. July moved that question closer to an answer. It did not resolve it.
The PCE inflation and labour market combination has created a dual-mandate conflict the Fed’s interest rate tools are not designed to resolve simultaneously, with PCE running above 3% while unemployment has been rising, placing the committee in a position where holding restrictive rates risks one side of the mandate even as it addresses the other.