
The dollar just staged one of its most decisive moves of the year, and the Federal Reserve had nothing to do with it. On 23 September 2026, the US Dollar Index pushed above 101 for the first time in eight weeks. There was no rate hike, no hawkish speech, no surprise policy signal.
Instead, two entirely separate events landed on the same day. A flash Purchasing Managers’ Index (PMI) print showed the US private sector expanding at its fastest pace in over five years, and crude oil rebounded sharply after a week of declines. Together, they reignited the higher-for-longer narrative that had been fading through much of 2026.
The response was immediate and broad. The Australian Dollar and British Pound absorbed the sharpest losses on the week, down 1.17% and 1.13% respectively against the greenback, with the move rippling across every major currency pair.
If you hold international assets, run carry positions, or carry any exposure sensitive to dollar moves, the mechanism behind this session matters more than the headline number. What follows here is a read on exactly what drove the dollar higher, why the move may prove durable, and the specific signals that would tell you it is turning.
Two catalysts, one direction: what drove the dollar above 101
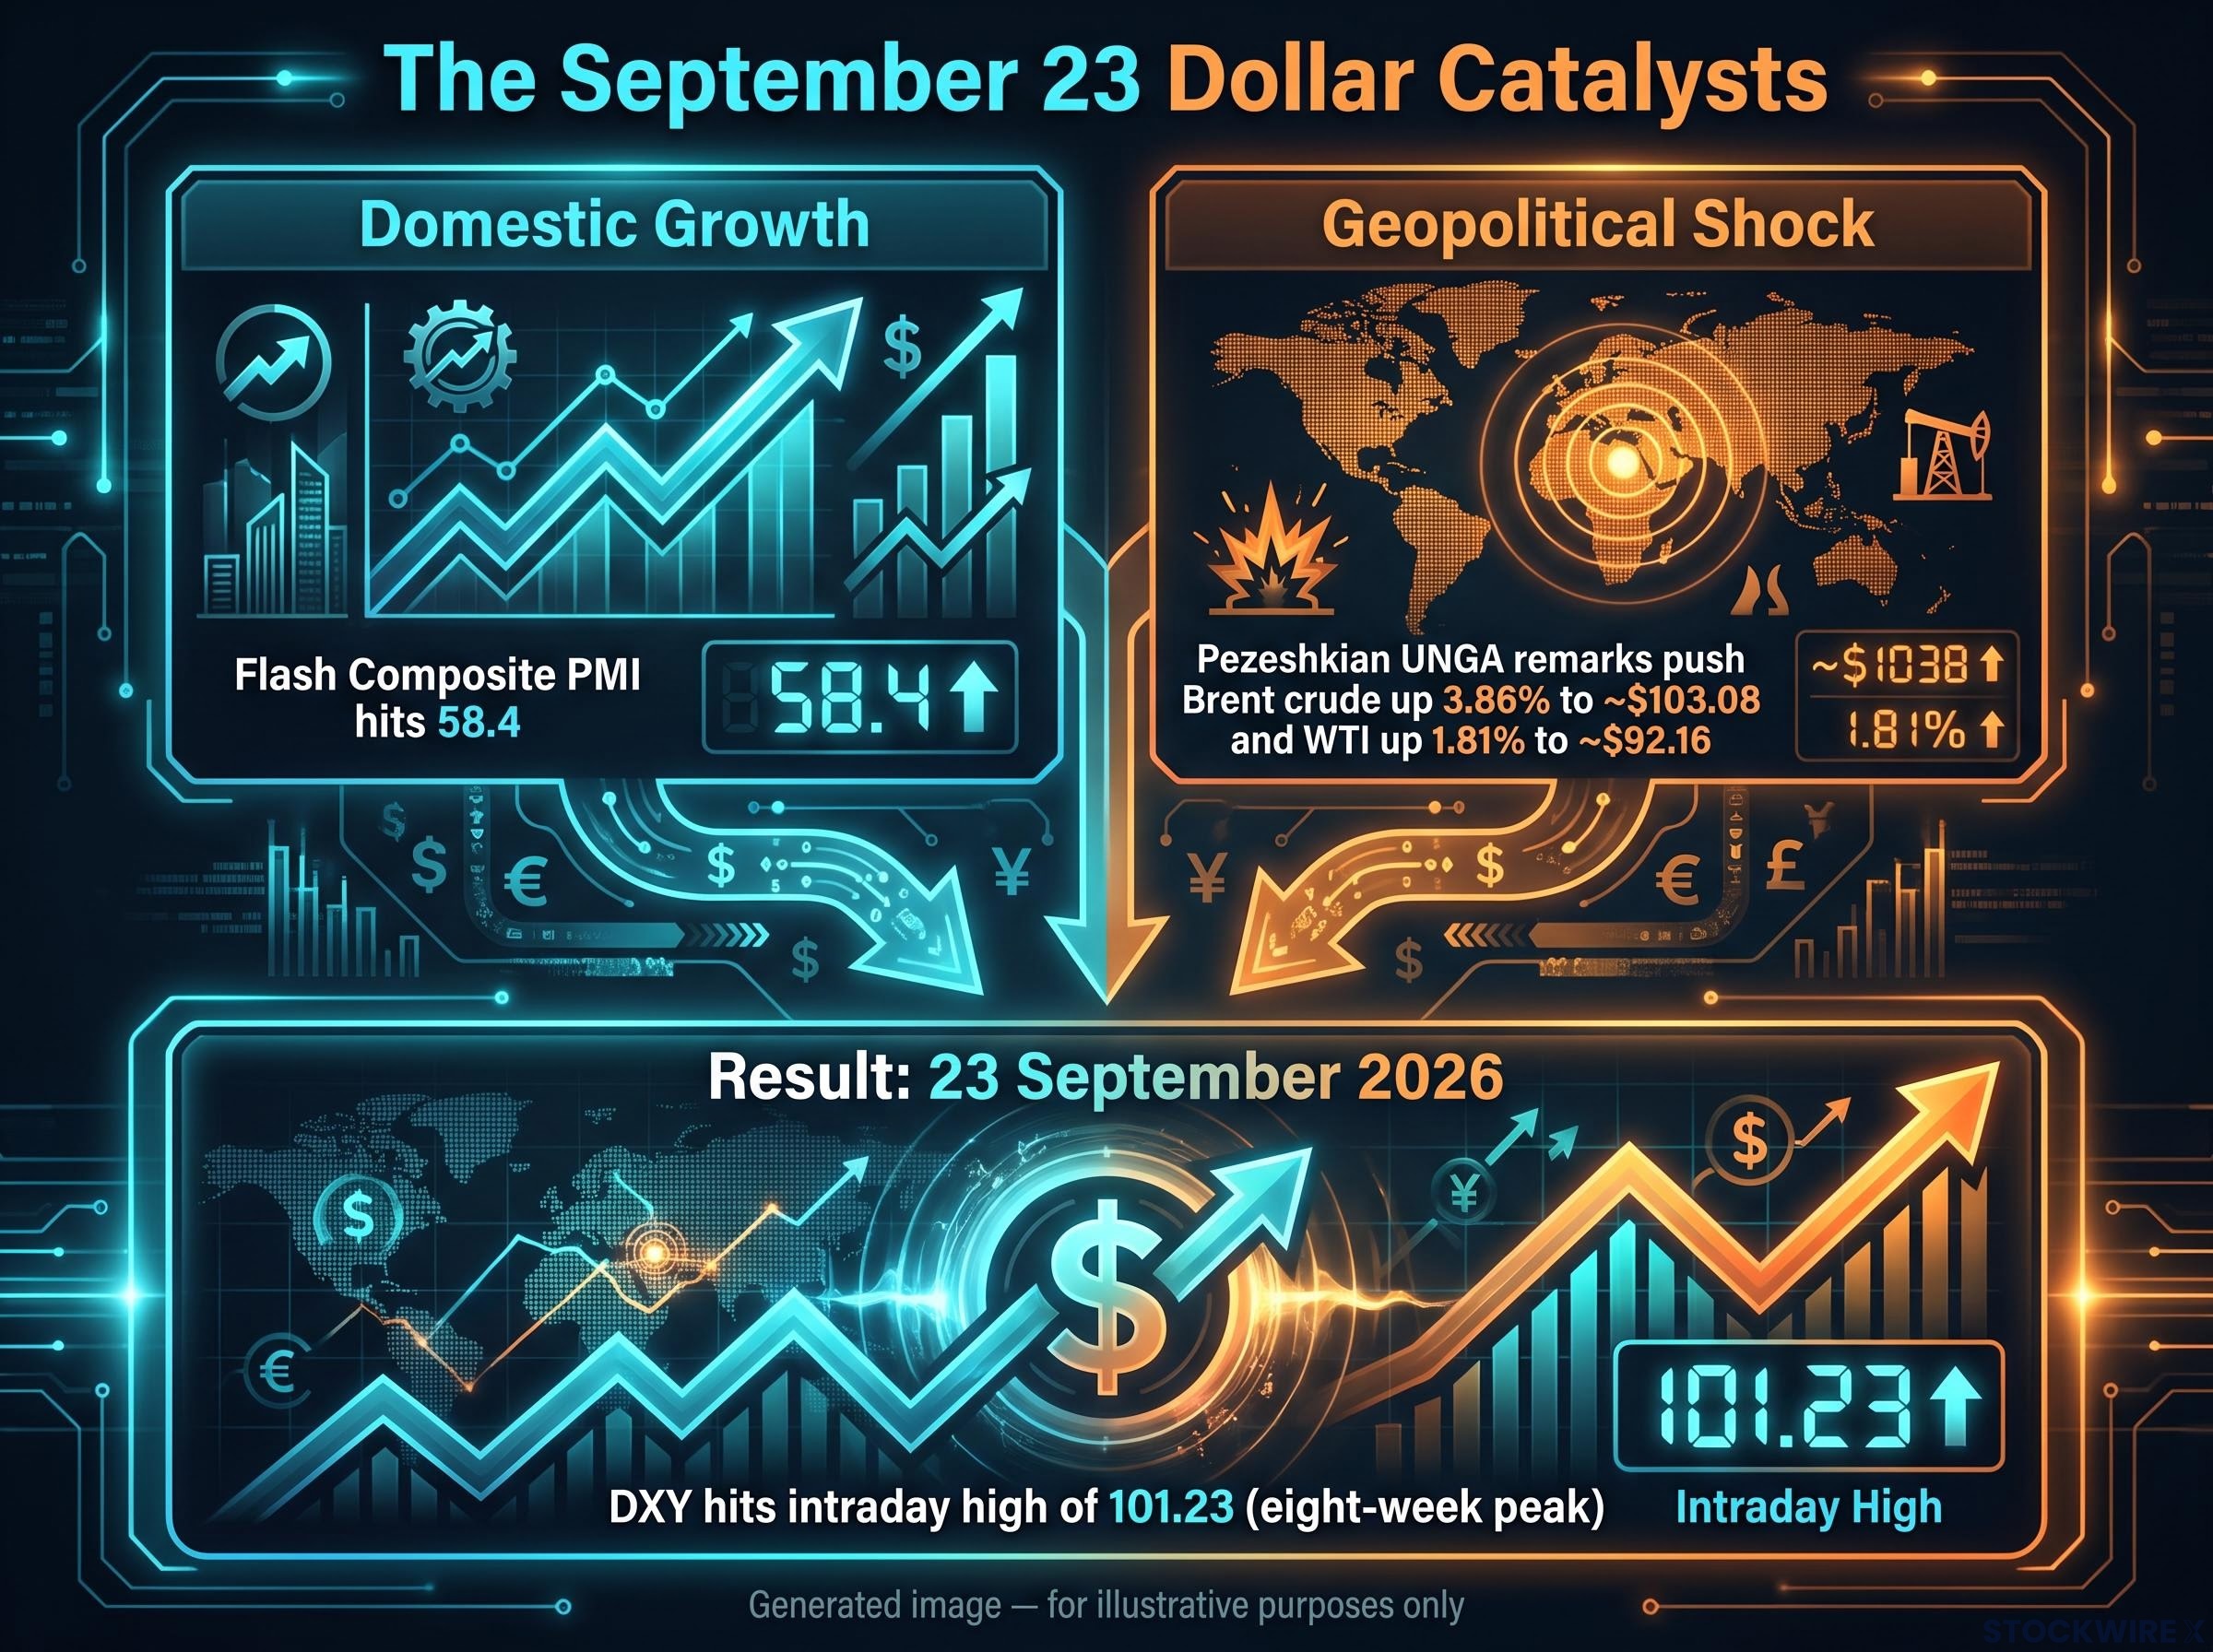
The dollar’s climb was precise. The DXY hit an intraday high of roughly 101.23 before settling around 101.10-101.14, up from approximately 100.60 the prior session. That marked its strongest level since late July 2026.
The DXY breakout above 100 earlier in September had already established 99.69-99.80 as a key support cluster, meaning the 23 September push to 101.10 arrived on a base where trend continuation was structurally favoured rather than contested.
Eight-week peak The DXY intraday high of approximately 101.23 on 23 September 2026 was its highest reading since late July 2026, an eight-week peak.
The primary catalyst was the flash composite PMI, which measures private-sector business activity across manufacturing and services. It came in at 58.4, up from 56.0 in August, the strongest reading since July 2021. A number above 50 signals expansion, and this one signalled acceleration.
The breadth mattered as much as the headline. Manufacturing registered 57.0 and services 58.7, according to S&P Global Market Intelligence, confirming the expansion was not concentrated in a single corner of the economy.
The second catalyst arrived from an entirely different direction. Iranian President Masoud Pezeshkian’s remarks at the United Nations General Assembly, which rejected US pressure while leaving diplomacy open, drove Brent crude up 3.86% to around $103.08 and WTI up 1.81% to approximately $92.16, reversing more than a week of declines.
Here is what makes this session analytically interesting. A domestic activity survey and a geopolitical oil shock are structurally unrelated events. That they converged to push the dollar the same way on the same day is not coincidence. It is a reflection of how tightly inflation and growth expectations are now wired into currency pricing.
The dollar’s gains were consistent across the board:
| Currency Pair | USD Weekly Change (%) |
|---|---|
| USD/EUR | +0.91% |
| USD/GBP | +1.13% |
| USD/JPY | +0.71% |
| USD/CAD | +0.80% |
| USD/AUD | +1.17% |
| USD/NZD | +0.82% |
| USD/CHF | +0.20% |
For you, the distinction between the two catalysts is the whole trade. If geopolitical risk fades but PMI strength holds, the dollar thesis looks durable. If the oil leg was the situational piece, one support beam could fall away.
When big ASX news breaks, our subscribers know first
How PMI data and energy costs feed directly into Fed rate expectations
“Strong data means higher rates” is the shorthand everyone reaches for. The actual chain has more links than that, and each one accumulates the pressure that lifted the dollar.
Start with the sequence analysts traced through this session:
- Geopolitical tension, in this case Pezeshkian’s UNGA remarks, lifts oil prices.
- Higher energy costs feed into the PMI input-costs sub-index and corporate margins.
- Strong output readings reduce the fear of an imminent recession.
- Markets infer the Fed has both room and reason to keep policy restrictive, or tighten further.
- Higher expected US yields attract capital, lifting the dollar.
The inflation link is not abstract. The input-costs sub-index, which tracks the prices businesses pay for materials and energy, hit 66.4, its highest since October 2022.
Inflation pressure anchor The PMI input-costs sub-index reached 66.4 in September 2026, its highest level since October 2022, signalling that cost pressures were building again rather than cooling.
The trajectory tells you this was not a one-off spike. The composite PMI climbed steadily: 51.9 in June, 53.6 in July, 56.0 in August, and 58.4 in September. That is an economy visibly gathering speed.
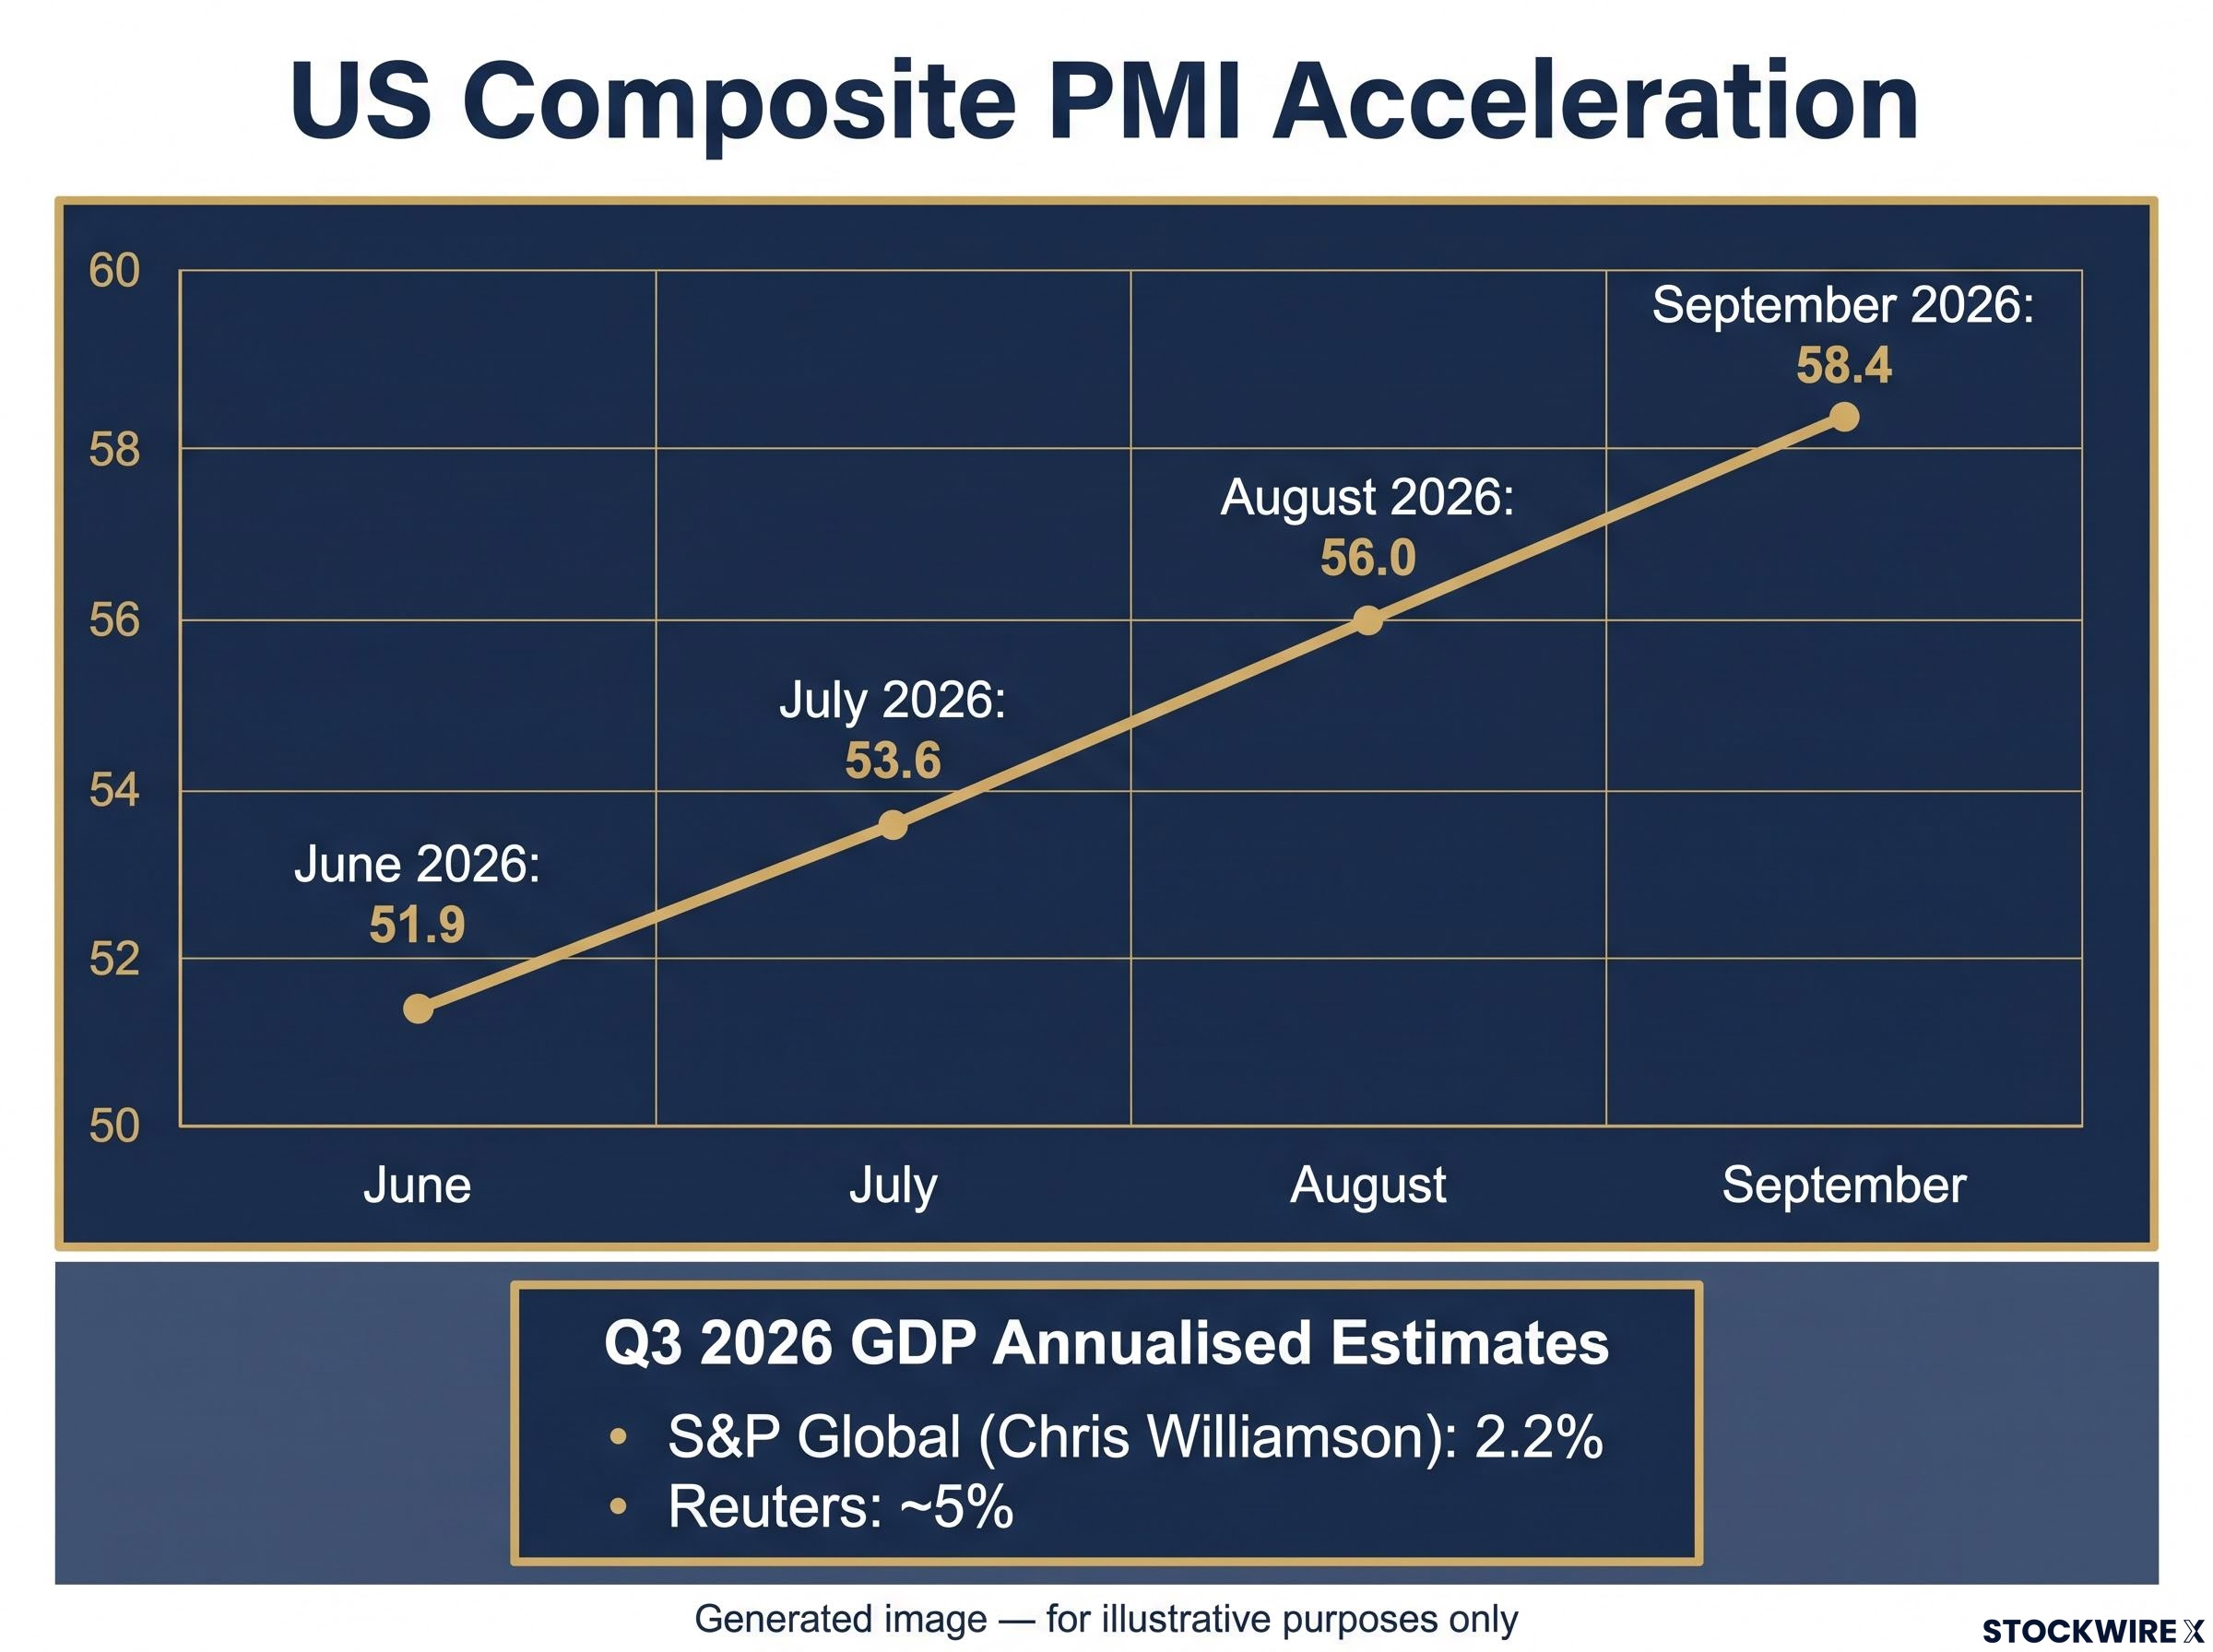
The pace estimates carry a caveat worth flagging. S&P Global’s Chris Williamson, cited in the original release, linked the survey to roughly 2.2% annualised Q3 GDP growth, while wider reporting via Reuters attached the 58.4 reading to approximately 5% annualised growth. Both figures sit above trend and point the same policy direction, even as the precise pace remains contested.
From yields to the dollar
Here is the mechanical bridge between the growth data and the currency. Rising Treasury yields make US-denominated assets more attractive relative to alternatives, which pulls capital inflows and lifts the DXY through the interest-rate differential.
That played out in real time. As the PMI print circulated on 23 September 2026, the 10-year Treasury yield moved back above 5%, with the 5-year also firm above that level, and the DXY’s push above 101 happened concurrently.
The clearest expression of how traders internalised all this was the repricing of Fed odds. The market-implied probability of an October rate hike rose to approximately 70%, according to LSEG data, following the flash PMI release.
That 70% figure is not just a positioning statistic. It tells you the professional money has already repriced the Fed. Holding USD assets or unhedged international positions without accounting for that shift is a risk decision made by default rather than by choice.
Fed policy transmission channels operate on very different timescales: yield-curve repricing is near-immediate, but the full demand-suppression effect of a rate hike takes twelve to twenty-four months to work through the economy, which is why the 70% October hike probability matters as a positioning signal well before any macro slowdown is visible in hard data.
What the PMI surge and oil rebound actually mean for markets beyond the headline
A dollar above 101, yields above 5%, and a 70% hike probability do not stay contained to the currency market. They reprice everything sensitive to US funding conditions, which is a long list.
The effects show up across three main channels:
- Emerging-market borrowing costs rise. Higher US yields lift the servicing burden on dollar-denominated debt held by EM borrowers, with the 10-year above 5% the practical threshold where refinancing costs turn material.
- Carry trades compress. Strategies that borrow in dollars to invest in higher-yielding EM currencies lose their edge as the appreciating dollar erodes the return.
- Safe havens rotate. Gold declined in the same session, a concrete sign of capital moving toward yield-bearing USD fixed income and away from non-yielding assets.
That gold move is the tell. When a stronger dollar and higher real yields arrive together, the opportunity cost of holding a non-yielding asset climbs, and the rotation flows through several asset classes at once.
For US investors with Asia-Pacific exposure, the currency leg is direct. The Australian Dollar was the week’s largest USD gainer on the other side, falling 1.17% against the dollar.
Cross-currency impact The Australian Dollar fell 1.17% against the US Dollar over the week, the sharpest loss among major currencies and a concrete measure of how the dollar’s strength erodes unhedged Asia-Pacific returns.
The four-month climb from 51.9 to 58.4 confirms this is not a single-session event. If you hold unhedged international equity or bond positions, a dollar at 101 with yields above 5% is a portfolio-level event. It changes the cost-benefit calculation on every non-USD position you own, and it does so before the next data release compounds the move.
Where the dollar rally could falter: the risks embedded in the current consensus
The bullish logic holds together well, which is precisely when it pays to introduce some productive doubt. The same conditions building this rally define the signals that would tell you it is turning.
Start with the fragility of the data itself. PMI surveys are high-frequency readings that can reverse quickly, and this strength followed a period of near-stagnation, with the composite at just 51.9 as recently as June 2026. A rapid acceleration can unwind just as fast if external demand softens or supply bottlenecks ease.
How fast this moved The composite PMI ran from 51.9 in June 2026 to 58.4 in September, a four-month acceleration steep enough to raise the question of how durable it really is.
There is a structural layer beneath the near-term picture. US fiscal deficits, elevated public debt, and ongoing global efforts to diversify reserve holdings away from the dollar sit as persistent background pressures. They tend to reassert themselves when the rate-differential support narrows.
The oil catalyst cuts both ways. The same diplomatic dynamics that lifted Brent to around $103 on Pezeshkian’s remarks could reverse on diplomatic progress, and a falling oil price would remove one leg of the inflation-expectations argument propping up the dollar.
Oil price reversal risk is asymmetric here: Brent above $103 is sustained by conflict continuity rather than a positive demand or supply development, and the same diplomatic headlines that lifted prices on Pezeshkian’s UNGA remarks could unwind the geopolitical premium as quickly as it built.
Even the bullish input-costs figure carries a warning. The 66.4 sub-index reading, cited above as evidence of inflation pressure, becomes a growth headwind if sustained, because persistently high costs eventually squeeze margins and demand. S&P Global’s August note had described a “welcome mix of hotter output growth, cooler inflation,” a reminder that disinflation had not fully reversed before September’s jump.
Watch three specific reversal signals:
- Composite PMI declining in the next flash reading, particularly a pullback toward 55.
- Oil retracing below roughly $95 on diplomatic progress.
- Fed communication signalling concern about overtightening into a slowdown.
If composite PMI softens or oil retraces below key levels, the higher-for-longer thesis weakens, and the dollar’s fundamental support goes with it.
What the convergence of data and geopolitics tells you about dollar positioning now
Step back from the individual data points and the picture resolves into something coherent. September’s PMI surge and oil rebound are not isolated events. They are evidence of an economy running hot enough that the Fed’s restrictive stance looks both justified and likely to persist into Q4 2026.
Read together, the signals align. The DXY at 101.10-101.14, the 10-year yield above 5%, and the roughly 70% October hike probability all point the same way: the rate-differential advantage for USD assets remains intact and may be widening, which supports continued dollar strength as the base case.
That rare alignment is the opportunity here. When the data, the market pricing, and the Fed’s own framework all point in one direction, the next inflection point will be equally visible when it arrives. You are not flying blind.
Two upcoming data points will confirm or challenge this thesis:
- Watch the next flash PMI composite for whether the acceleration persists or fades back toward the mid-50s.
- Watch Fed communication and the October FOMC decision for confirmation of, or deviation from, the higher-for-longer path.
For calibrating exposure to international assets or USD-denominated positions, that gives you a data-grounded framework with defined signals rather than sentiment as your guide.
For readers who want a structured framework before the October FOMC decision, our dedicated guide to decoding Fed communication explains how to distinguish binding policy signals from non-voting regional president commentary and where in the Summary of Economic Projections the real positioning advantages emerge.
This article is for informational purposes only and should not be considered financial advice. Investors should conduct their own research and consult with financial professionals before making investment decisions.
Past performance does not guarantee future results. Financial projections are subject to market conditions and various risk factors, and forward-looking statements are speculative and subject to change based on market and policy developments.