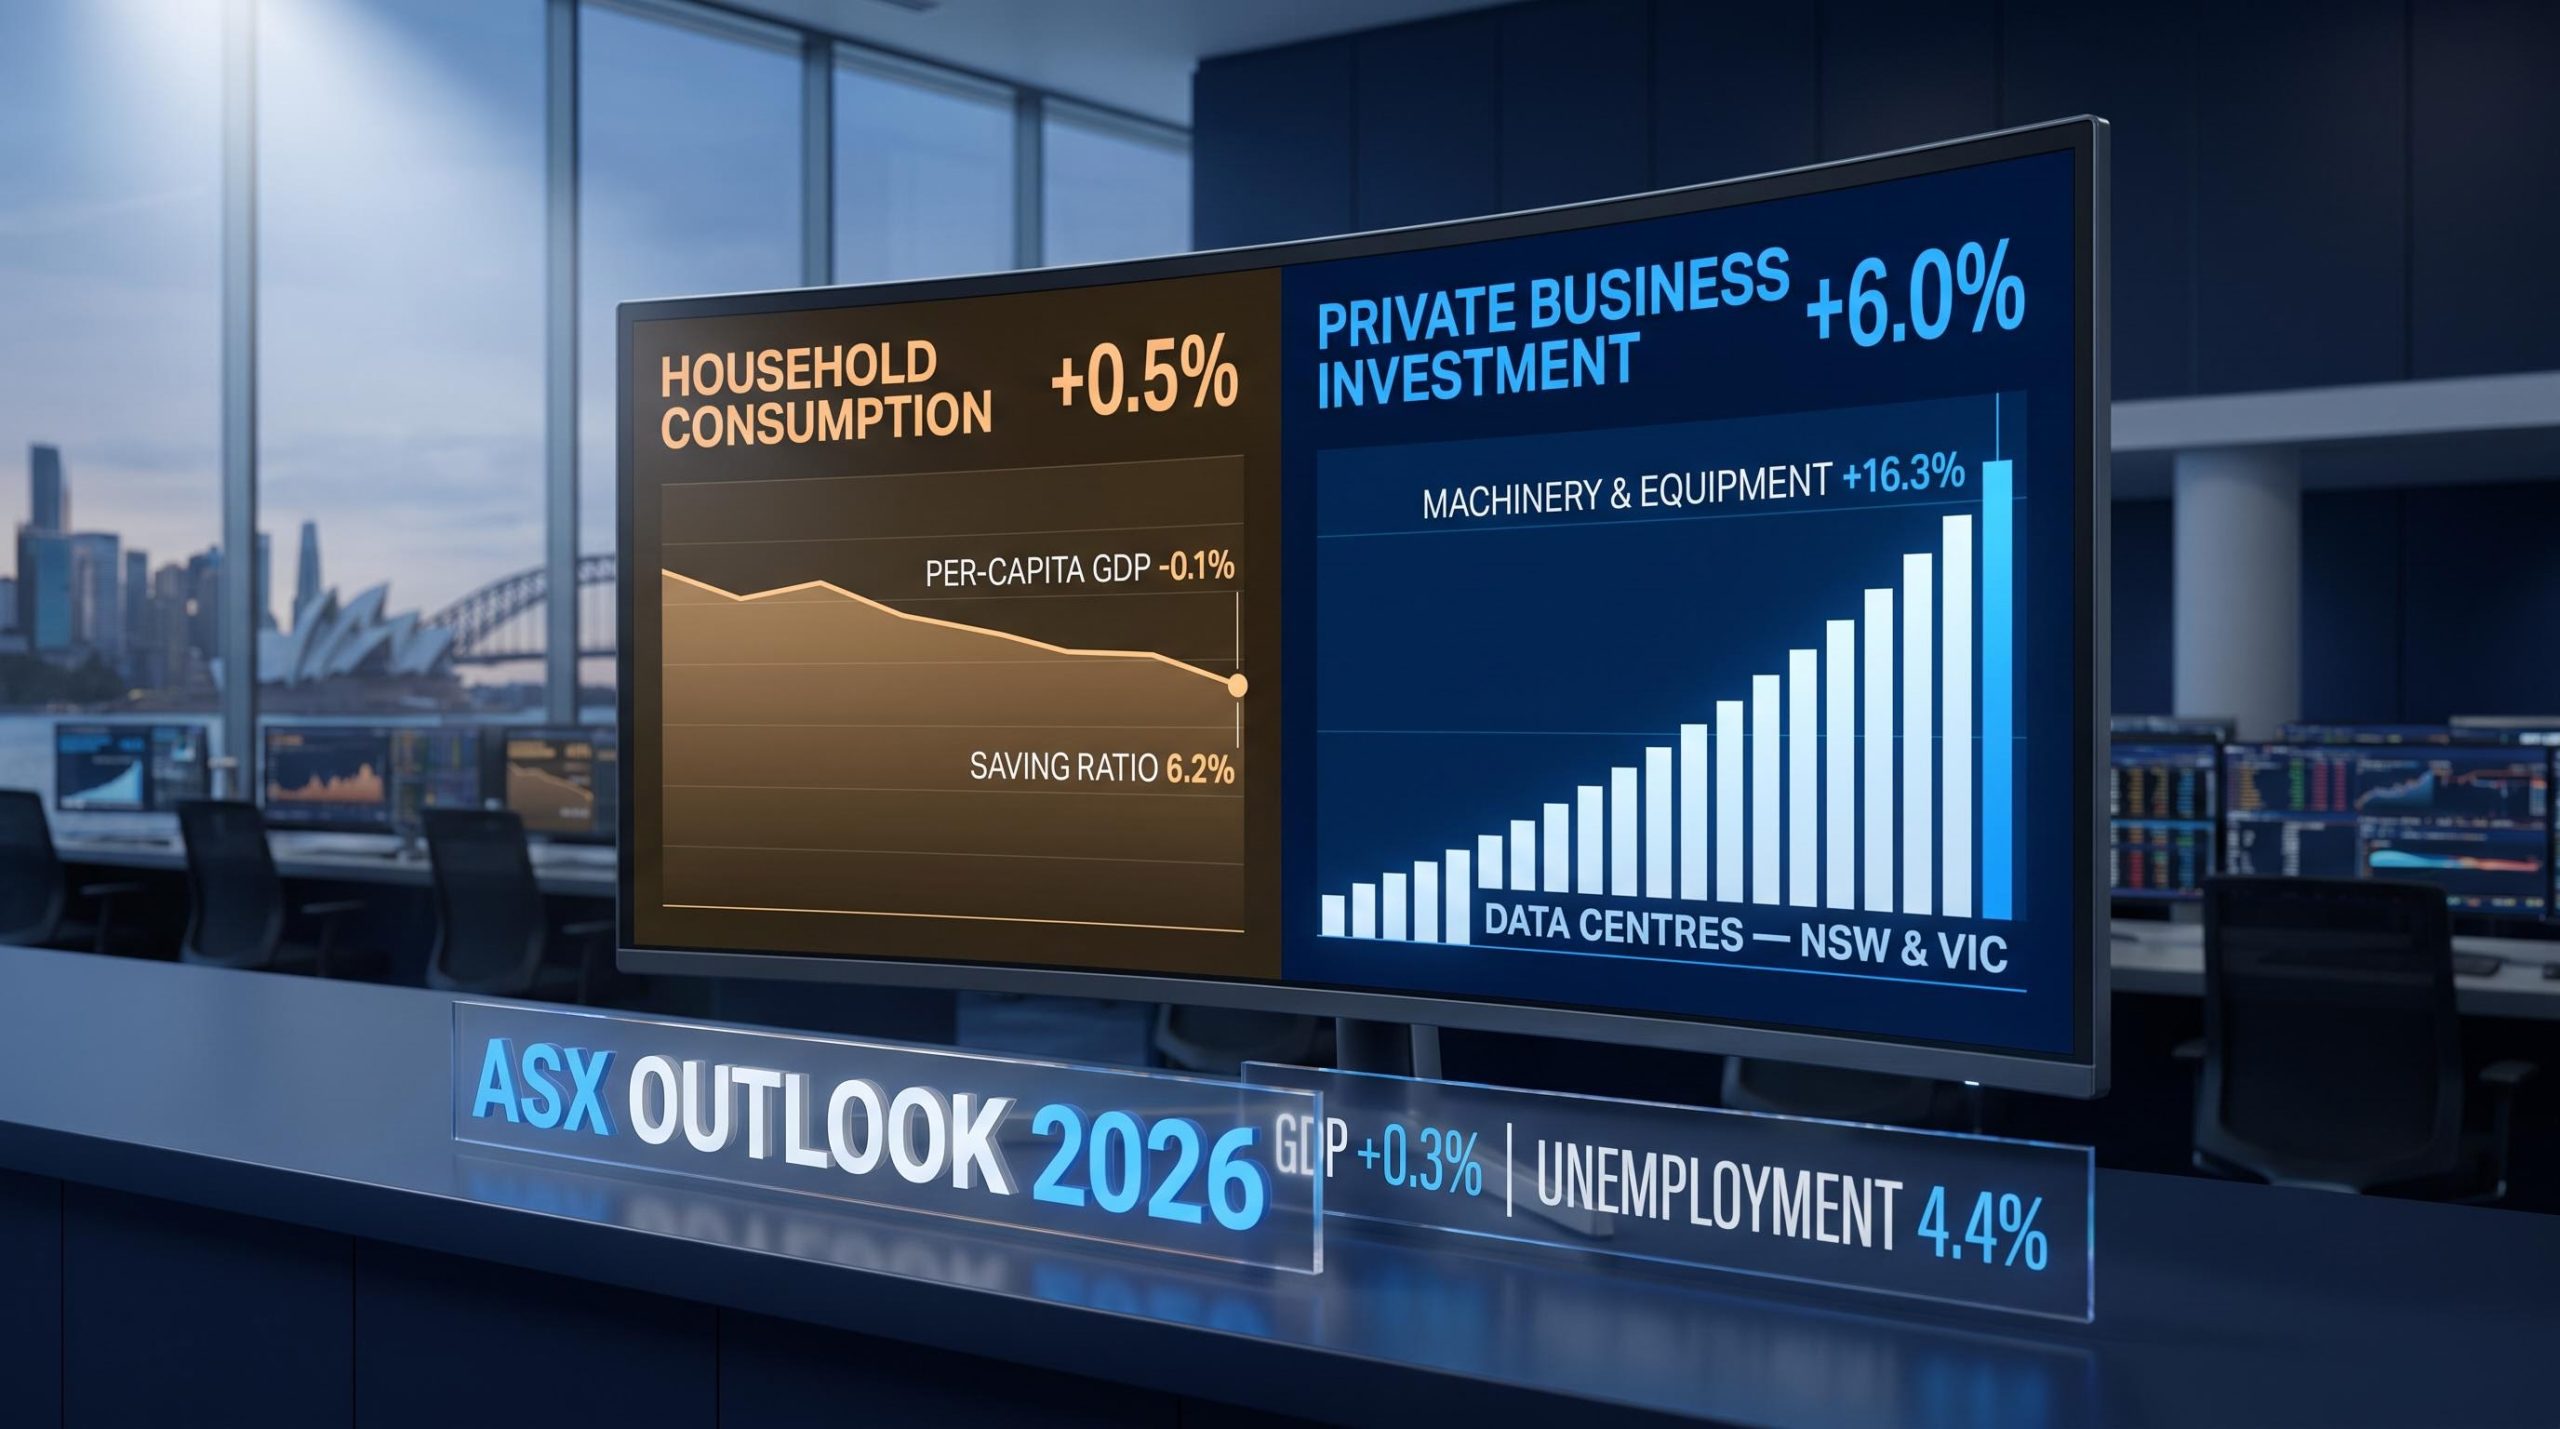
Household consumption grew 0.5% in the March 2026 quarter. Private business investment grew 6.0%. Those two numbers describe the same economy in the same three-month period, and the gap between them is the single most important signal for ASX investors right now.
Australia’s headline GDP of 0.3% for the quarter looks slow but not alarming. The problem is that the headline masks a fundamental division within the economy: capital expenditure by businesses, concentrated in data centres and digital infrastructure, is gathering momentum, while household spending is fading, sustained by shrinking savings buffers rather than genuine income growth. That divergence makes sector selection and stock-level analysis far more consequential than any broad index call for the second half of 2026.
Here is the practical mapping exercise. After reading, you will know which part of the two-speed economy each of your major ASX sector exposures sits in, what that means for risk and opportunity, and which three variables could change the picture entirely.
The macro picture hiding in plain sight
The surface reading of the March 2026 quarter is straightforward: GDP growth of 0.3%, down from 0.9% in the December 2025 quarter. A deceleration, but not a contraction. The economy is slowing, not shrinking.
The more revealing figure sits underneath. GDP per capita fell 0.1% in the March 2026 quarter, meaning population growth is running ahead of output. Living standards are compressing. That distinction matters because it feeds directly into household confidence and discretionary spending, which in turn determines earnings trajectories for a large segment of the ASX.
The concept of a per capita recession, where aggregate output grows while individual living standards contract, is not new to the Australian context; corporate insolvencies reached approximately 12,000 in 2025 and real wages declined even as headline GDP posted positive prints, establishing the conditions that now feed directly into the household saving ratio pressure visible in the March 2026 data.
Conditions in the labour market reinforce this reading. Unemployment reached 4.4% in June 2026, and the employment-to-population ratio of 64.0% reflects a workforce that is expanding even as hiring absorbs those new entrants. The overall direction is a gentle easing rather than any sharp deterioration.
| Indicator | Figure | Period |
|---|---|---|
| GDP growth (quarterly) | +0.3% | March 2026 quarter |
| GDP growth (prior quarter) | +0.9% | December 2025 quarter |
| GDP per capita (quarterly) | -0.1% | March 2026 quarter |
| Headline CPI (year-on-year) | 3.9% | June 2026 quarter |
| Trimmed mean CPI (year-on-year) | 3.6% | June 2026 quarter |
| Unemployment rate | 4.4% | June 2026 |
| Employment-to-population ratio | 64.0% | June 2026 |
Why the RBA cannot simply cut its way out
Headline CPI came in at 3.9% year-on-year for the June 2026 quarter, according to the RBA’s August 2026 Statement on Monetary Policy (noting a 3.8%-3.9% range across sources). Trimmed mean inflation, the RBA’s preferred measure, which strips out the most volatile price movements, sat at 3.6%. Both remain materially above the RBA’s 2-3% target band.
According to the RBA’s August 2026 Statement on Monetary Policy, the conflict in the Middle East added roughly 0.1 percentage points to trimmed mean inflation during the June 2026 quarter, while road freight costs climbed by over 15% across that same period.
What this tells you is that the RBA is boxed in. Cutting rates too aggressively risks re-igniting inflation that has not yet returned to target. Holding rates too long risks deepening the squeeze on households already drawing down their savings. That bind is precisely what keeps the two-speed divergence alive rather than resolving it.
When big ASX news breaks, our subscribers know first
What the divergence actually looks like in the data
Household consumption: +0.5% in the March 2026 quarter. Private business investment: +6.0% in the same period.
The spread between those two figures is where the analytical story lives. But the business investment number becomes even more striking when you drill into its composition.
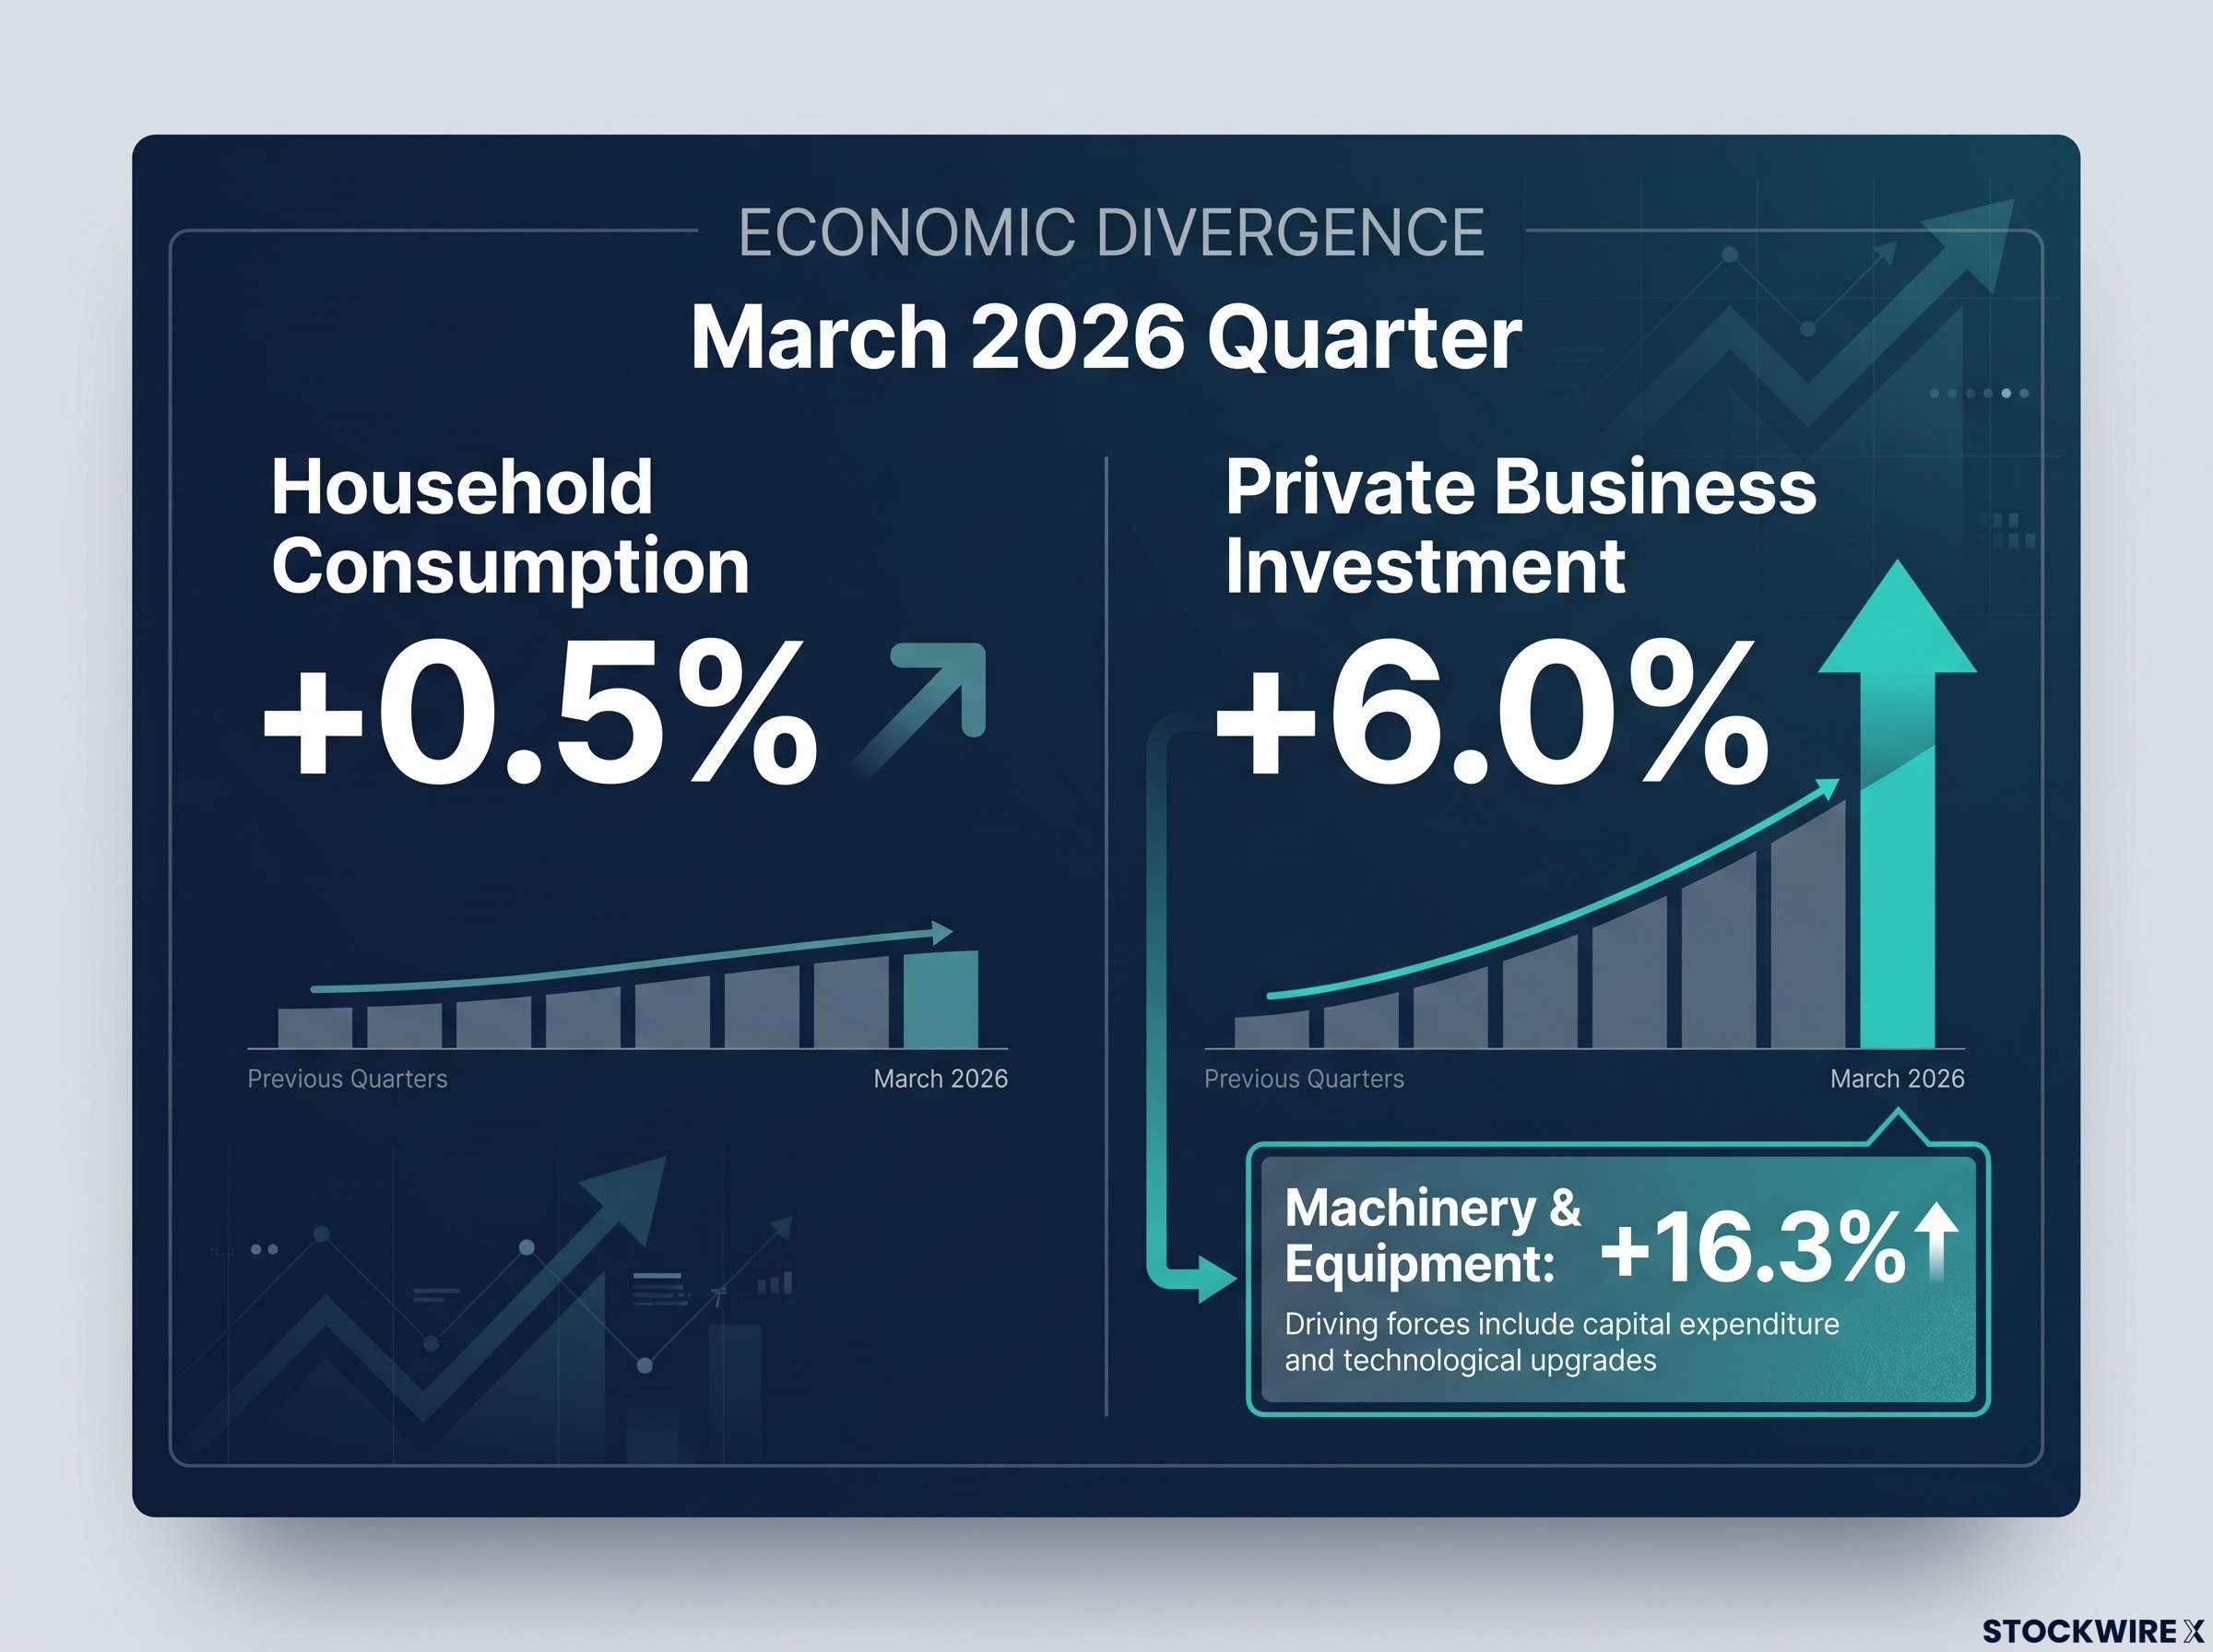
Machinery and equipment expenditure surged +16.3% in the March 2026 quarter, with the bulk of that activity attributable to data centre construction accelerating across New South Wales and Victoria.
That concentration in data centre capital expenditure tells you the business investment surge is structural, tied to multi-year demand from AI workloads and cloud expansion, not a short-term cyclical bounce that could reverse on the next rate decision.
ABS capital expenditure data confirms that data centre construction is the dominant driver behind the machinery and equipment surge, with New South Wales and Victoria accounting for the majority of new investment commitments in the category.
The household side looks different when you examine the mechanism behind the spending:
- Household consumption grew just 0.5%, barely keeping pace with population growth
- The household saving ratio fell from 7.0% to 6.2% in the March 2026 quarter
- Mortgage-heavy cohorts remain under pressure from elevated borrowing costs and higher living expenses
The savings ratio decline is the figure you should track most closely. It means household spending is being sustained partly by drawing down buffers, not by genuine income growth. That makes the consumer sector more fragile than the headline consumption number alone suggests. Understanding the mechanism behind the divergence, structural tech capex versus buffer-funded consumer spending, is what allows you to make confident sector calls rather than reacting to each monthly data release as though it changes the picture.
A plain-language guide to how macro conditions move ASX sectors
A GDP print of 0.3% or an RBA rate decision does not hit every ASX-listed company equally. The transmission works through three distinct channels, and knowing which channel your holdings are exposed to is the primary analytical filter before making any sector call.
- Consumer demand channel: Household income and confidence flow into revenue for retail, travel, and discretionary businesses. When per-capita GDP contracts and savings buffers decline, this channel tightens directly.
- Cost and financing channel: Interest rates and input costs (freight, energy, wages) hit margins and capital access. Companies with high debt loads or thin margins feel this channel most acutely.
- Global demand channel: Commodity prices and trade flows drive earnings for resources and energy producers largely independent of domestic conditions. The 6.0% business investment surge is invisible in the GDP headline, but visible through this lens.
Domestic earnings vs. globally driven earnings: the primary filter
Resources and energy names like BHP, Rio Tinto, Fortescue, Woodside, and Santos sit squarely in the globally driven bucket. Their earnings are shaped by Chinese industrial demand, global commodity prices, and geopolitical risk, not by whether Australian households are spending more at the shops.
Banks and consumer discretionary stocks sit in the domestically driven bucket, directly exposed to the household economy’s trajectory.
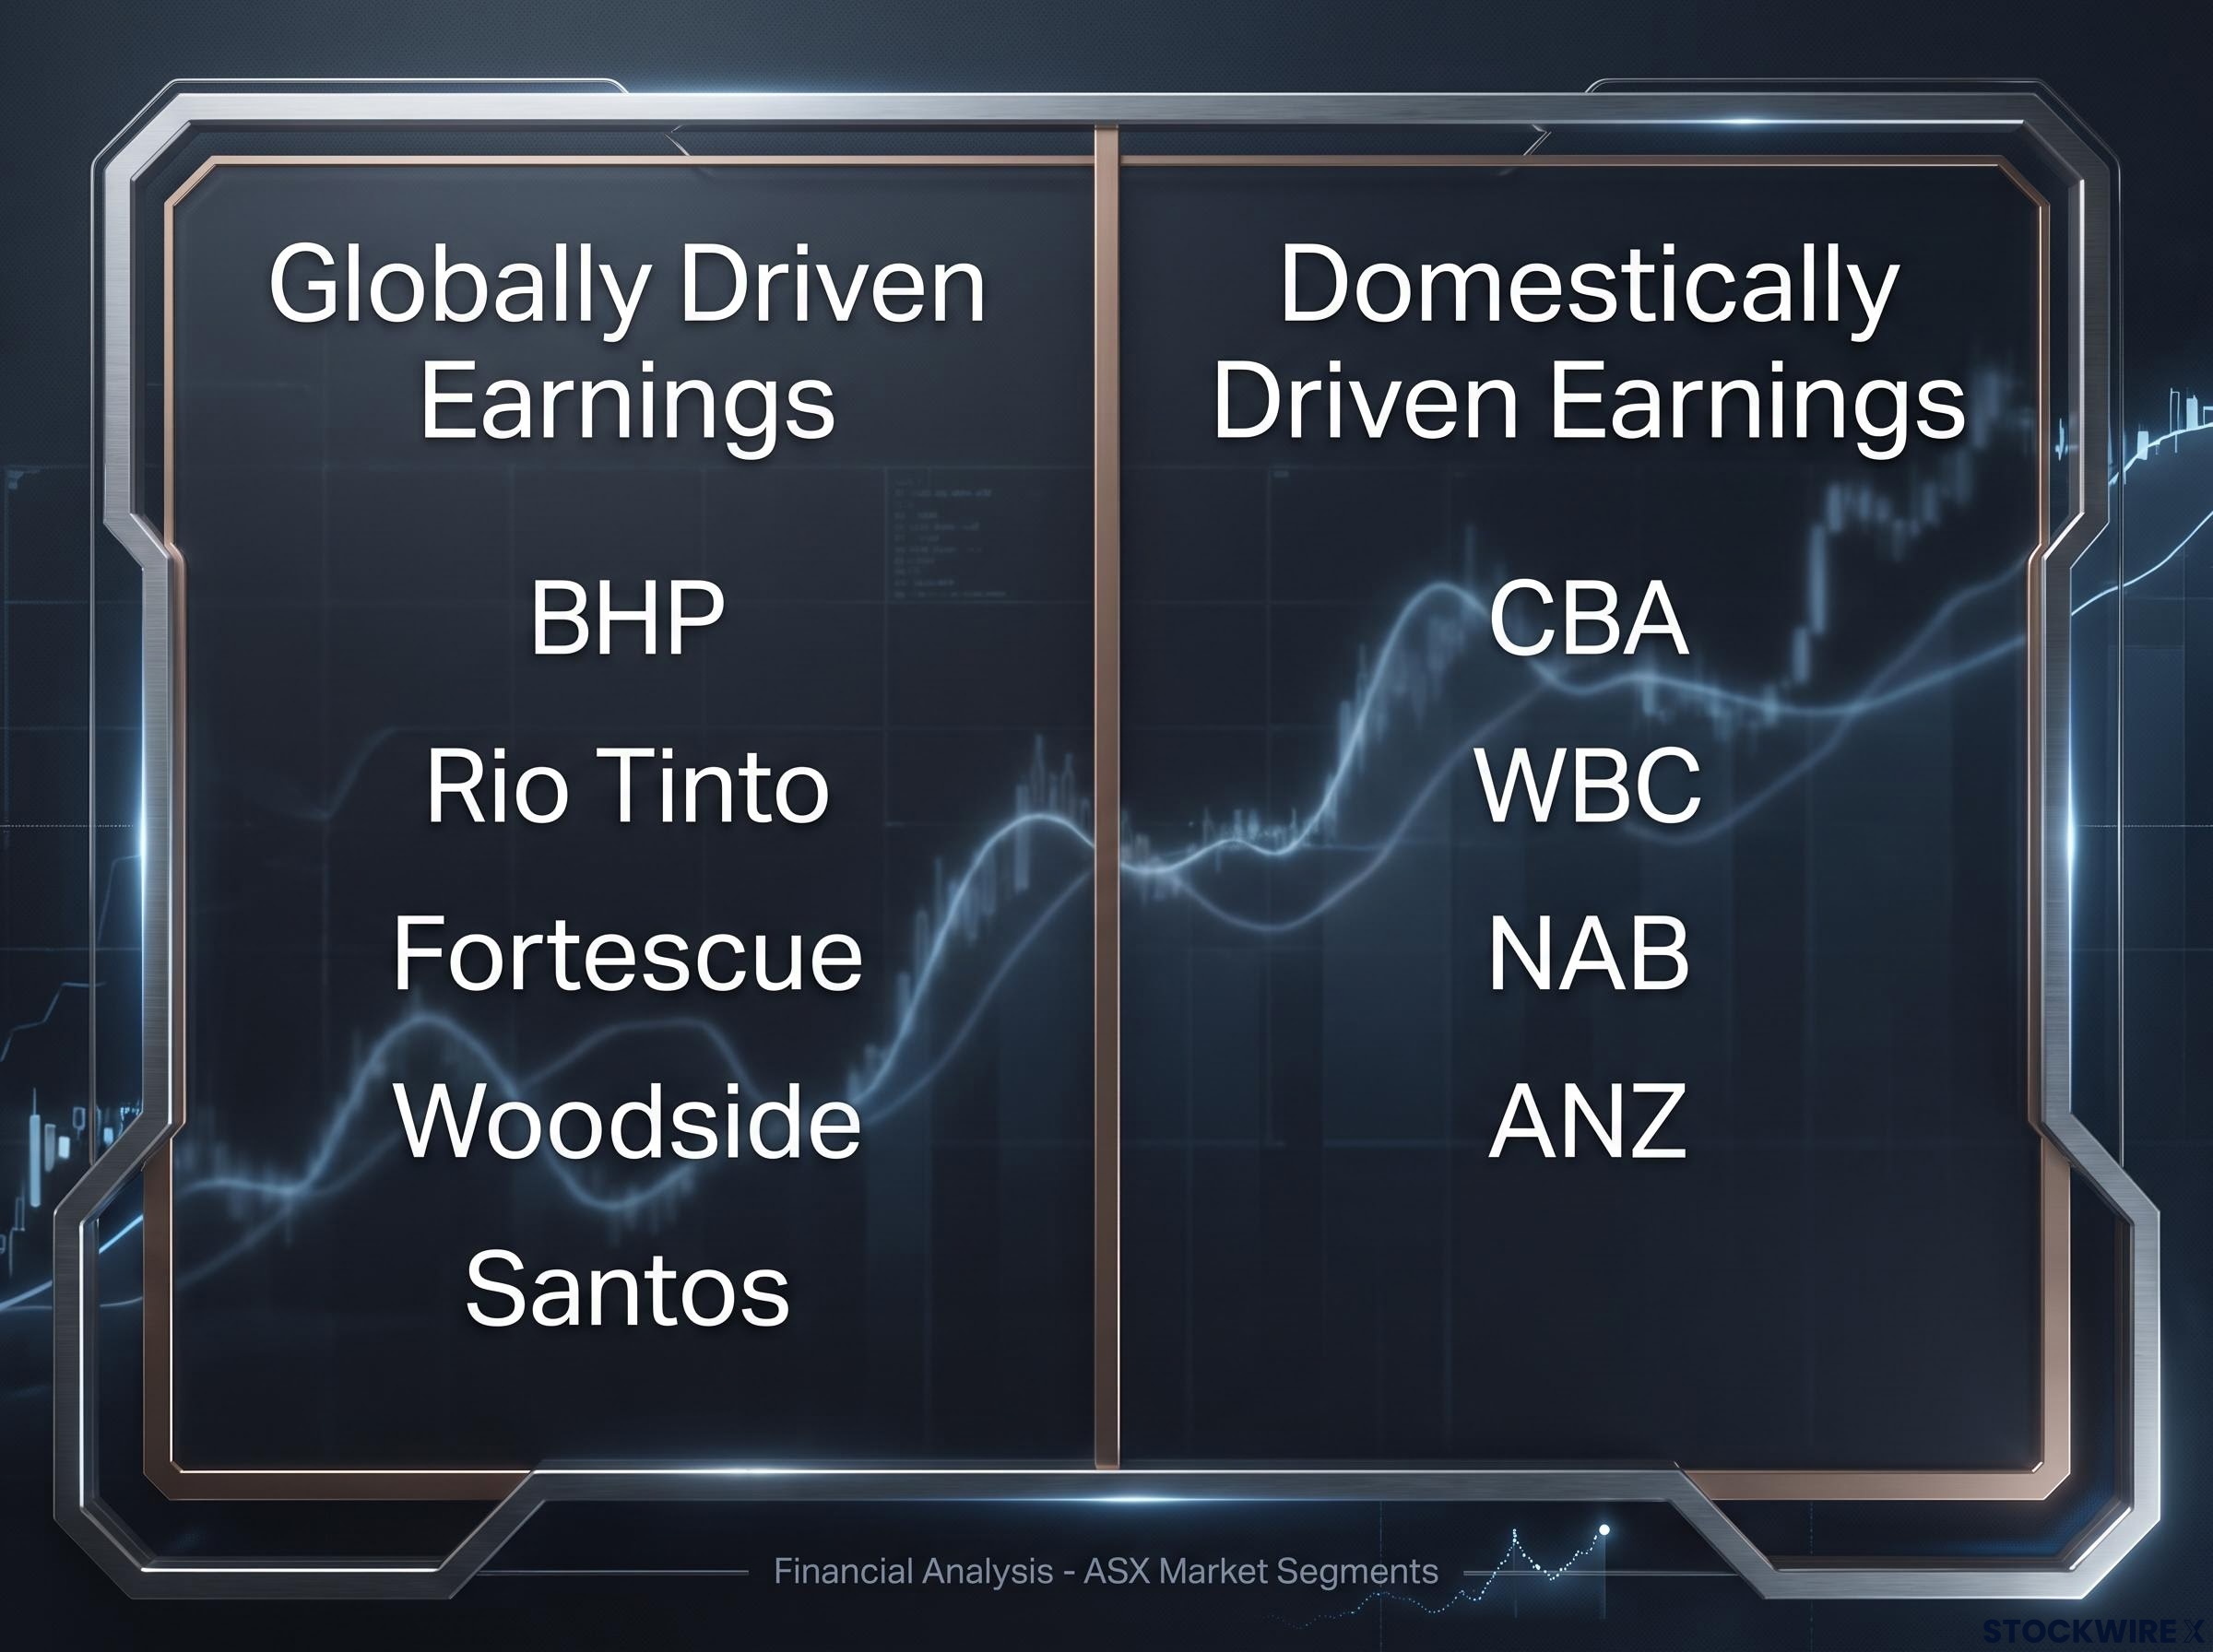
Some sectors straddle the divide. Certain industrials and tech-adjacent names draw revenue from both domestic business investment and global demand. That is where the analysis requires the most precision. Once you understand which channel each of your ASX holdings is primarily exposed to, you can assess each new macro data release as relevant or irrelevant to that holding rather than reacting to the aggregate as if it affects every stock equally.
ASX sector rotation out of rate-sensitive domestic names and into globally exposed technology and base metals accelerated in early June 2026, with the ASX 200 Information Technology sub-index gaining 4.71% in a single session as institutional managers closed underweight positions, a live illustration of the two-speed framework playing out at the portfolio-flow level.
Where each major ASX sector sits in a split economy
The two-speed framework only earns its keep if you can apply it sector by sector. Here is how each major ASX sector maps against the divergence, assessed through a consistent lens: which lane it sits in, its primary risk or opportunity, and the watchpoint for the second half of 2026.
| Sector | Economy lane | Primary risk or opportunity H2 2026 | Key watchpoint |
|---|---|---|---|
| Banks and financials | Domestic (household) | Credit quality deterioration | Arrears trend as saving buffers decline |
| Resources and bulk commodities | Global | China demand trajectory | Chinese industrial output and commodity pricing |
| Energy producers | Global (with domestic inflation link) | Geopolitical price support vs. de-escalation risk | Conflict developments and energy transition pace |
| Consumer-facing stocks | Domestic (household) | Margin compression from weak demand plus high input costs | Per-capita GDP and saving ratio direction |
| Tech and data centre infrastructure | Business investment (fast lane) | Multi-year capex cycle from AI and cloud demand | Contract quality and valuation discipline |
Banks and financials
Higher rates rebuilt net interest margins, but most of that benefit is now priced in. The forward risk sits in asset quality: pressured households, declining savings buffers, and 4.4% unemployment increase the probability of rising arrears. Stock-level selection matters more than a blanket overweight call, with business mix (mortgages versus business lending versus markets income) the key differentiator among CBA, WBC, NAB, and ANZ.
Resources and bulk commodities
For BHP, Rio Tinto, and Fortescue, domestic household conditions are largely irrelevant. China’s growth path and global commodity demand drive the earnings thesis. Road freight costs rising more than 15% in the June 2026 quarter create a margin headwind, but the central analytical task remains tracking global demand, not local GDP.
Energy producers
Woodside and Santos occupy an interesting dual role. Geopolitical risk that lifts oil and gas prices simultaneously supports their revenue while compounding household inflation pressure. These stocks can function as a partial portfolio hedge: the forces that squeeze consumers often lift energy earnings. The trade-off is direct exposure to de-escalation risk.
Consumer-facing stocks
This is where the macro headwind is most concentrated. Weak per-capita GDP (-0.1%), buffer-funded spending (saving ratio at 6.2%), and elevated mortgage costs combine to suppress discretionary demand. Within the sector, preference names with pricing power, non-discretionary categories, or customer bases skewed toward less-leveraged cohorts.
Technology and data centre infrastructure
These names are plugged into the 6.0% business investment cycle. The 16.3% machinery and equipment surge, concentrated in New South Wales and Victoria data centres, illustrates the scale. Multi-year structural demand from AI workloads means relative insulation from short-term consumer weakness. Valuation discipline is required; contract quality (long-term, inflation-linked agreements) is the key differentiator between quality exposures and speculative ones.
The physical bottlenecks in digital infrastructure, particularly power availability and grid connection queues, mean the 16.3% machinery and equipment surge is not evenly distributed across all data centre operators; AEMO’s Draft 2026 Integrated System Plan identifies power constraints as the binding limit on how quickly contracted capacity can translate into earnings.
Six portfolio principles for a two-speed ASX
These principles flow directly from the macro evidence, not from general diversification theory. Each one names a specific condition and implies a specific action.
- Disaggregate “the economy”: Separate globally driven earnings (resources, energy) from domestically exposed earnings (banks, consumer stocks). The 0.3% GDP headline conceals more than it reveals.
- Prioritise quality within financials: Strong capital positions and conservative provisioning matter more than chasing the highest margin franchise, precisely because that is where credit quality risk is building as the saving ratio falls to 6.2%.
- Lean into the business investment cycle: Tilt toward data centre and digital infrastructure beneficiaries supported by the 16.3% machinery and equipment surge, but maintain valuation discipline.
- Use energy as a deliberate hedge: The same geopolitical forces compressing household budgets tend to support energy producer earnings. Size this exposure with awareness of de-escalation risk.
- Favour stock-level analysis over index timing: In a genuine two-speed environment, mapping each holding’s revenue, cost, and risk exposures to the “slow” and “fast” lanes is more productive than trying to time the overall index.
- Monitor the labour market relentlessly: Unemployment at 4.4% and an employment-to-population ratio of 64.0% describe a labour market that is loosening, not collapsing. If that changes, the implications cascade fast.
For investors wanting to see how dramatically sector-level returns can diverge from the index headline in a split economy, our full explainer on ASX 200 sector divergence in June 2026 documents a 22-point spread between the best and worst performing sectors, with the precise earnings revision trajectory across consumer, financial, and industrial stocks in focus.
The “slow, not recessionary” characterisation of the labour market is the single most important assumption underlying this entire framework. If unemployment rises faster than expected, reassess assumptions about consumer demand, bank credit quality, and the RBA’s rate path simultaneously. Know now what you would change.
Three variables that could change the two-speed thesis
The framework above is not a static conclusion. Three specific variables could materially shift the picture, and each one connects directly to sector exposures in your portfolio.
- Unemployment trajectory: A sustained move above 4.4% would accelerate household stress, push bank arrears higher, and potentially force the RBA toward faster cuts regardless of inflation readings. Consumer and banking exposures are most directly affected.
- RBA rate path and signalling: With trimmed mean inflation at 3.6%, the pace of rate reductions remains constrained. Any shift in RBA communication about inflation tolerance or cut timing would immediately reprice rate-sensitive sectors and duration risk across the market.
- Global commodity demand, particularly from China: A sharper-than-expected slowdown in Chinese industrial demand would compress resources earnings. Conversely, a geopolitical de-escalation that reduces energy costs would simultaneously ease household inflation pressure and compress energy sector earnings, illustrating how the hedges described above are interconnected.
The two-speed economy is not a temporary anomaly that resolves itself by the end of the year. It is a structural condition that rewards active portfolio mapping over passive index exposure. For ASX investors in the second half of 2026, the question to ask about every holding is not “how is the economy doing?” but “which economy is this company actually exposed to?” That question has a specific, researchable answer for every position you own.
This article is for informational purposes only and should not be considered financial advice. Investors should conduct their own research and consult with financial professionals before making investment decisions. Past performance does not guarantee future results. Financial projections are subject to market conditions and various risk factors.