Most people assume a rate hike lifts a currency. Higher interest rates should attract money, so the Australian dollar should rise. Yet markets put roughly an 80% chance on an RBA hike on 3 November, and TD Securities FX strategist Howard Du is still bearish on AUD against other currencies.
That contradiction matters this week. The RBA meeting and the US midterm elections both fall on Tuesday, 3 November 2026. AUD/USD is also trading below its 200-day moving average, a widely watched trend line on the chart.
If you treat the decision itself as the catalyst, you could misread whatever the Australian dollar does next. The thing that actually moves the currency is the change in expectations.
Here is how to tell when a hike is already in the price, and which signals would genuinely change the AUD picture.
Why can a hike the market expects leave the Australian dollar flat?
The intuition is reasonable. If Australian rates rise, holding Australian dollars pays more, so demand for AUD should climb. Your instinct only fails on timing.
In most conditions, the rate-response channel works as you would expect: hikes attract foreign capital and lift the currency. It breaks down when the hike is already priced, which is why timing matters more than direction.
What “priced in” actually means
Currency markets do not wait for the announcement. They trade the expected path of interest rates, which is the sequence of rate moves traders think is coming over the next months. “Priced in” means the expected outcome is already reflected in today’s exchange rate.
Here is how that works on the numbers. The cash rate sits at 4.60%, and a 25 basis point hike (a quarter of a percentage point) would take it to 4.85%, according to the ASX RBA Rate Tracker. At an 80% probability, traders have already built most of that extra yield into the price of the Australian dollar.
So when the RBA delivers, very little new information reaches the market. The exchange rate responds to the surprise against what was priced, not to the rate itself. That gap explains the trading pattern known as “buy the rumour, sell the fact”: traders buy as the odds climb, then take profits once the move arrives with nothing extra attached.
Howard Du, TD Securities Du’s core point is that the near-term hike is already priced, while markets remain reluctant to price further RBA hikes, so the decision itself offers the AUD little additional lift.
How pricing moved in the last week
The odds have swung hard. Just after weak September jobs data, when employment unexpectedly fell, markets priced nearly a 90% chance of a November hold (Reuters, 15 October 2026).
The 28 October consumer price index (CPI) release flipped that. Inflation came in at 4.3% year-on-year, and the tracker jumped from 60% on 27 October to 82% on 28 October, before easing to 80% by 30 October (FXStreet, 30 October 2026).
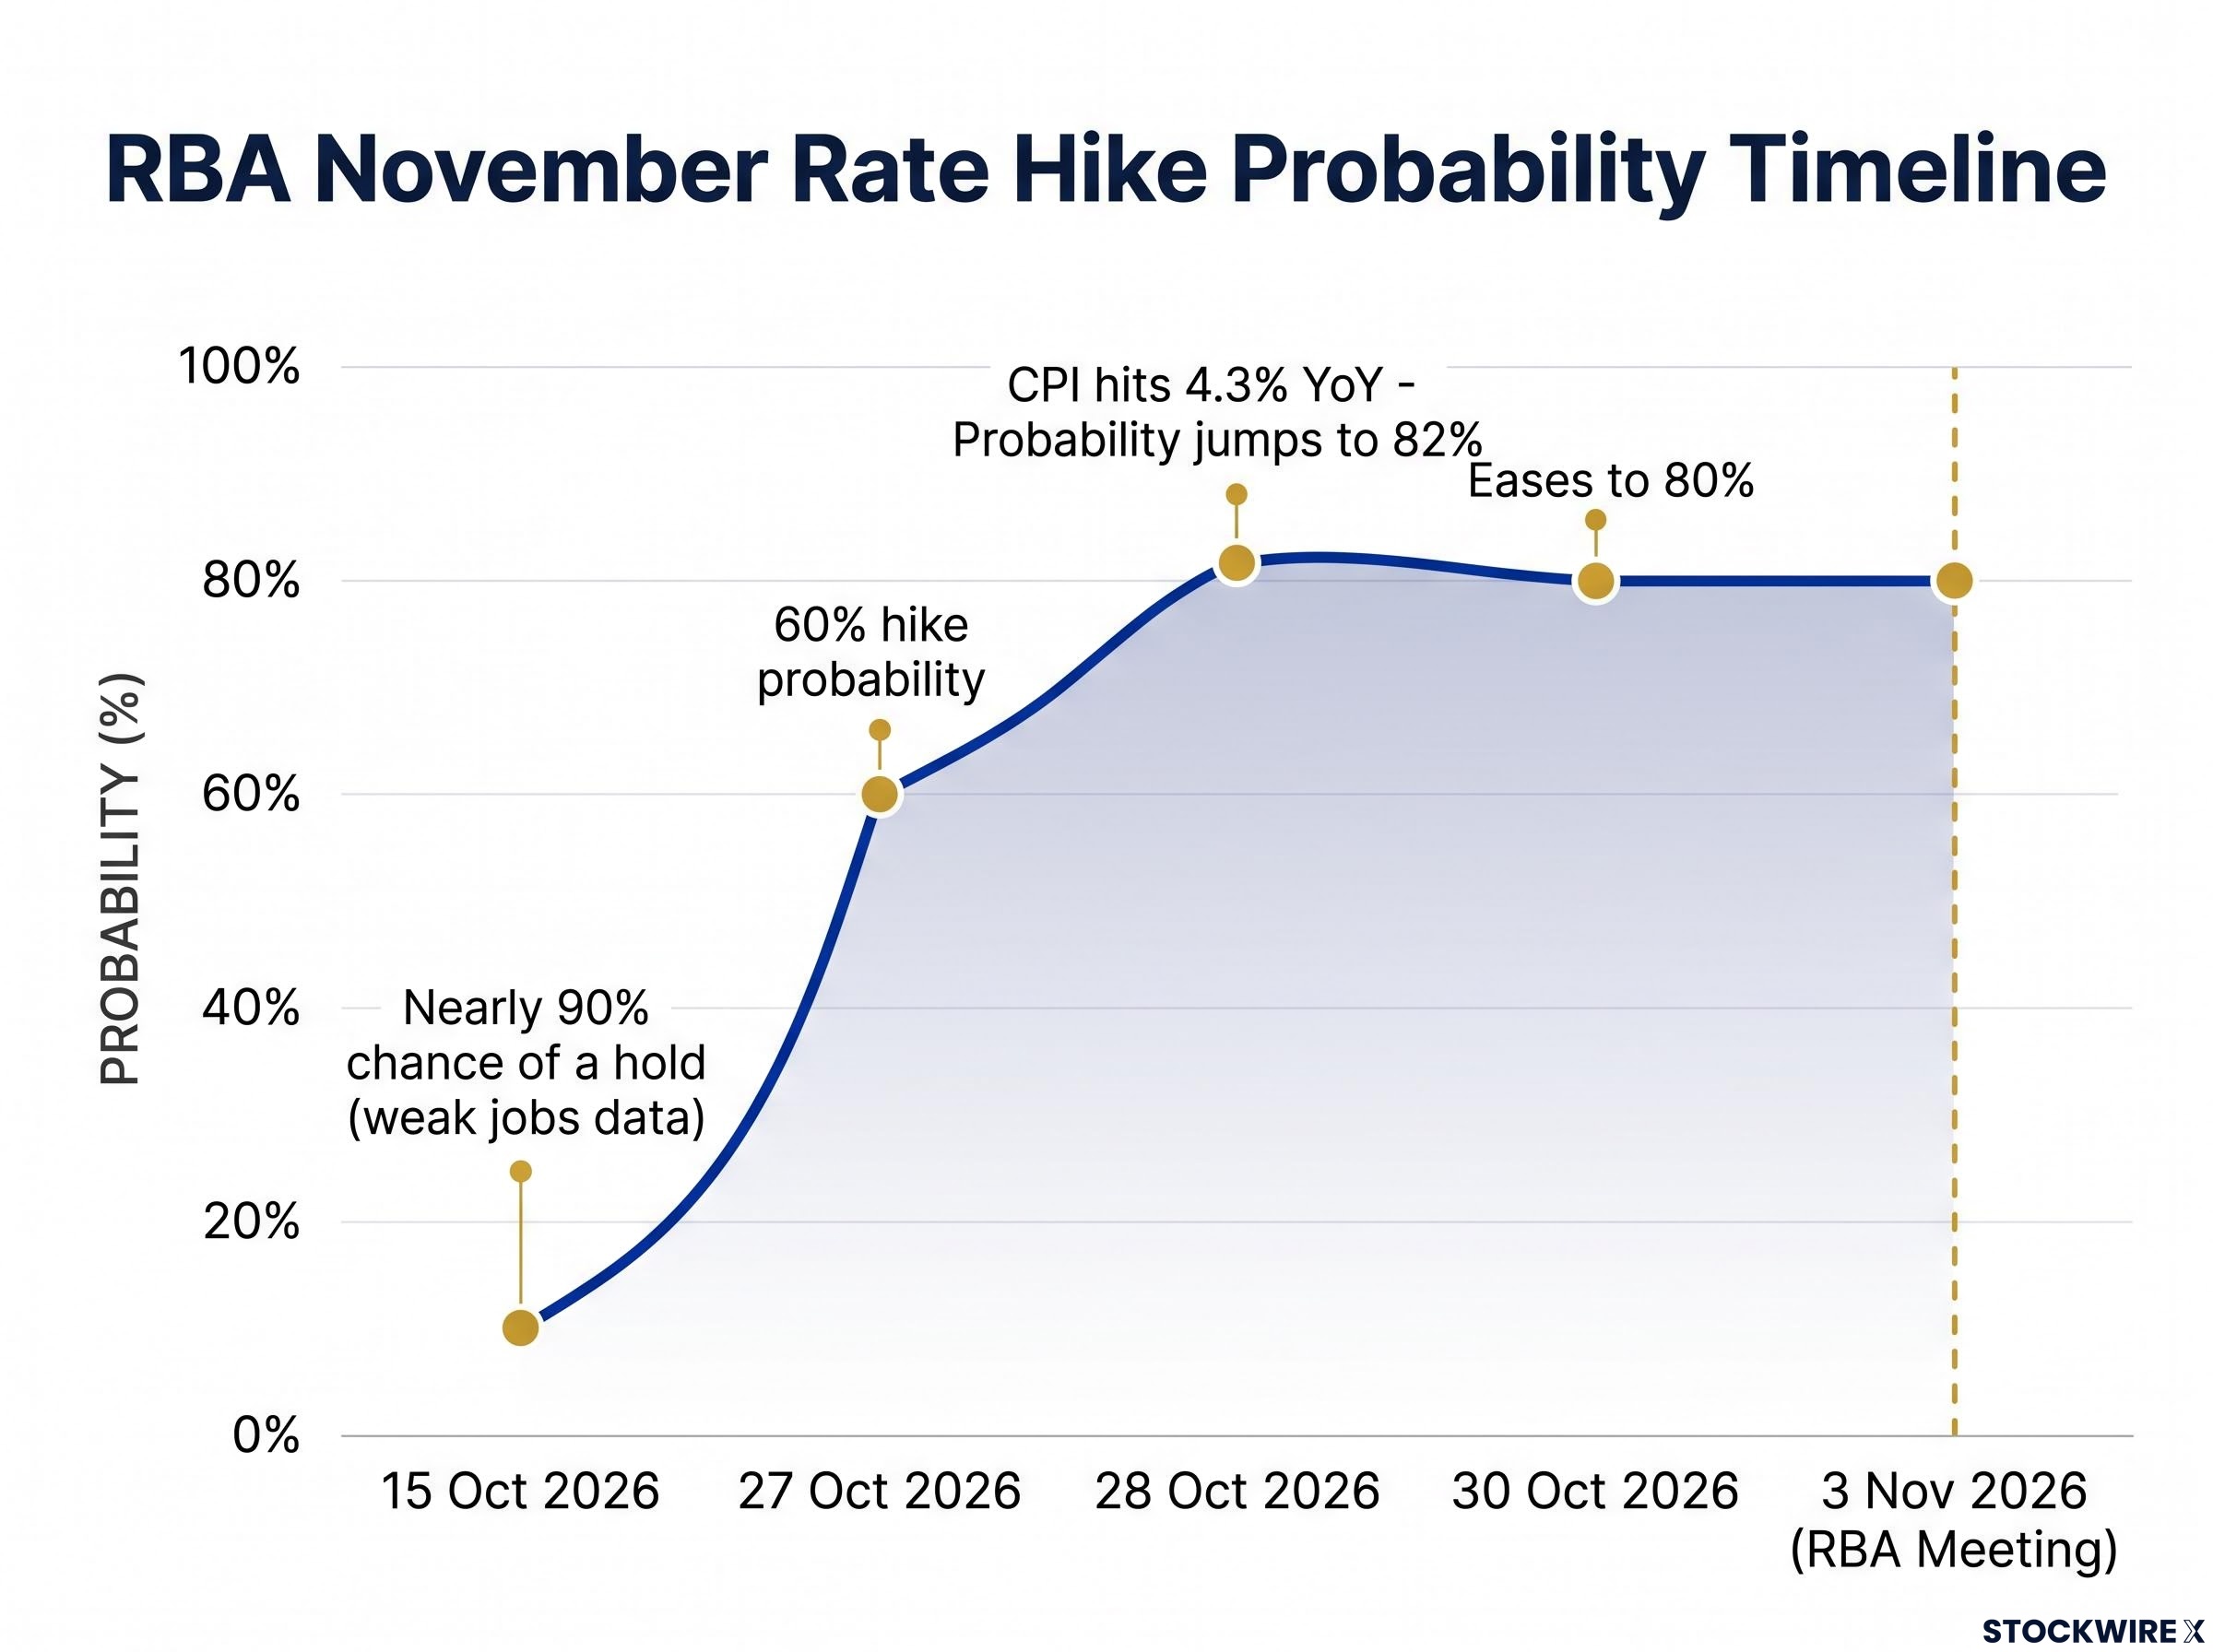
Most of the repricing has already happened. Even a delivered hike can fail to lift AUD/USD if markets expect:
- A short hiking cycle rather than a series of moves
- Weaker Australian growth
- Softer Chinese or commodity demand
- Weaker global equities
- A stronger US dollar
An 80% priced hike tells you the decision carries little news. Your attention belongs on what the RBA says about the next move.
When big ASX news breaks, our subscribers know first
Why are markets reluctant to price RBA hikes beyond November?
If the RBA is hiking for the second meeting running, it looks hawkish. Hawkish means leaning towards higher rates to fight inflation. So why won’t markets price a third move?
Du points out the contrast with other central banks globally, where markets are pricing further hikes. For the RBA, they are not, and that matches TD’s own view. The major Australian banks broadly agree that November looks like a response to an inflation overshoot rather than the opening of a long cycle.
| Institution | Date | Stance | Key reasoning |
|---|---|---|---|
| Westpac | 28-30 October 2026 | November hike justified; February a risk, not base case | Inflation above the RBA’s August forecasts; cost-of-living pressure and trend consumption |
| NAB | 29 October 2026 | Moved to a November hike call | Strong CPI; 4.85% would sit about 150 bp above its estimated neutral of roughly 3.4% |
| Commonwealth Bank | October 2026 | Expected a hold, November a live upside risk | Followed the September hike |
The RBA’s last move was a unanimous 25 bp hike to 4.60% at its 28-29 September 2026 meeting (Commonwealth Bank, 13 October 2026). NAB’s neutral rate estimate shows the scale involved. A neutral rate is the level that neither speeds up nor slows down the economy, so a rate 150 bp above it is already firmly restrictive.
Four constraints keep a lid on further pricing:
- Household debt: Australian mortgages are highly sensitive to rate rises.
- The inflation path: one more hike may be enough if inflation eases, and the RBA can stop.
- Global growth: a slowdown would hit exports and commodities, reducing the need to tighten.
- Restrictive policy: markets want proof of persistent inflation before pricing a run of hikes.
The result is that the AUD is missing the extra yield-path support that normally turns a hike into a rally. If you hold AUD exposure, RBA guidance matters more than the decision.
Forward guidance language from the Governor can shift terminal rate pricing on the futures curve without any change in the cash rate, which is why the press conference often matters more than the headline decision.
What does the 200-day SMA say about AUD/USD, and how could the US midterms change it?
Look at the AUD/USD chart and one line stands out. The pair has stayed beneath its 200-day simple moving average for about a month as global equity sentiment softened.
Reading the 200-day SMA
A 200-day simple moving average (SMA) is the average closing price over the past 200 trading days. Traders use it to judge the longer-term trend: price above it suggests strength, and price below it suggests weakness.
The line follows price; it does not drive it. Treat it as a confirmation tool, a way of checking whether a move has real support behind it.
On 15 October, AUD/USD sat at 0.6911 with the SMA near 0.7040 (FXStreet). By the 29 October assessment, the average was around 0.7060. A sustained close above that level would be needed to improve the near-term outlook.
The 3 November double event
The RBA is not the only catalyst on Tuesday. The US midterm elections land the same day (European Parliament Research Service, 9 October 2026).
The US dollar index (DXY), which tracks the dollar against a basket of major currencies, closed at 101.96 on 30 October (MarketWatch), with Bloomberg showing 101.8790. Du says a broad US dollar relief selloff after the midterms would make a break above the SMA more likely. The risk runs both ways.
| Scenario | USD reaction | AUD/USD implication | Technical consequence |
|---|---|---|---|
| Relief after the midterms | Broad selloff | Upside pressure | Break above 0.7060 more likely |
| Result read as supportive of US assets | Strengthens | Downside pressure | Spot stays below the SMA |
| Safe-haven demand rises | Strengthens | Downside pressure | Bearish bias preserved |
The signals that would weaken the bearish setup:
- A sustained close above 0.7060, not a brief intraday spike.
- A falling DXY alongside the move.
- Stronger risk sentiment in global equities.
For you, 0.7060 is a checkpoint. A close above it backed by a weaker dollar matters far more than a quick jump.
Has this happened before? Precedents for hikes that did and did not lift a currency
The pattern is not theory. You can see it in dated cases, including one from five weeks ago.
| Date | Currency | Reaction | Lesson |
|---|---|---|---|
| 29 September 2026 | AUD | RBA hiked 25 bp to 4.60%; AUD/USD rose, then fell below 0.7000 | About 90% priced; no commitment to more |
| 19 December 2025 | JPY | Yen buying faded after the Bank of Japan (BOJ) hike | Guidance not hawkish enough |
| 15 June 2022 | USD | Dollar index hit a new high, then fell about 0.5% | A large hike can still disappoint |
| 6 October 2009 | AUD | AUD/USD rose to about 0.8841, a 14-month high | Unpriced hikes can lift a currency |
September is the closest match. The hike was about 90% priced, and Governor Michele Bullock gave no clear commitment to another increase, so the early gain reversed.
FXStreet on the September RBA decision FXStreet described the AUD’s reaction to the September hike as “buy the rumour, sell the fact”.
The international cases point the same way. Reuters commentators applied similar language to the yen after the BOJ’s December 2025 hike. When the US Federal Reserve (Fed) delivered a widely expected 75 bp hike in June 2022, Joe Manimbo of Western Union described a sell-the-fact reaction after Chair Powell signalled such moves would not be routine (Reuters).
Then there is 2009. That RBA hike was not fully discounted, and the Australian dollar rallied hard.
This is why Du’s base case is not the only view. A hawkish surprise with explicit tightening guidance, stronger Chinese and commodity demand, or a broad US dollar selloff could each lift AUD further. Before any central bank event, ask what is still unpriced.
What to watch after 3 November: guidance, the dollar and the 0.7060 line
A November hike supports the Australian dollar only to the extent it changes expectations beyond the priced 25 bp. On evidence through 31 October 2026, that immediate push looks limited.
The upside catalysts are a hawkish RBA surprise or a broad US dollar selloff after the midterms. Soft global equities and a failure to clear about 0.7060 keep the bearish bias in place.
Whether the RBA keeps a tightening bias in its statement or steps back from it determines if residual hike risk stays alive, and that distinction drives positioning across the Australian dollar, equities and bonds.
Your checklist for Tuesday:
- RBA guidance on further hikes
- How the DXY reacts to the midterms
- Global equity sentiment
- Any sustained close above the 200-day SMA
TD’s view is one analyst’s reading, not a guarantee. Past performance does not guarantee future results, and projections are subject to market conditions. The decision point is what changes in expectations, not the hike itself.
This article is for informational purposes only and should not be considered financial advice. Investors should conduct their own research and consult with financial professionals before making investment decisions.