
CSL’s Dividend Yield Hits 4%: Value Signal or Value Trap?
54 mins ago

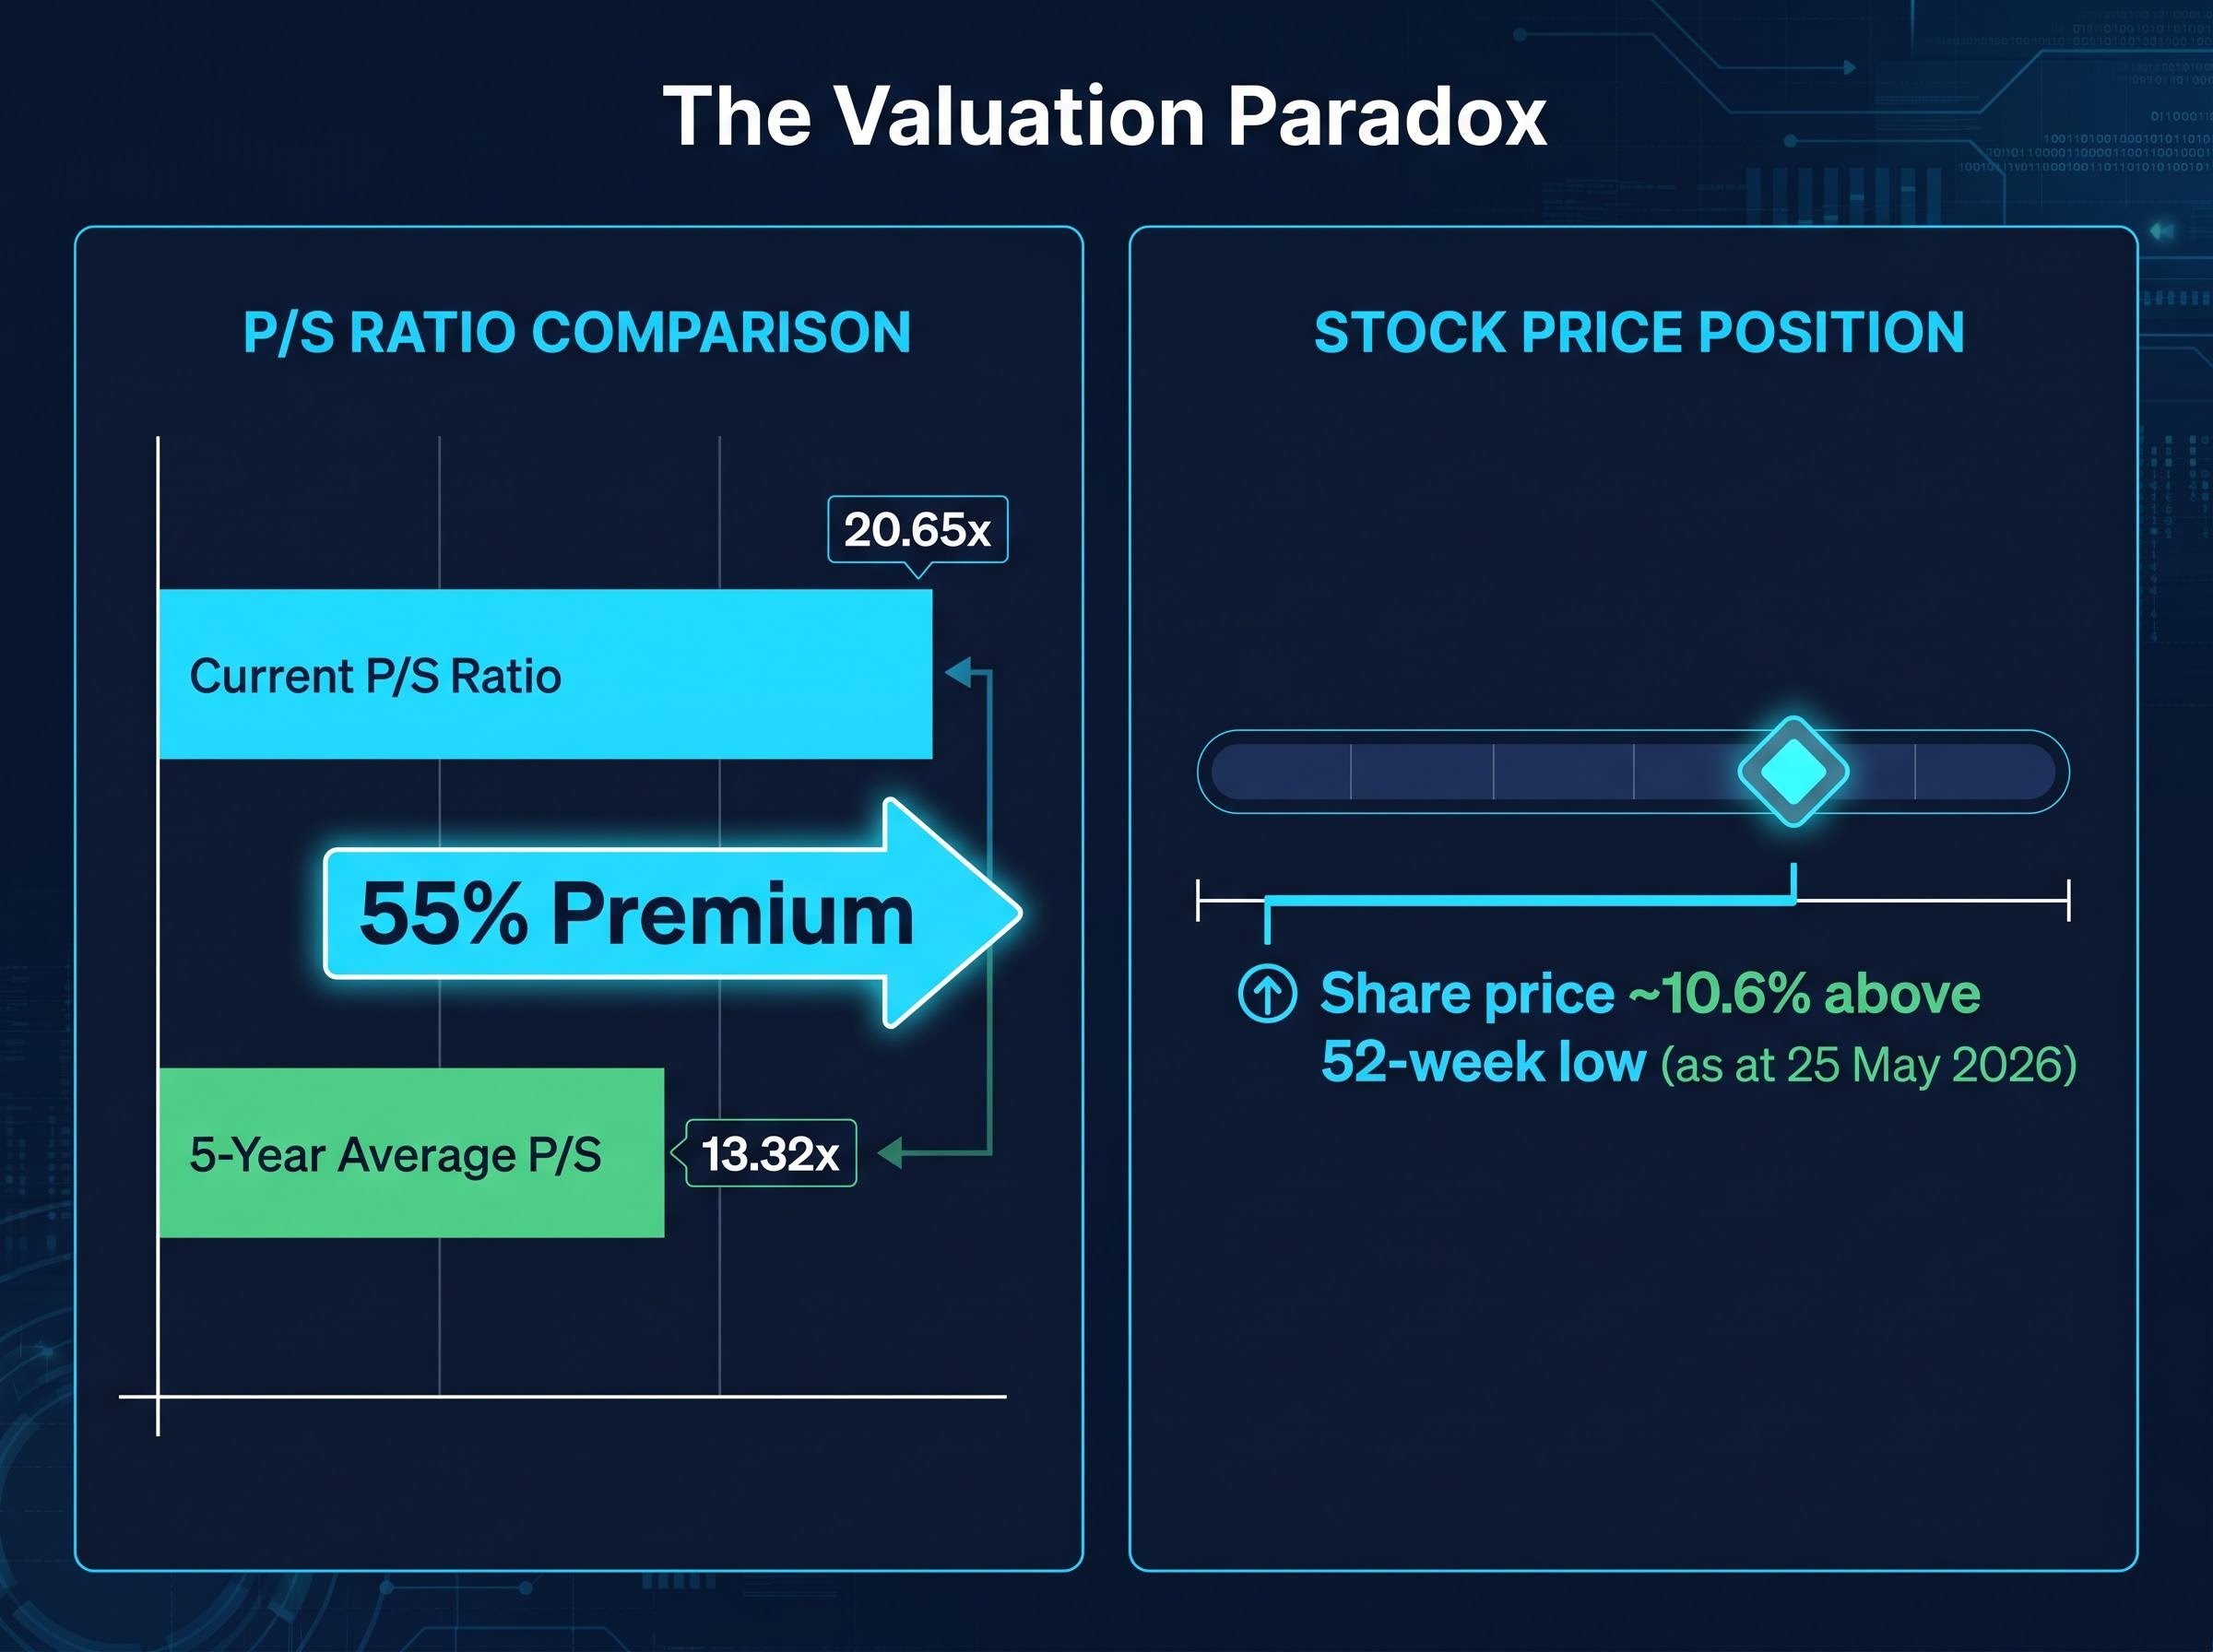
HUB24‘s price-to-sales ratio sits at 20.65x, roughly 55% above its five-year historical average of 13.32x. Yet the share price hovers only about 10.6% above its 52-week low. That gap between a stretched valuation multiple and a subdued share price is the analytical puzzle worth unpacking. For Australian investors evaluating ASX growth stocks, wealth management platforms like HUB24 occupy an unusual space: profitable, recurring-revenue businesses with genuine structural tailwinds that nonetheless carry multiples most value screens would reject outright. Understanding what drives that premium, and whether it holds up under scrutiny, matters more now that broad multiple re-rating across the market has stalled. This article walks through what HUB24’s current P/S ratio actually signals, what the business fundamentals and competitive moat contribute to the case, and how to frame valuation multiples as one input among several rather than a verdict in isolation.
ASX growth stock discounts and premiums do not exist in isolation from global repricing cycles; Morningstar data from March 2026 showed growth equities trading at a 21% discount to fair value, a level recorded less than 5% of the time since 2011, which provides context for why broad multiple re-rating across the market has stalled.
The number looks alarming on first pass. A 55% premium to a five-year average implies the market is paying materially more per dollar of revenue than it has at any sustained point in HUB24’s recent history, and that alone is enough to trigger a sell signal on most screening tools.
But a premium to historical average is a question, not an answer.
Price-to-sales ratio measures a simple relationship between two variables:
The ratio tells you how much the market is willing to pay for each dollar of revenue. P/S is often a more appropriate lens for growth companies than price-to-earnings, because earnings can be distorted by reinvestment, depreciation schedules, and one-off charges, while revenue captures top-line momentum more cleanly.
HUB24’s current P/S ratio of 20.65x compares with a five-year historical average of 13.32x, a premium of approximately 55%.
That premium could reflect a genuine re-rating of the business’s growth quality, a recognition by the market that HUB24’s revenue trajectory has structurally improved. Or it could reflect temporary overreach. The number alone cannot distinguish between those two readings. What follows is the analysis that can.
HUB24 operates three integrated products. The HUB24 platform provides investment administration and portfolio management for financial advisers and their clients. Class handles self-managed super fund (SMSF) administration. myprosperity delivers client-facing digital portals for personal wealth management. Together they form an ecosystem rather than three standalone offerings: advisers build workflows, compliance reporting, and client portals across all three, creating a unified technology stack for their practice.
That ecosystem structure matters for valuation. It means revenue is not earned from one-off transactions or project delivery. It is earned from ongoing platform fees tied directly to growing funds under administration (FUA) balances.
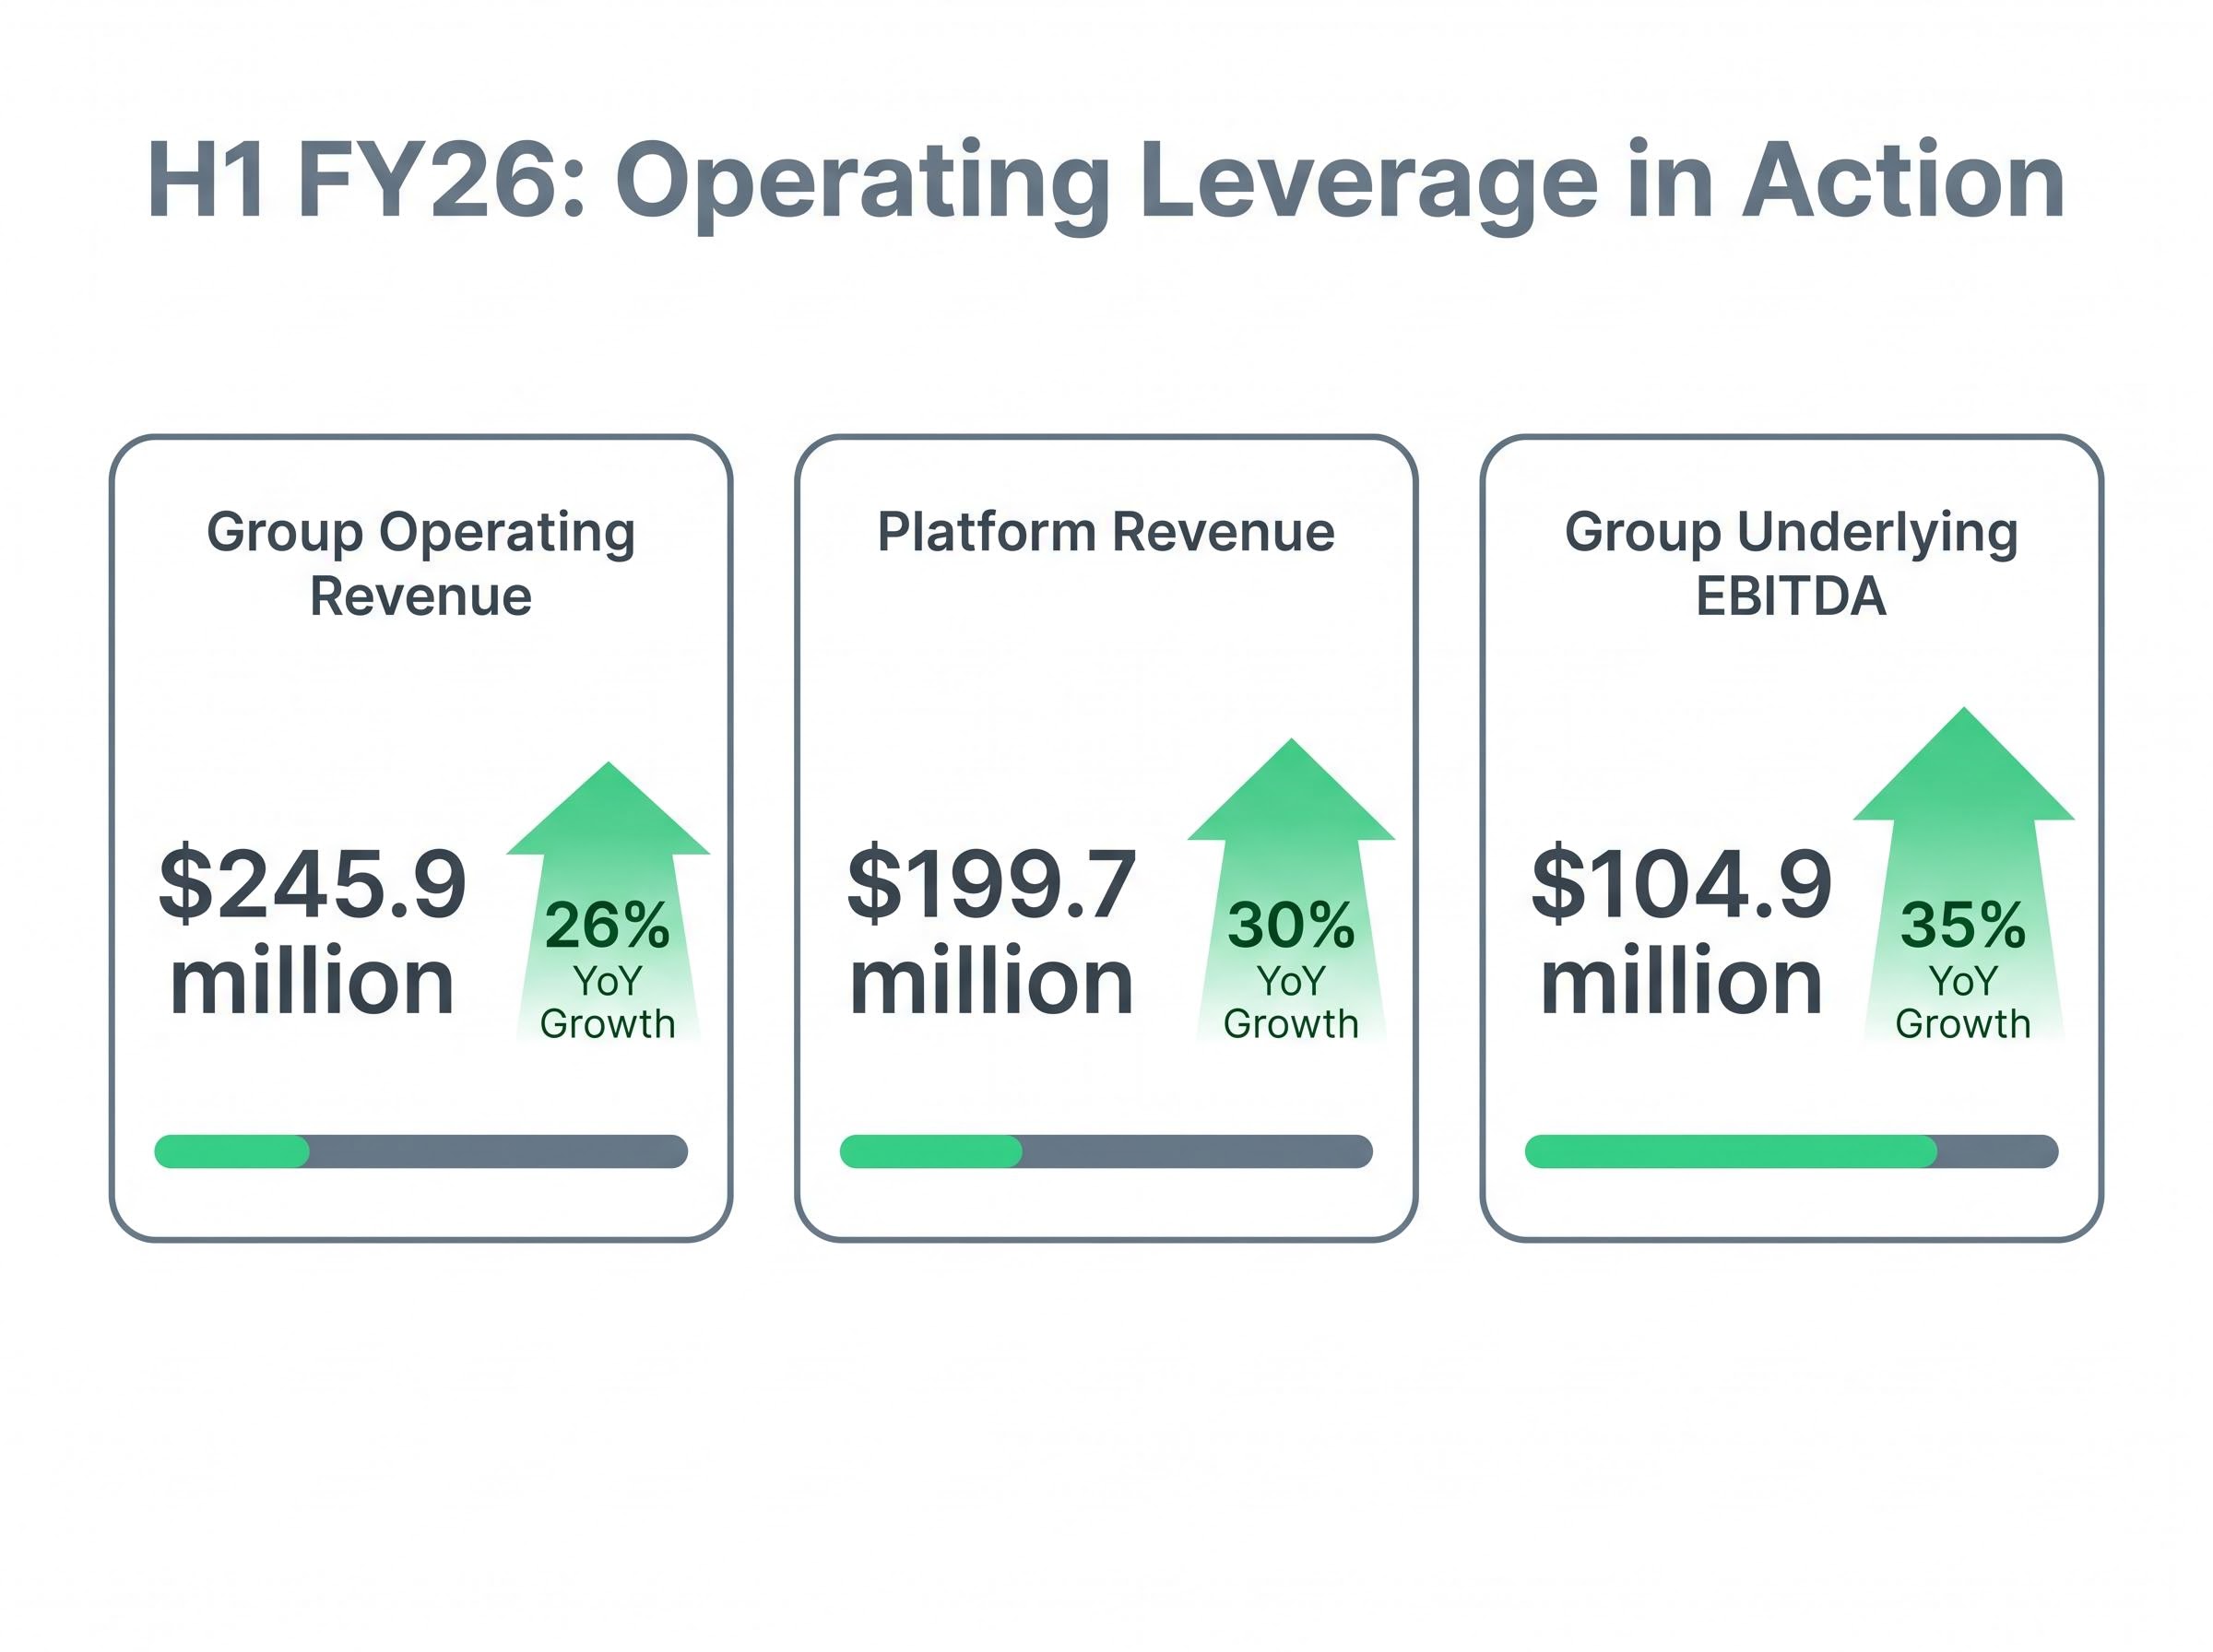
| Metric | H1 FY26 | Year-on-year growth |
|---|---|---|
| Group operating revenue | $245.9 million | 26% |
| Platform revenue | $199.7 million | 30% |
| Group underlying EBITDA | $104.9 million | 35% |
The table above contains a signal that matters more than any single line item: EBITDA grew at 35% while revenue grew at 26%. That gap is operating leverage in practice. As FUA grows, platform revenue grows proportionally, but the cost base does not scale at the same rate. Each additional dollar of FUA generates incremental revenue at a higher margin than the last.
This is why a 20.65x P/S multiple on a capital-light, recurring-revenue platform business cannot be compared directly to the same multiple on a company with project-based or inventory-dependent revenue. The revenue quality is structurally different. Platform FUA reached $127.8 billion as at 31 March 2026, providing the base from which that leverage compounds.
SaaS valuation benchmarks like the Rule of 40, which combines a company’s revenue growth rate with its profit margin into a single score, help contextualise why capital-light, recurring-revenue platforms command materially higher revenue multiples than businesses with project-based or inventory-dependent revenue structures.
A premium multiple demands a premium franchise. The evidence for HUB24’s competitive moat is specific and measurable rather than asserted.
HUB24 was named Overall Best Platform in the Adviser Ratings 2024 Financial Advice Landscape Report. It achieved strong rankings for Overall Satisfaction and Brand Image in the Wealth Insights 2024 Platform Service Level Report. Morningstar assigns the company a narrow moat rating, meaning it identifies structural competitive advantages that are expected to persist for at least a decade, though not indefinitely.
The moat expresses itself in inflow numbers. In Q2 FY26 (October to December 2025), HUB24 reported record net inflows of $5.6 billion. Q3 FY26 net inflows were $4.0 billion, up 9% on the prior corresponding period excluding large migrations. Platform FUA grew 25% year-on-year as at 31 March 2026.
Q2 FY26 delivered record net inflows of $5.6 billion, the strongest quarter in HUB24’s history.
The switching-cost dynamic strengthens the picture. Advisers who build compliance workflows, data feeds, client portals, and reporting across HUB24’s integrated ecosystem face real friction in migrating to a competitor. That friction underpins the recurring-revenue assumption that supports the multiple.
Key moat indicators in summary:
Much of HUB24’s trajectory is being carried by forces larger than any single platform. Three structural tailwinds, ordered by magnitude, underpin the growth runway:
The mechanism is specific. Reduced documentation requirements lower the cost of delivering advice. Technology-enabled advice provisions allow broader institutional provision of simple financial guidance. Both expand the pool of FUA that could flow through modern platforms. For HUB24, which has invested heavily in integrated workflow tools, compliance reporting, and digital client portals, the reforms are positioned to benefit platforms with scalable infrastructure already in place.
The Australian Treasury’s Quality of Advice Review response confirms that the Delivering Better Financial Outcomes package targets reduced documentation requirements and expanded technology-enabled advice delivery, changes that structurally increase the pool of FUA flowing through modern platforms with scalable compliance infrastructure already in place.
The preceding sections built the case for a premium. Intellectual honesty requires equal attention to the conditions under which that premium unravels.
Higher interest rates structurally compress valuations for long-duration growth stocks. The mechanism is straightforward: when rates rise, the discount rate applied to future earnings increases, reducing the present value of the earnings stream that justifies a high multiple today. HUB24 is a profitable compounder, not a loss-making speculative name, but it is not immune to this force.
Morningstar has warned that further multiple expansion is less likely in a higher-rate environment and that investors should be cautious about extrapolating past years’ re-rating.
The AFR has separately flagged that any meaningful slowdown in net inflows could trigger a sharp de-rating, given how much of the valuation rests on sustained growth assumptions.
Multiple compression risk is particularly acute for platform businesses because broker consensus buy ratings tend to lag the price action, meaning the technical warning signals often appear months before analysts revise their targets downward, as occurred across ASX SaaS stocks during the September to December 2025 sell-off.
Q3 FY26 provided a taste of what market headwinds look like in practice. Negative market movements of $4.1 billion offset the quarter’s $4.0 billion in net inflows, leaving platform FUA broadly stable quarter-on-quarter despite strong organic activity. The share price sitting approximately 10.6% above its 52-week low (as at 25 May 2026) is a further signal that the market is not uniformly bullish.
Key risk factors:
Past performance does not guarantee future results. Financial projections are subject to market conditions and various risk factors.
The P/S ratio is a screening tool, not a verdict. It identifies whether a stock deserves closer scrutiny. It does not tell an investor whether to buy or sell.
A four-metric valuation framework covering revenue trajectory, profit expansion trend, return on equity direction, and operating leverage provides a more structured lens for platform businesses where trailing price-to-earnings ratios are distorted by reinvestment cycles and depreciation schedules.
The analytical framework that emerges from broker and industry commentary suggests a three-step approach for platform businesses carrying elevated multiples:
Net inflow trajectory reveals demand momentum. Operating leverage (EBITDA growing faster than revenue) reveals margin expansion. FUA growth rate reveals compounding scale. Together, these three signals make a P/S multiple legible rather than abstract.
As Stockhead’s sector analysis noted, not all high P/S multiples are created equal: profitable compounders with recurring revenue and dominant market positions sit in a fundamentally different category to loss-making growth names trading on future promise alone. The five-year average of 13.32x serves as a relative benchmark for HUB24’s own history, not an intrinsic value anchor.
For investors seeking to move beyond screening, discounted cash flow or dividend discount model analysis represents the logical next step in building a full valuation view.
HUB24’s 55% premium to its historical P/S average reflects genuine business quality: recurring, fee-based revenue growing at 30% year-on-year, EBITDA margins expanding through operating leverage, a measurable competitive moat in adviser satisfaction and switching costs, and structural industry tailwinds with years still to run. This is not speculative froth applied to a loss-making concept.
The premium is conditional, however, not permanent. It holds as long as net inflows remain strong, operating leverage continues to materialise, and legacy FUA migration persists. A sustained slowdown in any of these would challenge the growth assumptions the multiple encodes.
Investors evaluating HUB24 or comparable growth stocks on the ASX are not simply buying today’s revenue multiple. They are making a judgement about how long the growth runway extends and whether the competitive moat will hold across that runway. The P/S ratio frames the question. The analysis above provides a structure for answering it.
This article is for informational purposes only and should not be considered financial advice. Investors should conduct their own research and consult with financial professionals before making investment decisions.
A price-to-sales ratio measures how much the market pays for each dollar of a company's revenue. It is commonly used for growth stocks because earnings can be distorted by reinvestment and depreciation, while revenue captures top-line momentum more cleanly.
HUB24's current P/S ratio of 20.65x sits roughly 55% above its five-year historical average of 13.32x, reflecting the market's recognition of its recurring, fee-based revenue model, strong operating leverage, and structural industry tailwinds including ongoing legacy FUA migration to independent platforms.
Funds under administration (FUA) is the total value of client assets managed on a platform, and it is the primary driver of revenue for businesses like HUB24 because platform fees are directly tied to FUA balances. HUB24's platform FUA reached $127.8 billion as at 31 March 2026, growing 25% year-on-year.
The key risks include rate sensitivity compressing the present value of future earnings, a slowdown in net inflows triggering a sharp de-rating, and market volatility offsetting organic FUA growth, as seen in Q3 FY26 when negative market movements of $4.1 billion offset the quarter's $4.0 billion in net inflows.
The P/S ratio is best used as a screening tool rather than a verdict; investors should complement it by monitoring net inflow trajectory, operating leverage (EBITDA growing faster than revenue), and FUA growth rate, which together reveal whether the growth assumptions embedded in a high multiple are holding up.