Lululemon Plunges 12% on CEO Pick Amid Activist Investor Battle
2 hrs ago

Glanbia PLC handed investors one of the cleanest earnings beats in recent Irish corporate history on 29 April 2026. The company’s Q1 2026 Interim Management Statement revealed like-for-like revenue growth of 7.2% against analyst consensus of 4.6%, volume expansion of 8.2% versus expectations of 2.5%, and outperformance across both operating segments. GL9 shares responded by climbing 8.6% in a single session. The results arrived against a backdrop of whey protein input costs that have surged 50-110% compared to 2024 levels, making the scale of the demand-side beat more striking. What follows breaks down exactly where the outperformance originated, what Glanbia’s upgraded guidance signals about the remainder of fiscal 2026, and the one cost pressure investors should keep watching.
The market delivered its verdict before the detail could be fully digested. GL9 shares rose 8.6% on Wednesday, 29 April 2026, the trading day Glanbia released its Q1 2026 Interim Management Statement, marking one of the largest single-session moves the stock has recorded in recent quarters.
GL9 shares climbed 8.6% on 29 April 2026, the trading day Glanbia released its Q1 2026 Interim Management Statement.
The size of the reaction maps directly to the size of the miss in analyst models. Three metrics tell the story:
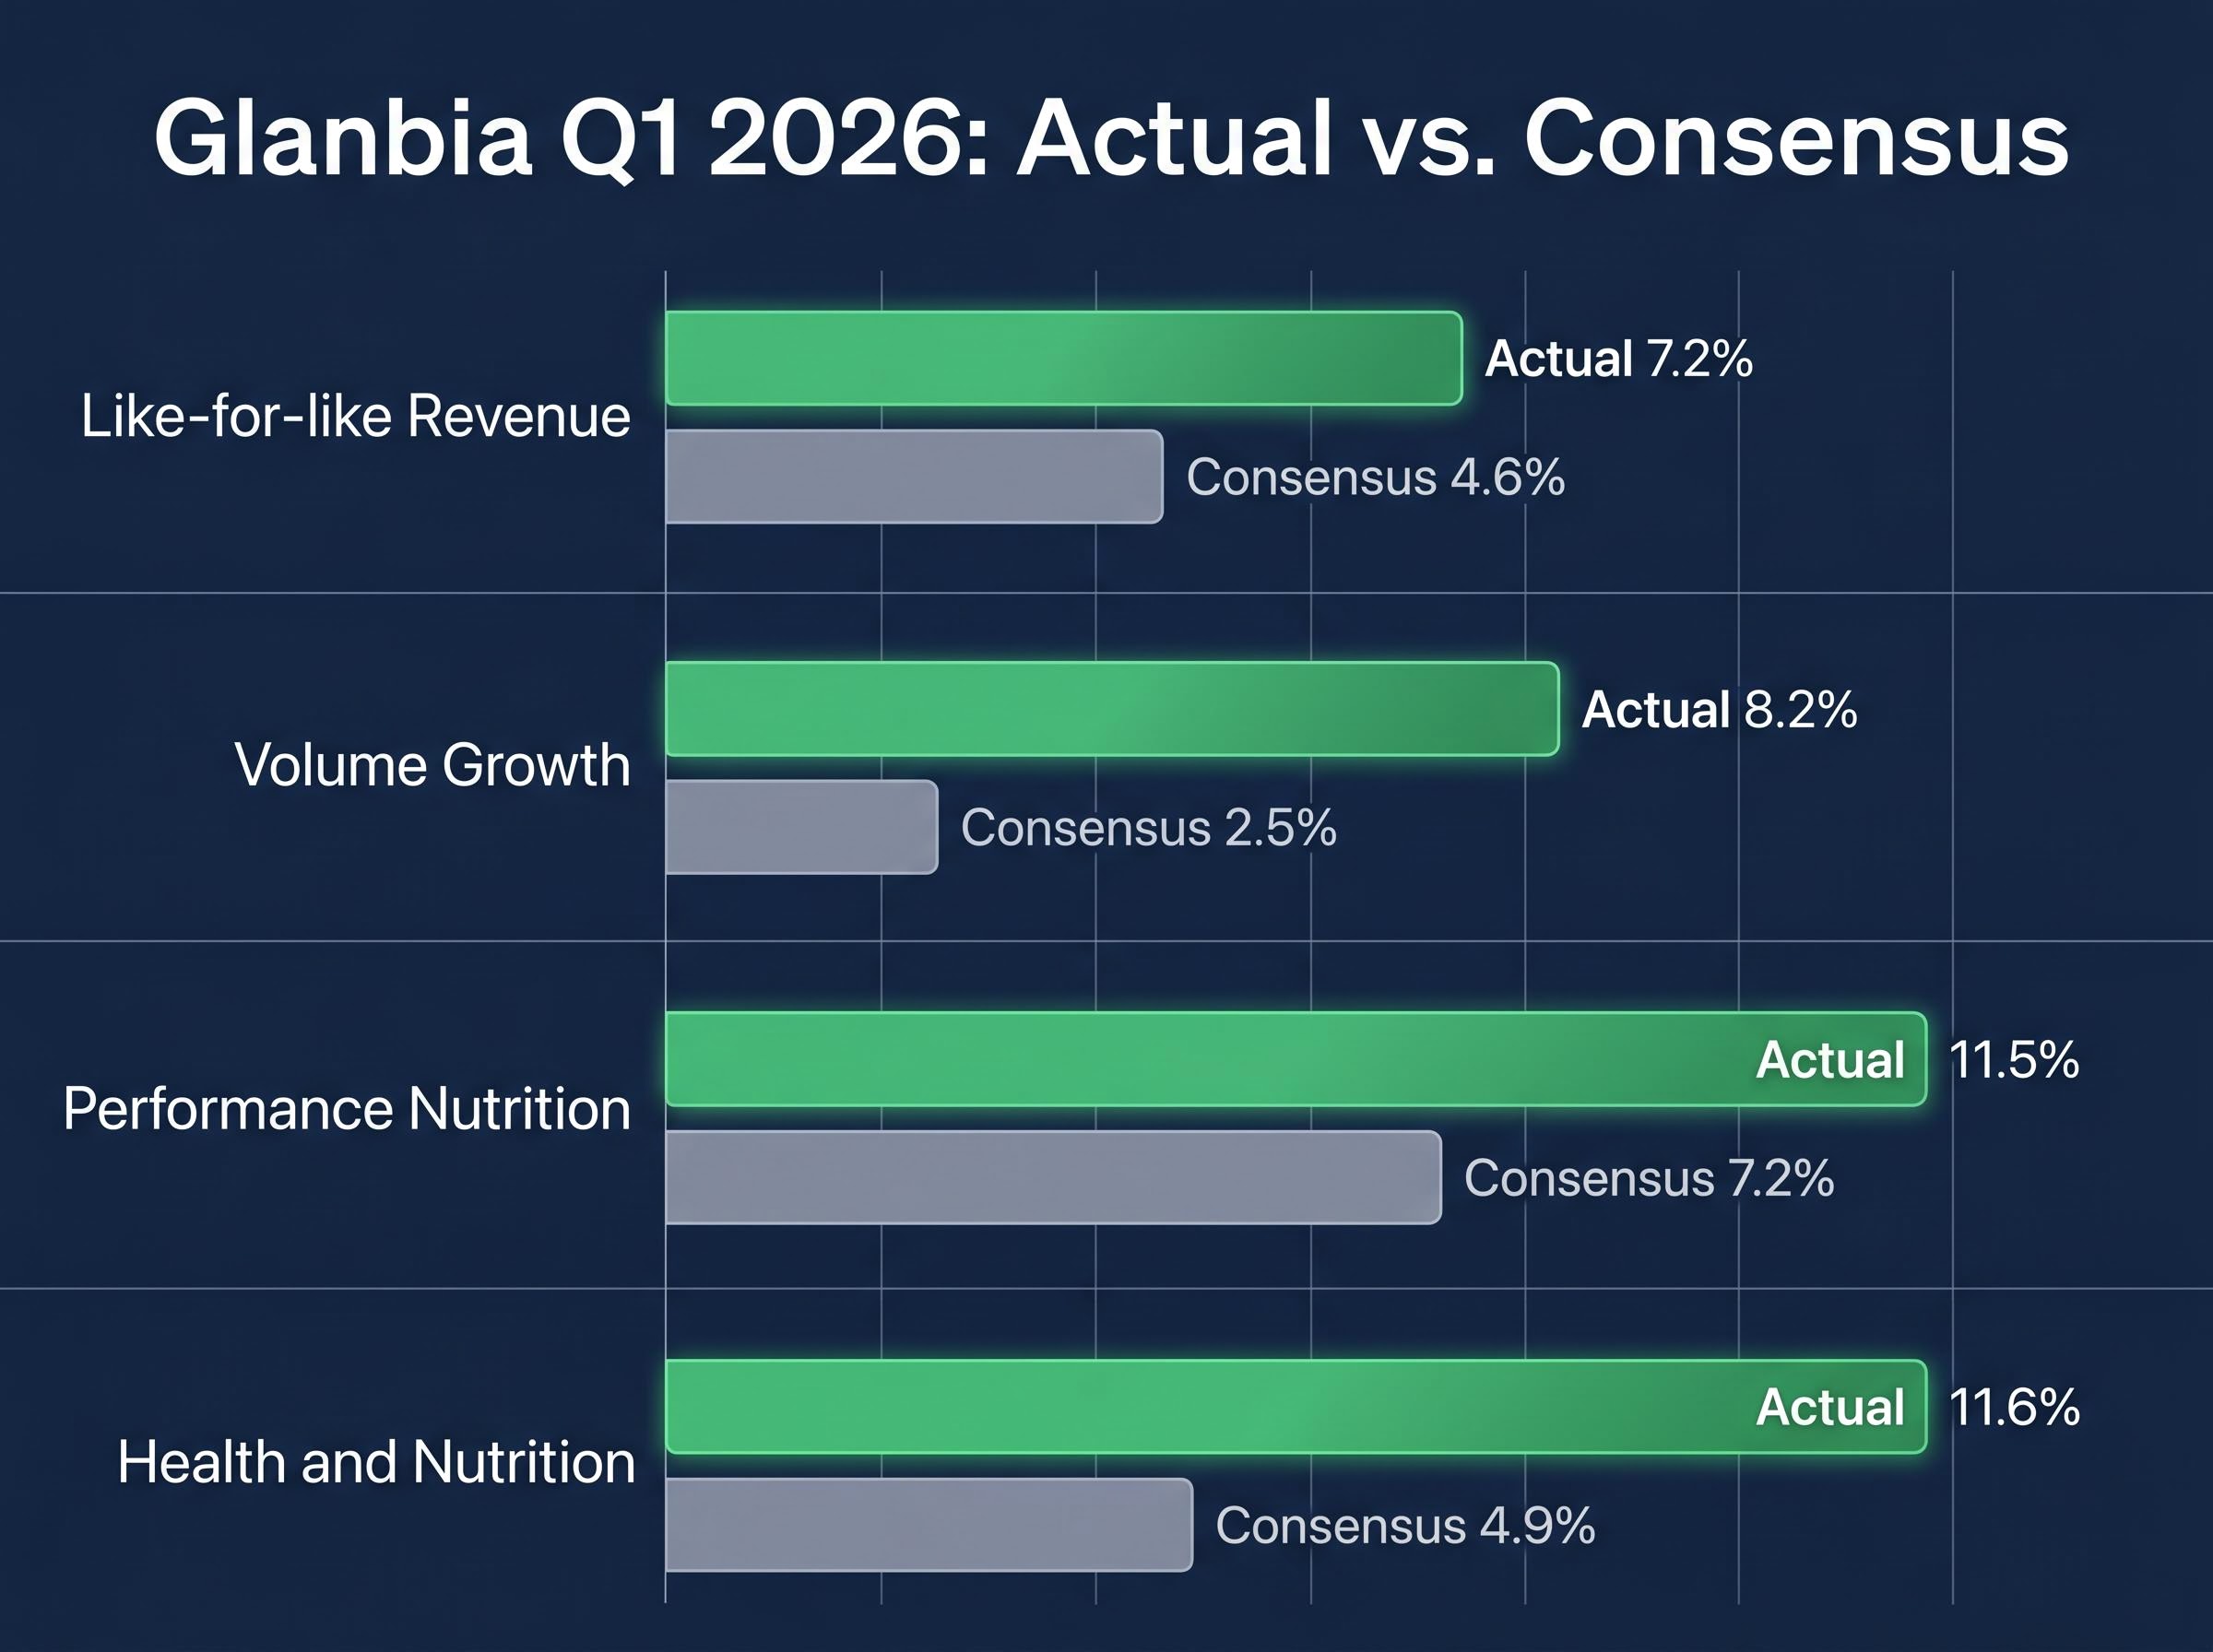
Volume is the figure that stands out. At more than three times the consensus estimate, it signals that the beat was not engineered through pricing alone. Consumer demand for Glanbia’s products accelerated well beyond what the sell-side had modelled, a distinction that carries different implications for the durability of Q1 momentum than a margin-driven surprise would.
Both of Glanbia’s reporting segments independently cleared their respective consensus estimates, and neither was close to the line.
The Performance Nutrition division posted like-for-like growth of 11.5% in Q1, against a consensus forecast of 7.2%. The Health and Nutrition segment delivered 11.6%, more than double the 4.9% analysts had projected. Proportionally, the Health and Nutrition beat was the wider of the two.
| Segment | Q1 2026 Actual LFL Growth | Analyst Consensus |
|---|---|---|
| Performance Nutrition | 11.5% | 7.2% |
| Health and Nutrition | 11.6% | 4.9% |
Within Performance Nutrition, the brand-level detail sharpens the picture:
The fact that international markets showed the strongest growth reduces concentration risk. The Q1 beat was not the product of a single geography or a single product line recovering from a weak prior-year comparison. It was multi-source, and that breadth is directly relevant to investors assessing whether momentum can persist through the year.
International health supplement distribution agreements have increasingly structured around milestone commitments and exclusivity termination clauses, reflecting how brand owners are managing channel risk as they expand into markets where shelf presence and logistics partners are less predictable than in mature domestic channels.
Like-for-like (LFL) revenue growth strips out the effects of acquisitions, disposals, and foreign exchange movements. What remains is the organic trading performance of the underlying business: how much more product it sold, and at what price, compared to the same period a year earlier.
This distinction matters because it is the metric analysts use when setting consensus estimates. A company can report headline revenue growth that looks impressive but is inflated by a recent acquisition or a favourable currency swing. LFL removes that noise. When Glanbia reports a 7.2% LFL figure and the consensus was 4.6%, both numbers are measured on the same organic basis, making the gap a genuine operational surprise rather than an accounting artefact.
Like-for-like sales metrics have become the primary lens through which consumer-facing businesses are evaluated across retail and nutrition categories alike, with analysts treating volume composition — whether promotional, loyalty-driven, or organic demand — as the key variable separating durable growth from one-cycle beats.
Glanbia’s 7.2% LFL growth compares favourably against the North American sports nutrition sector’s projected compound annual growth rate (CAGR) of 8.44% and the global sports nutrition market’s 7.12% CAGR, with the latter on track to reach $76.22 billion by 2031 according to Kings Research. Against both benchmarks, Glanbia is growing broadly in line with or ahead of its sector.
The Mordor Intelligence sports nutrition forecast projects global market revenues reaching $76.22 billion by 2031 at a 7.12% CAGR, a trajectory that positions Glanbia’s Q1 organic growth rate as broadly in line with, and in some segments ahead of, the underlying sector expansion.
A Q1 beat of this scale made a guidance revision the logical next step, and management delivered one across three metrics.
Management narrowed its fiscal 2026 adjusted EPS growth outlook to the upper end of the 7-11% range, above Bloomberg consensus of approximately 8%.
The implied midpoint now sits at approximately 9%, a full percentage point above where the street had been modelling. The three revisions, taken together, build a consistent picture:
When management’s own midpoint clears the street’s prior estimate, it compresses the likelihood of a downside guidance revision later in the year, absent a material deterioration. For investors using analyst estimates as a performance benchmark, the signal is directly positive: the company is not just reaffirming its outlook but upgrading its ambition for fiscal 2026.
The Q1 numbers were strong. The one significant qualifier sits in the cost base.
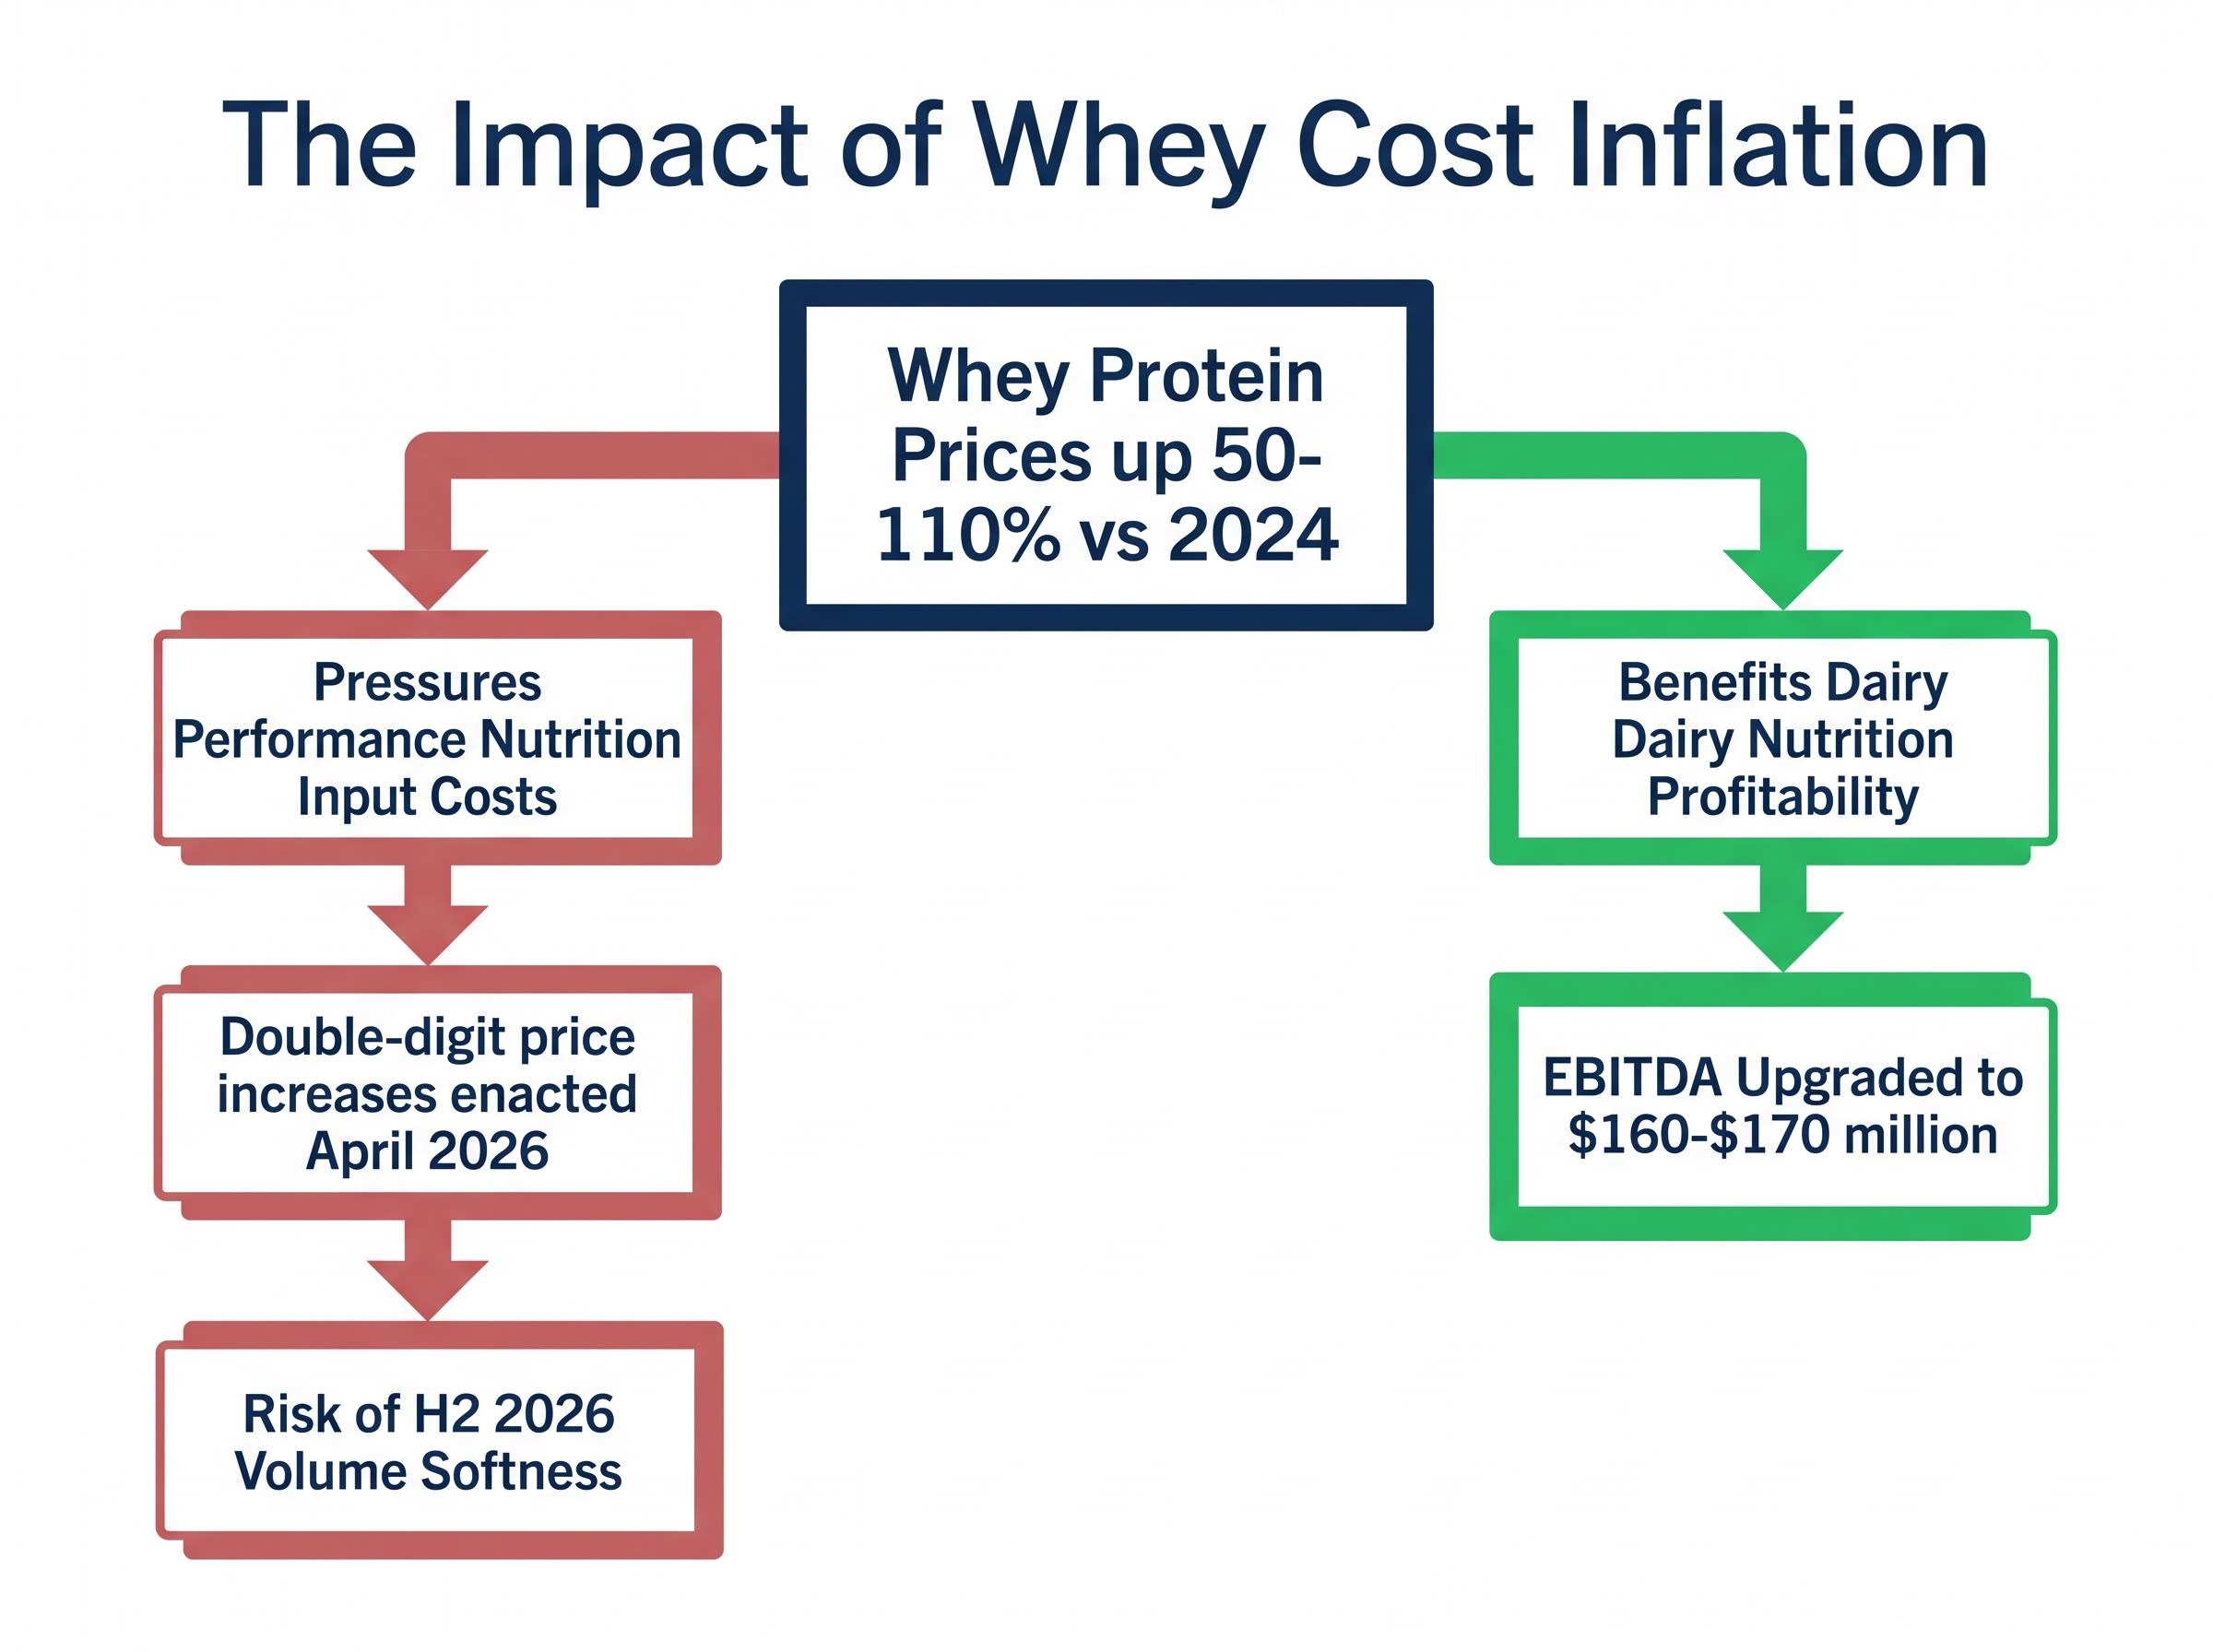
Whey protein prices have risen 50-110% compared to 2024 levels, prompting Glanbia to enact double-digit price increases in April 2026.
Management did not treat this as a background detail. The company explicitly flagged the expectation of some volume softness in the remainder of fiscal 2026 as consumers absorb higher shelf prices. This is a known and managed risk, not a surprise; the fact that Glanbia raised guidance despite acknowledging it is itself a confidence signal about how management views the demand elasticity.
The whey inflation picture is also more nuanced than a single headwind. The Dairy Nutrition EBITDA upgrade to $160-$170 million was partly driven by higher whey pricing flowing through that segment’s margins. For Glanbia, whey cost inflation creates a mixed picture: it pressures Performance Nutrition input costs while simultaneously benefiting Dairy Nutrition profitability.
The same whey protein pricing dynamics that pressured Glanbia’s Performance Nutrition input costs are flowing in the opposite direction through dairy processors closer to the farm gate, with producers capturing margin from elevated commodity prices that consumers ultimately absorb at the shelf.
The market’s current read leans toward optimism. GL9 shares are up 22.49% year-to-date as of 29 April 2026, and the analyst consensus stands at Buy, with 7 of 10 analysts surveyed holding that rating. The growth story, for now, is being weighted above the cost risk.
Glanbia’s Q1 2026 result combined three elements: a volume-led beat across both operating segments, a guidance upgrade that cleared Bloomberg consensus, and one monitored risk in whey cost inflation that management has already priced into its revised outlook. The single most telling number from the quarter remains the volume figure: 8.2% actual versus 2.5% expected, a gap that points to genuine demand acceleration rather than pricing arithmetic.
The next milestone is Glanbia’s half-year results, where management’s prediction of H2 volume softness will either materialise or prove overly cautious. That report will determine whether Q1 was the peak of momentum or the start of a broader re-rating year.
This article is for informational purposes only and should not be considered financial advice. Investors should conduct their own research and consult with financial professionals before making investment decisions.
Glanbia reported like-for-like revenue growth of 7.2% against analyst consensus of 4.6%, and volume growth of 8.2% against expectations of 2.5%, with both operating segments independently beating their respective forecasts.
GL9 shares jumped 8.6% in a single session after Glanbia's Q1 2026 Interim Management Statement revealed a volume-led earnings beat that was significantly larger than the sell-side had modelled, with volume growth coming in at more than three times consensus expectations.
Management narrowed its fiscal 2026 adjusted EPS growth outlook to the upper end of the 7-11% range, implying a midpoint of approximately 9%, which sits above the prior Bloomberg consensus estimate of approximately 8%.
Whey protein prices have risen 50-110% compared to 2024 levels, prompting double-digit price increases in April 2026 and creating a risk of some volume softness in the second half of fiscal 2026, while simultaneously boosting Dairy Nutrition segment margins, producing a mixed but managed impact across the business.
Like-for-like (LFL) revenue growth strips out the effects of acquisitions, disposals, and foreign exchange movements to show the organic trading performance of the underlying business, making it the cleanest measure of whether Glanbia is genuinely selling more product at better prices compared to the same period a year earlier.