Stagflation Risk or Soft Patch: Reading the US Economy in 2026
5 mins ago


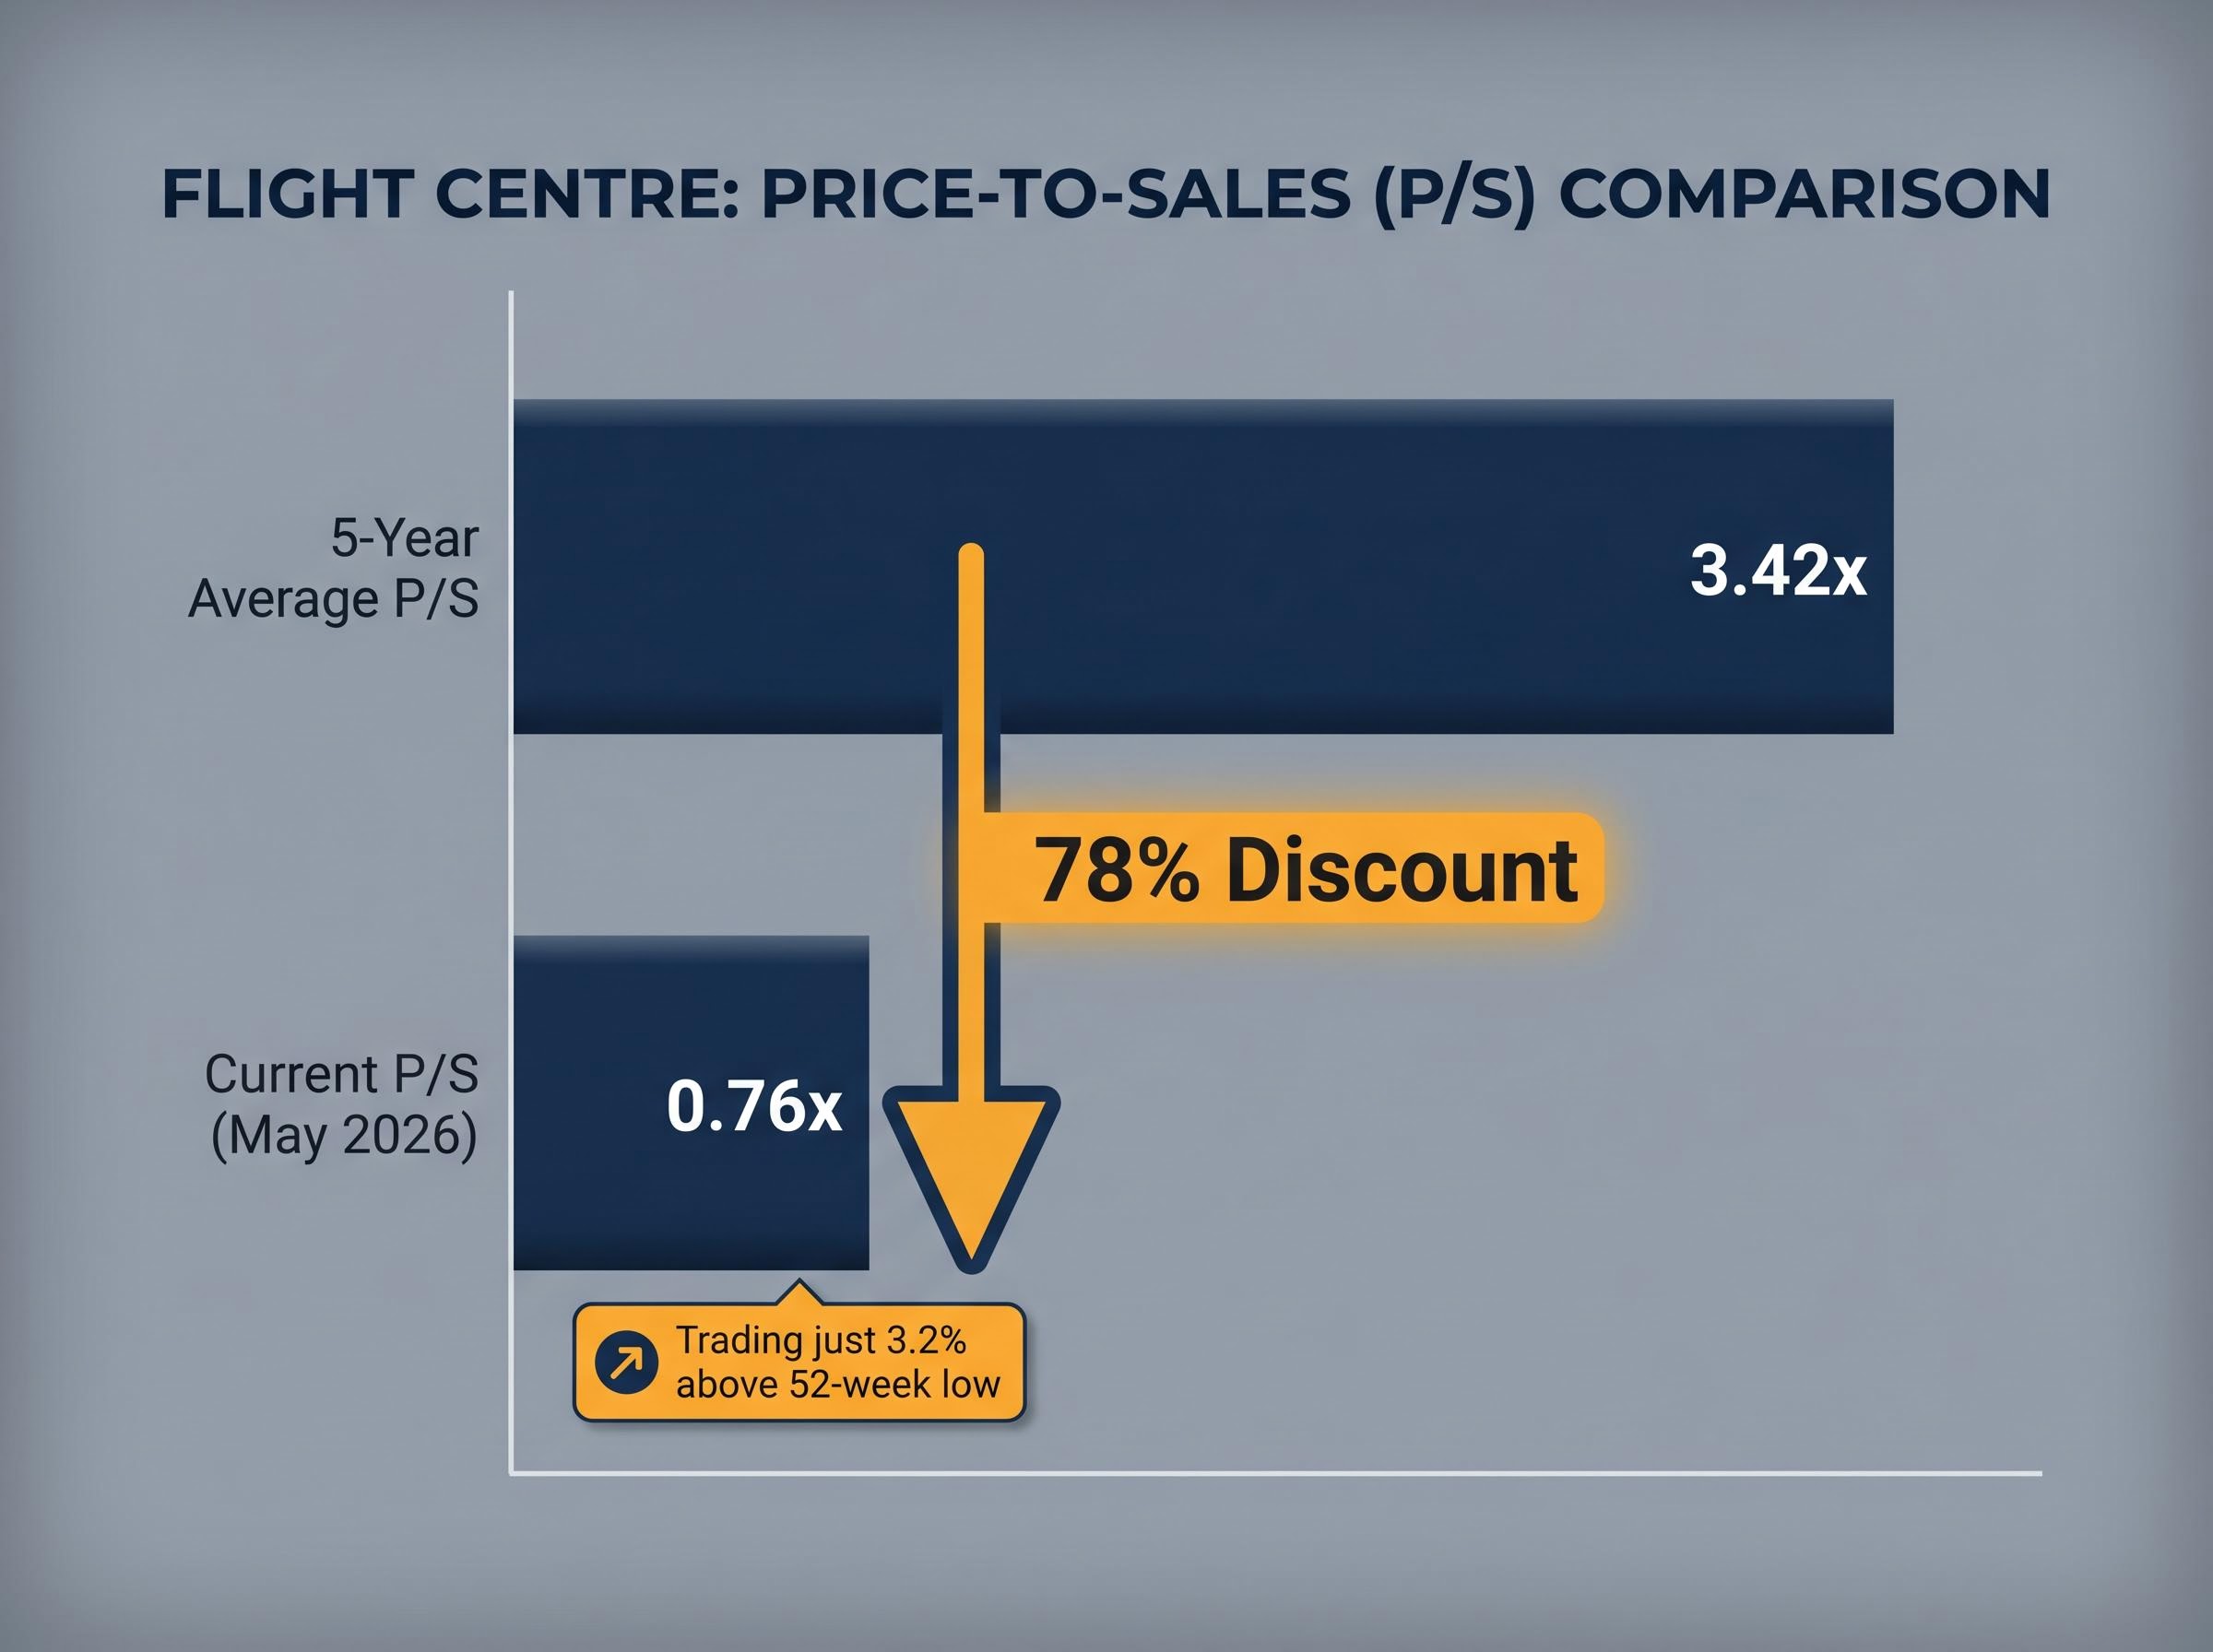
Flight Centre shares are trading at a price-to-sales (P/S) ratio of 0.76x against a five-year historical average of 3.42x, sitting just 3.2% above their 52-week low. On the surface, that looks like a deeply discounted business in a recovering travel market. Australian tourism GDP reached $81.1 billion in 2024-25, according to the Australian Bureau of Statistics (ABS), and the World Travel & Tourism Council (WTTC) forecasts the sector will contribute $314.4 billion to the economy in 2025. Against that backdrop, the gap between Flight Centre’s current valuation and its historical norm raises a legitimate question: is the market mispricing a recovery story, or is the discount communicating something more complicated? This analysis unpacks why price-to-sales is the appropriate lens for a company with Flight Centre’s profile, what a discount of this magnitude can and cannot signal, and why ratio analysis alone is an incomplete basis for any investment decision on this stock.
The arithmetic is stark. Flight Centre’s current P/S ratio of 0.76x sits roughly 78% below its five-year historical average of 3.42x. For every dollar of revenue the business generates, the market is paying less than a quarter of what it averaged over the past half-decade.
P/S comparison: Flight Centre trades at 0.76x price-to-sales, against a five-year average of 3.42x.
The 52-week low proximity reinforces the signal rather than introducing it. At just 3.2% above that floor as of late May 2026, the stock has barely lifted from its lowest point of the past year. This is not a discount that appeared on an otherwise healthy chart; it is a discount that has persisted.
Three data points frame the scale of the gap:
This is not a speculative micro-cap with a thin trading history. The discount is occurring in a business with global diversification, dual revenue channels, and a decades-long operating record. That combination makes it worth examining what the gap is actually pricing in.
The broader Australian travel sector is not struggling. It is growing. That context makes Flight Centre’s valuation gap more difficult to dismiss as a simple reflection of weak demand.
The ABS Tourism Satellite Account for 2024-25 captures realised outcomes, not projections. Tourism GDP rose 3.8% to $81.1 billion. Tourism gross value added reached $69.5 billion. Filled tourism jobs increased 2.0% to 696,000. These are backward-looking figures that confirm the recovery has translated into measurable economic activity, employment, and output.
The WTTC forecasts Australia’s travel and tourism sector will inject $314.4 billion into the economy in 2025. IBISWorld projects industry revenue of $213.2 billion in 2026, and explicitly notes the tourism industry definition includes work-related travel such as conferences, a category directly relevant to Flight Centre’s corporate travel division.
IBISWorld has cited annualised five-year industry growth of 15.3% through 2025-26, though this figure has not been independently verified and should be treated as a directional reference only.
| Metric | Value | Source | Period |
|---|---|---|---|
| Tourism GDP | $81.1 billion (+3.8%) | ABS | 2024-25 |
| Tourism gross value added | $69.5 billion | ABS | 2024-25 |
| Tourism filled jobs | 696,000 (+2.0%) | ABS | 2024-25 |
| Economic contribution forecast | $314.4 billion | WTTC | 2025 |
| Industry revenue forecast | $213.2 billion | IBISWorld | 2026 |
If the industry environment is broadly constructive, a persistent stock-level discount requires a specific explanation rather than a market-wide one. Something company-specific, structural, or sentiment-driven is holding the valuation down.
Valuation tool choice is not arbitrary. Different businesses call for different ratios, and applying the wrong one can produce a misleading reading.
Price-to-sales works in three steps:
For income stocks, dividend yield does the analytical work. For growth-oriented travel businesses, price-to-sales provides the more meaningful baseline.
Consider the contrast with Woolworths, which currently trades at a dividend yield of 4.18% against a five-year average of 2.92%. For a mature, income-paying retailer with consistent dividends, yield is the natural valuation lens. Flight Centre’s profile is different: founded in 1982, operating across more than 80 countries, serving both retail and corporate segments. Its earnings can be lumpy during recovery periods, and its growth orientation means revenue is a more stable and comparable baseline than earnings or dividends.
That is why the 0.76x P/S figure, not dividend yield or price-to-earnings alone, is the relevant starting point for analysing Flight Centre’s valuation.
A 78% discount to historical P/S norms is large enough to demand attention. It is not large enough to constitute a thesis on its own.
The macro recovery documented by the ABS, WTTC, and IBISWorld has not yet been reflected in Flight Centre’s re-rating. Tourism GDP is at $81.1 billion and growing. Industry revenue forecasts remain constructive. If the stock’s P/S has compressed from 3.42x to 0.76x while the sector environment has improved, the market may be pricing in a degree of pessimism that the fundamentals no longer support. This reading treats the discount as a lag between improving conditions and investor sentiment.
This remains a hypothesis requiring validation, not a confirmed conclusion.
Travel distribution has changed since Flight Centre’s historical P/S peak. Online booking platforms, direct airline sales channels, and shifting consumer behaviour may have permanently altered the competitive position of traditional travel intermediaries. If the market is pricing a lower structural revenue ceiling for the business, the historical 3.42x average may itself be an inflated benchmark rather than a fair comparison.
This is a plausible alternative thesis, not a confirmed outcome.
| What the discount CAN signal | What the discount CANNOT tell you |
|---|---|
| The market may be pricing slower revenue growth | Whether revenue will return to its historical trajectory |
| Sentiment may have overshot to the downside | Whether margins will normalise |
| Structural change in travel distribution may justify a lower multiple | Whether the five-year average P/S was itself an overvalued benchmark |
| The 3.2% proximity to the 52-week low suggests sentiment has not recovered | Whether sentiment is a leading or lagging indicator for this stock |
No verified broker target or earnings guidance update is available from current research sources. That absence is itself informative: the ambiguity in the discount cannot be resolved by ratio analysis alone. Supplementary modelling is required.
A single ratio is a screening tool, not an investment case. For investors who find the 0.76x P/S signal compelling enough to investigate further, the analytical path forward involves layering additional valuation models on top of the initial reading.
A single ratio is a question, not an answer. The quality of the investment decision depends on what comes next.
Rask’s analytical framework recommends supplementing ratio analysis with deeper modelling. The sequence looks like this:
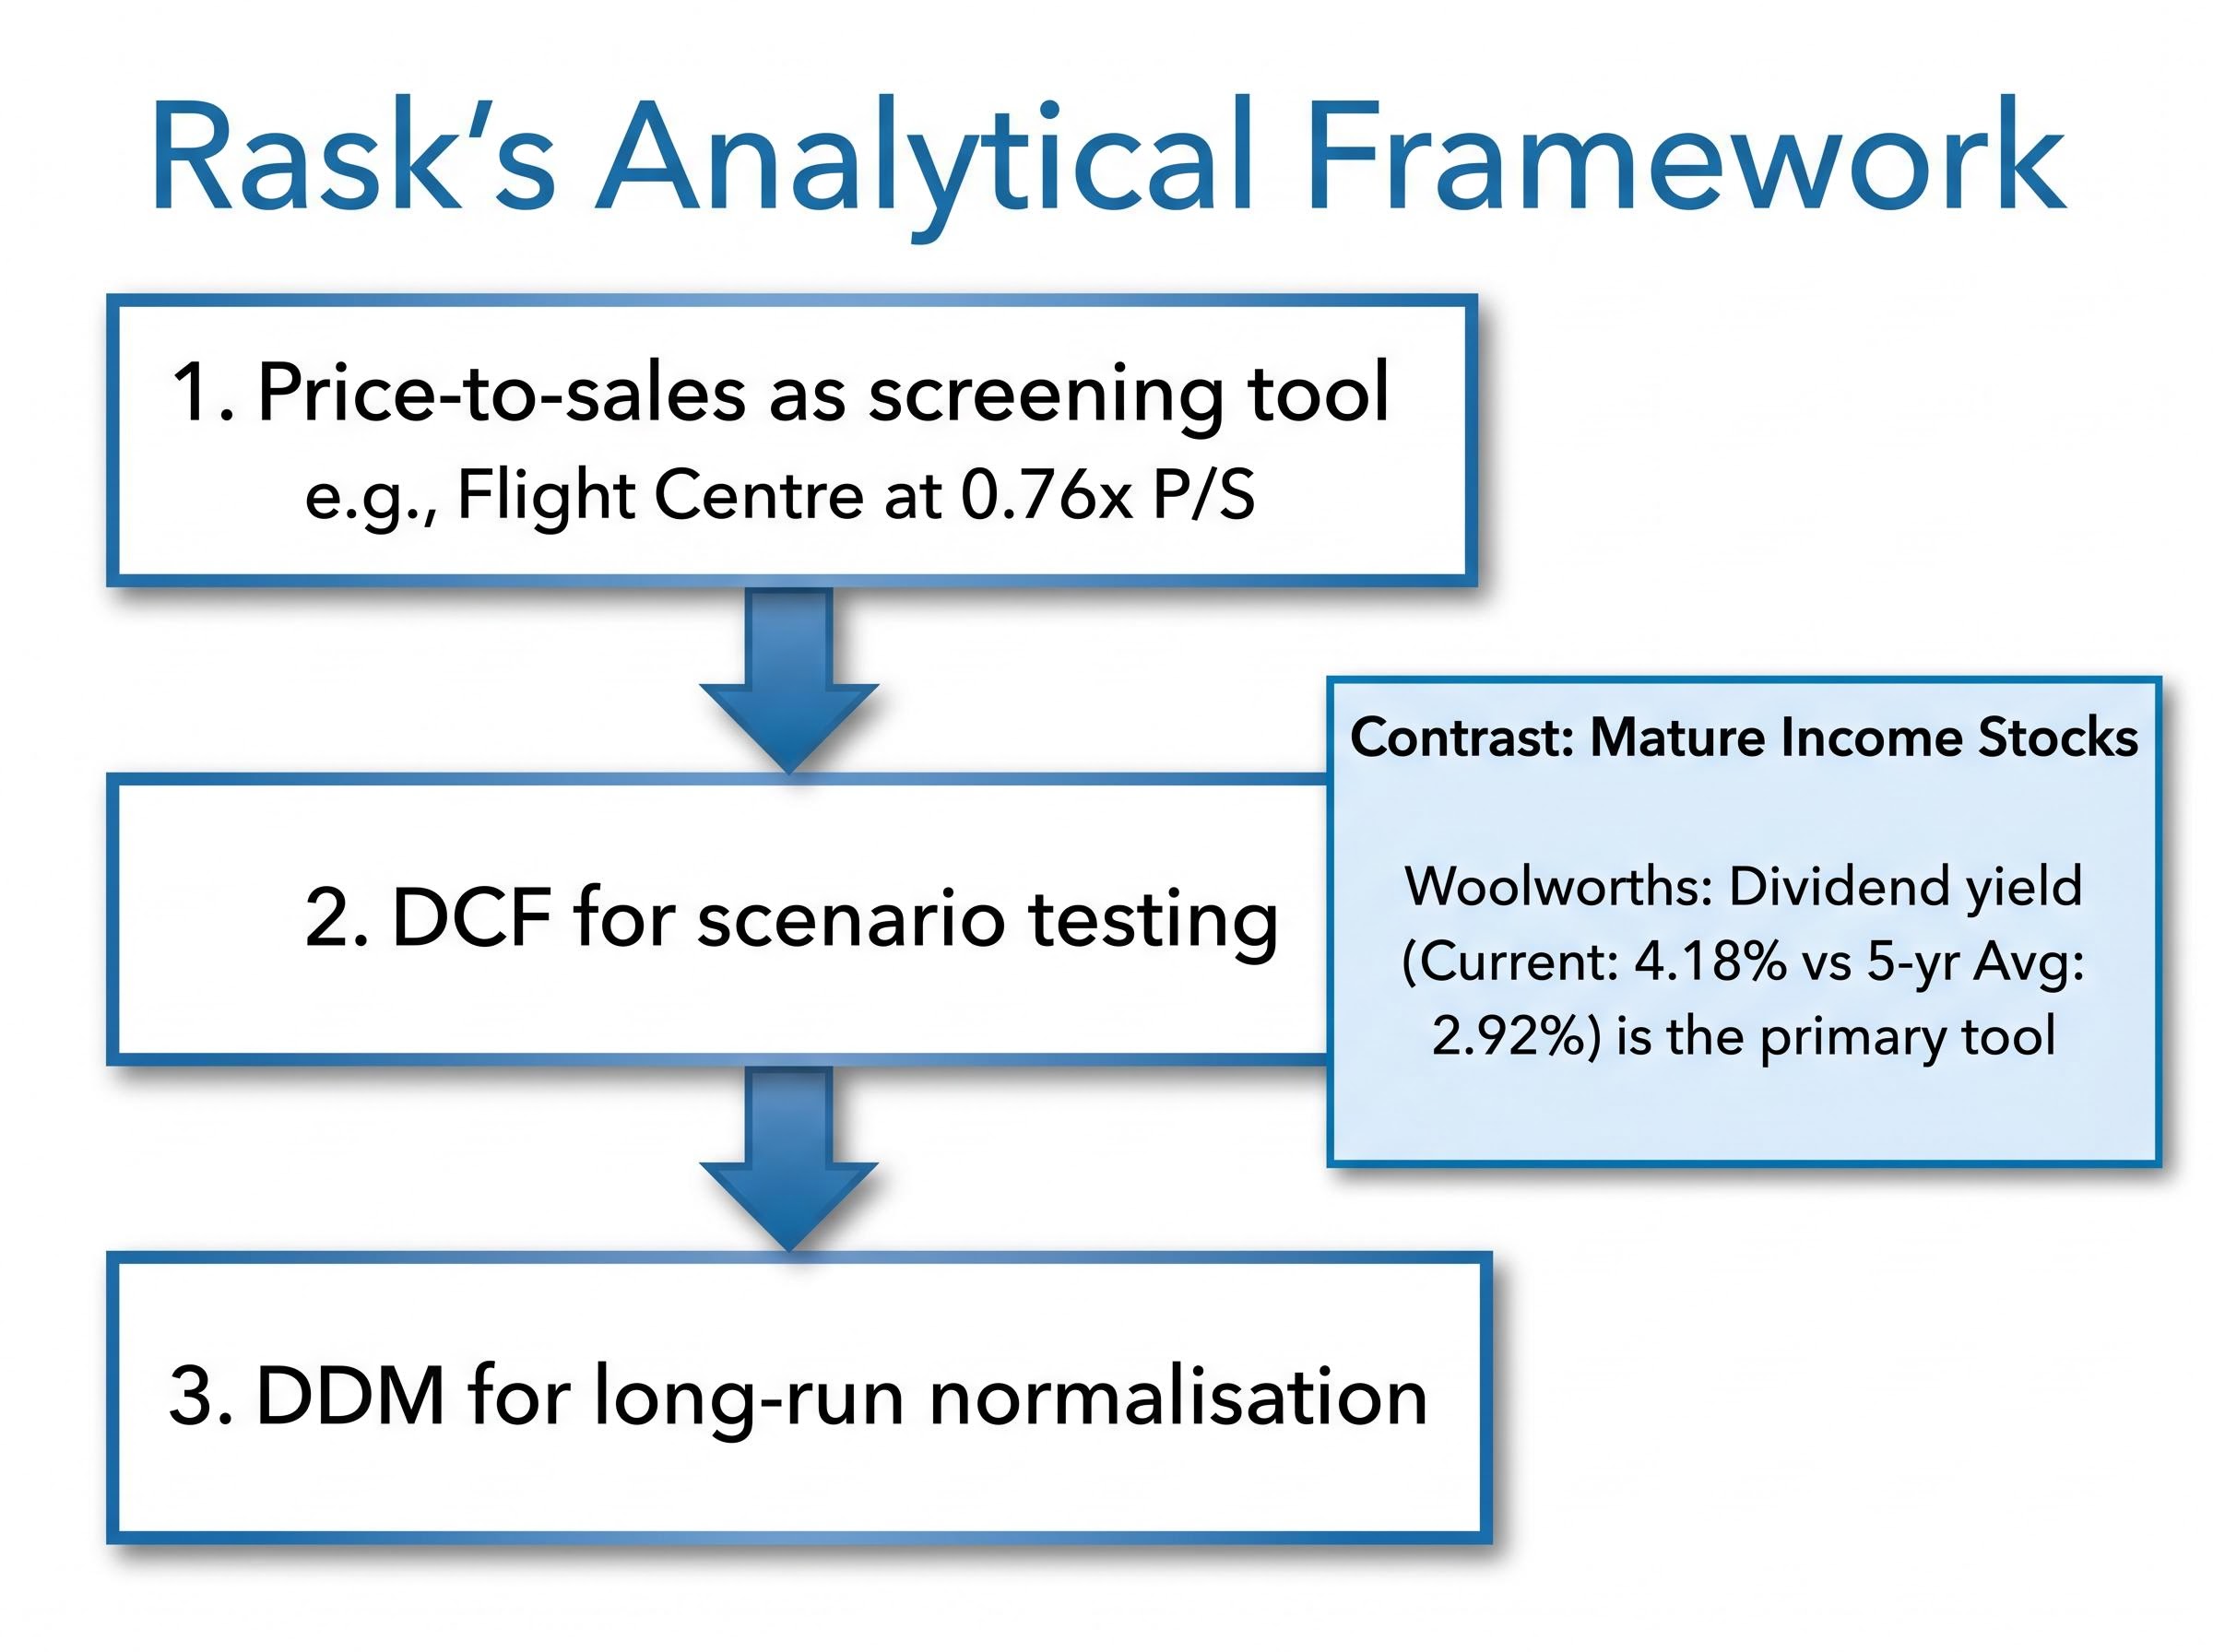
For a stock like Woolworths, where consistent dividend history is the defining characteristic, DDM is often the primary tool. For Flight Centre, it functions as a complementary layer rather than the lead model. The distinction matters because applying the wrong primary model produces the same distortion as applying the wrong ratio.
Three layers of evidence sit on the table. The macro tailwind is real: ABS data shows tourism GDP at $81.1 billion, the WTTC forecasts $314.4 billion in sector-wide economic contribution, and IBISWorld projects $213.2 billion in industry revenue. The discount to historical P/S is large and documented: 0.76x against a 3.42x five-year average. The interpretation of that discount remains unresolved.
The gap from 3.42x to 0.76x is a reason to look harder. It is not, on its own, a reason to act.
No verified company-level catalyst or broker update is available to resolve the ambiguity independently. That means the analytical work remains ahead, not behind.
This article is for informational purposes only and should not be considered financial advice. Investors should conduct their own research and consult with financial professionals before making investment decisions. Past performance does not guarantee future results. Financial projections are subject to market conditions and various risk factors.
A price-to-sales (P/S) ratio divides a company's market capitalisation by its annual revenue, showing how much investors are paying for each dollar of revenue generated. For Flight Centre, it is the preferred valuation lens because its earnings can be lumpy during recovery periods, making revenue a more stable and comparable baseline than earnings or dividends.
Flight Centre currently trades at a P/S ratio of 0.76x, approximately 78% below its five-year historical average of 3.42x, and sits just 3.2% above its 52-week low as of late May 2026.
The ABS Tourism Satellite Account for 2024-25 shows tourism GDP rose 3.8% to $81.1 billion, with 696,000 filled tourism jobs, while the WTTC forecasts the sector will contribute $314.4 billion to the Australian economy in 2025, pointing to a broadly constructive industry environment.
The discount could reflect a structural repricing of traditional travel intermediaries due to online booking platforms and direct airline sales channels permanently altering their competitive position, meaning the historical 3.42x average may no longer be a fair benchmark rather than a target to revert to.
Analysts recommend supplementing the P/S ratio with Discounted Cash Flow (DCF) modelling to stress-test future cash flow scenarios and a Dividend Discount Model (DDM) to discipline assumptions about long-run earnings normalisation, as a single ratio is a screening tool rather than a complete investment case.