EUR/USD pushed past 1.1673 on Wednesday despite the Federal Reserve minutes holding their hawkish tone, which is precisely the kind of apparent contradiction that rewards closer reading.
Two distinct forces converged to move the pair more than 0.85% in a single session: the US Treasury’s long-bond buyback programme quietly suppressing yields at the long end, and Eurozone inflation data cementing what is now near-certain European Central Bank (ECB) tightening in September. The dollar’s rate-premium appeal is being eroded not by a softer Fed, but by fiscal management working around it.
Here is what each of those forces is doing, where the technical levels sit, and which of three scenarios is most likely to determine where EUR/USD heads from here. By the end, you will have a clear read on whether this rally has legs, and what specific evidence would need to change for the thesis to break down.
How the dollar weakened even as the Fed stayed hawkish
On the surface, Wednesday’s session made no sense. The Fed’s July meeting minutes struck a hawkish tone, and the dollar fell anyway. Here is the context that resolves the contradiction:
- Session gain: EUR/USD rose more than 0.85%, reaching a high of 1.1673
- Fed tone: July meeting minutes characterised as hawkish, with no signal of a near-term pivot
- The actual driver: Declining US long-term Treasury yields on the day, not any softening in Fed rhetoric
The disconnect comes down to yield mechanics. The dollar’s strength against lower-yielding peers depends not on what the Fed says, but on what US yields actually do. When long-term Treasury yields fall, the rate differential between the US and the Eurozone narrows. That shrinks the carry advantage that makes holding dollars attractive relative to euros.
The dollar’s strength against lower-yielding peers depends not on what the Fed says, but on what US yields actually do, a distinction rooted in interest rate differentials: the pair prices the expected future gap between ECB and Fed policy, not the headline rate sitting on each central bank’s balance sheet today.
On Wednesday, long-term yields fell. The Fed’s words pointed one direction; the bond market pointed the other. The bond market won.
This matters for how you read future Fed communications. A hawkish statement without rising yields is an empty signal for the dollar. Watching the yield curve, not just the headline, is the sharper tool for reading this pair.
When big ASX news breaks, our subscribers know first
What the ECB’s September hike path means for the Euro
The July Eurozone Harmonised Index of Consumer Prices (HICP), which measures consumer price changes across the bloc, confirmed what preliminary estimates had already suggested: inflation is not cooling fast enough for the ECB to stand still.
The Eurozone HICP July confirmation, reported by The Business Times, recorded headline inflation at 2.9% and core at 2.5%, the combination that removed the ECB’s political cover for a pause and drove money market pricing from 88% to 96% hike probability in a single session.
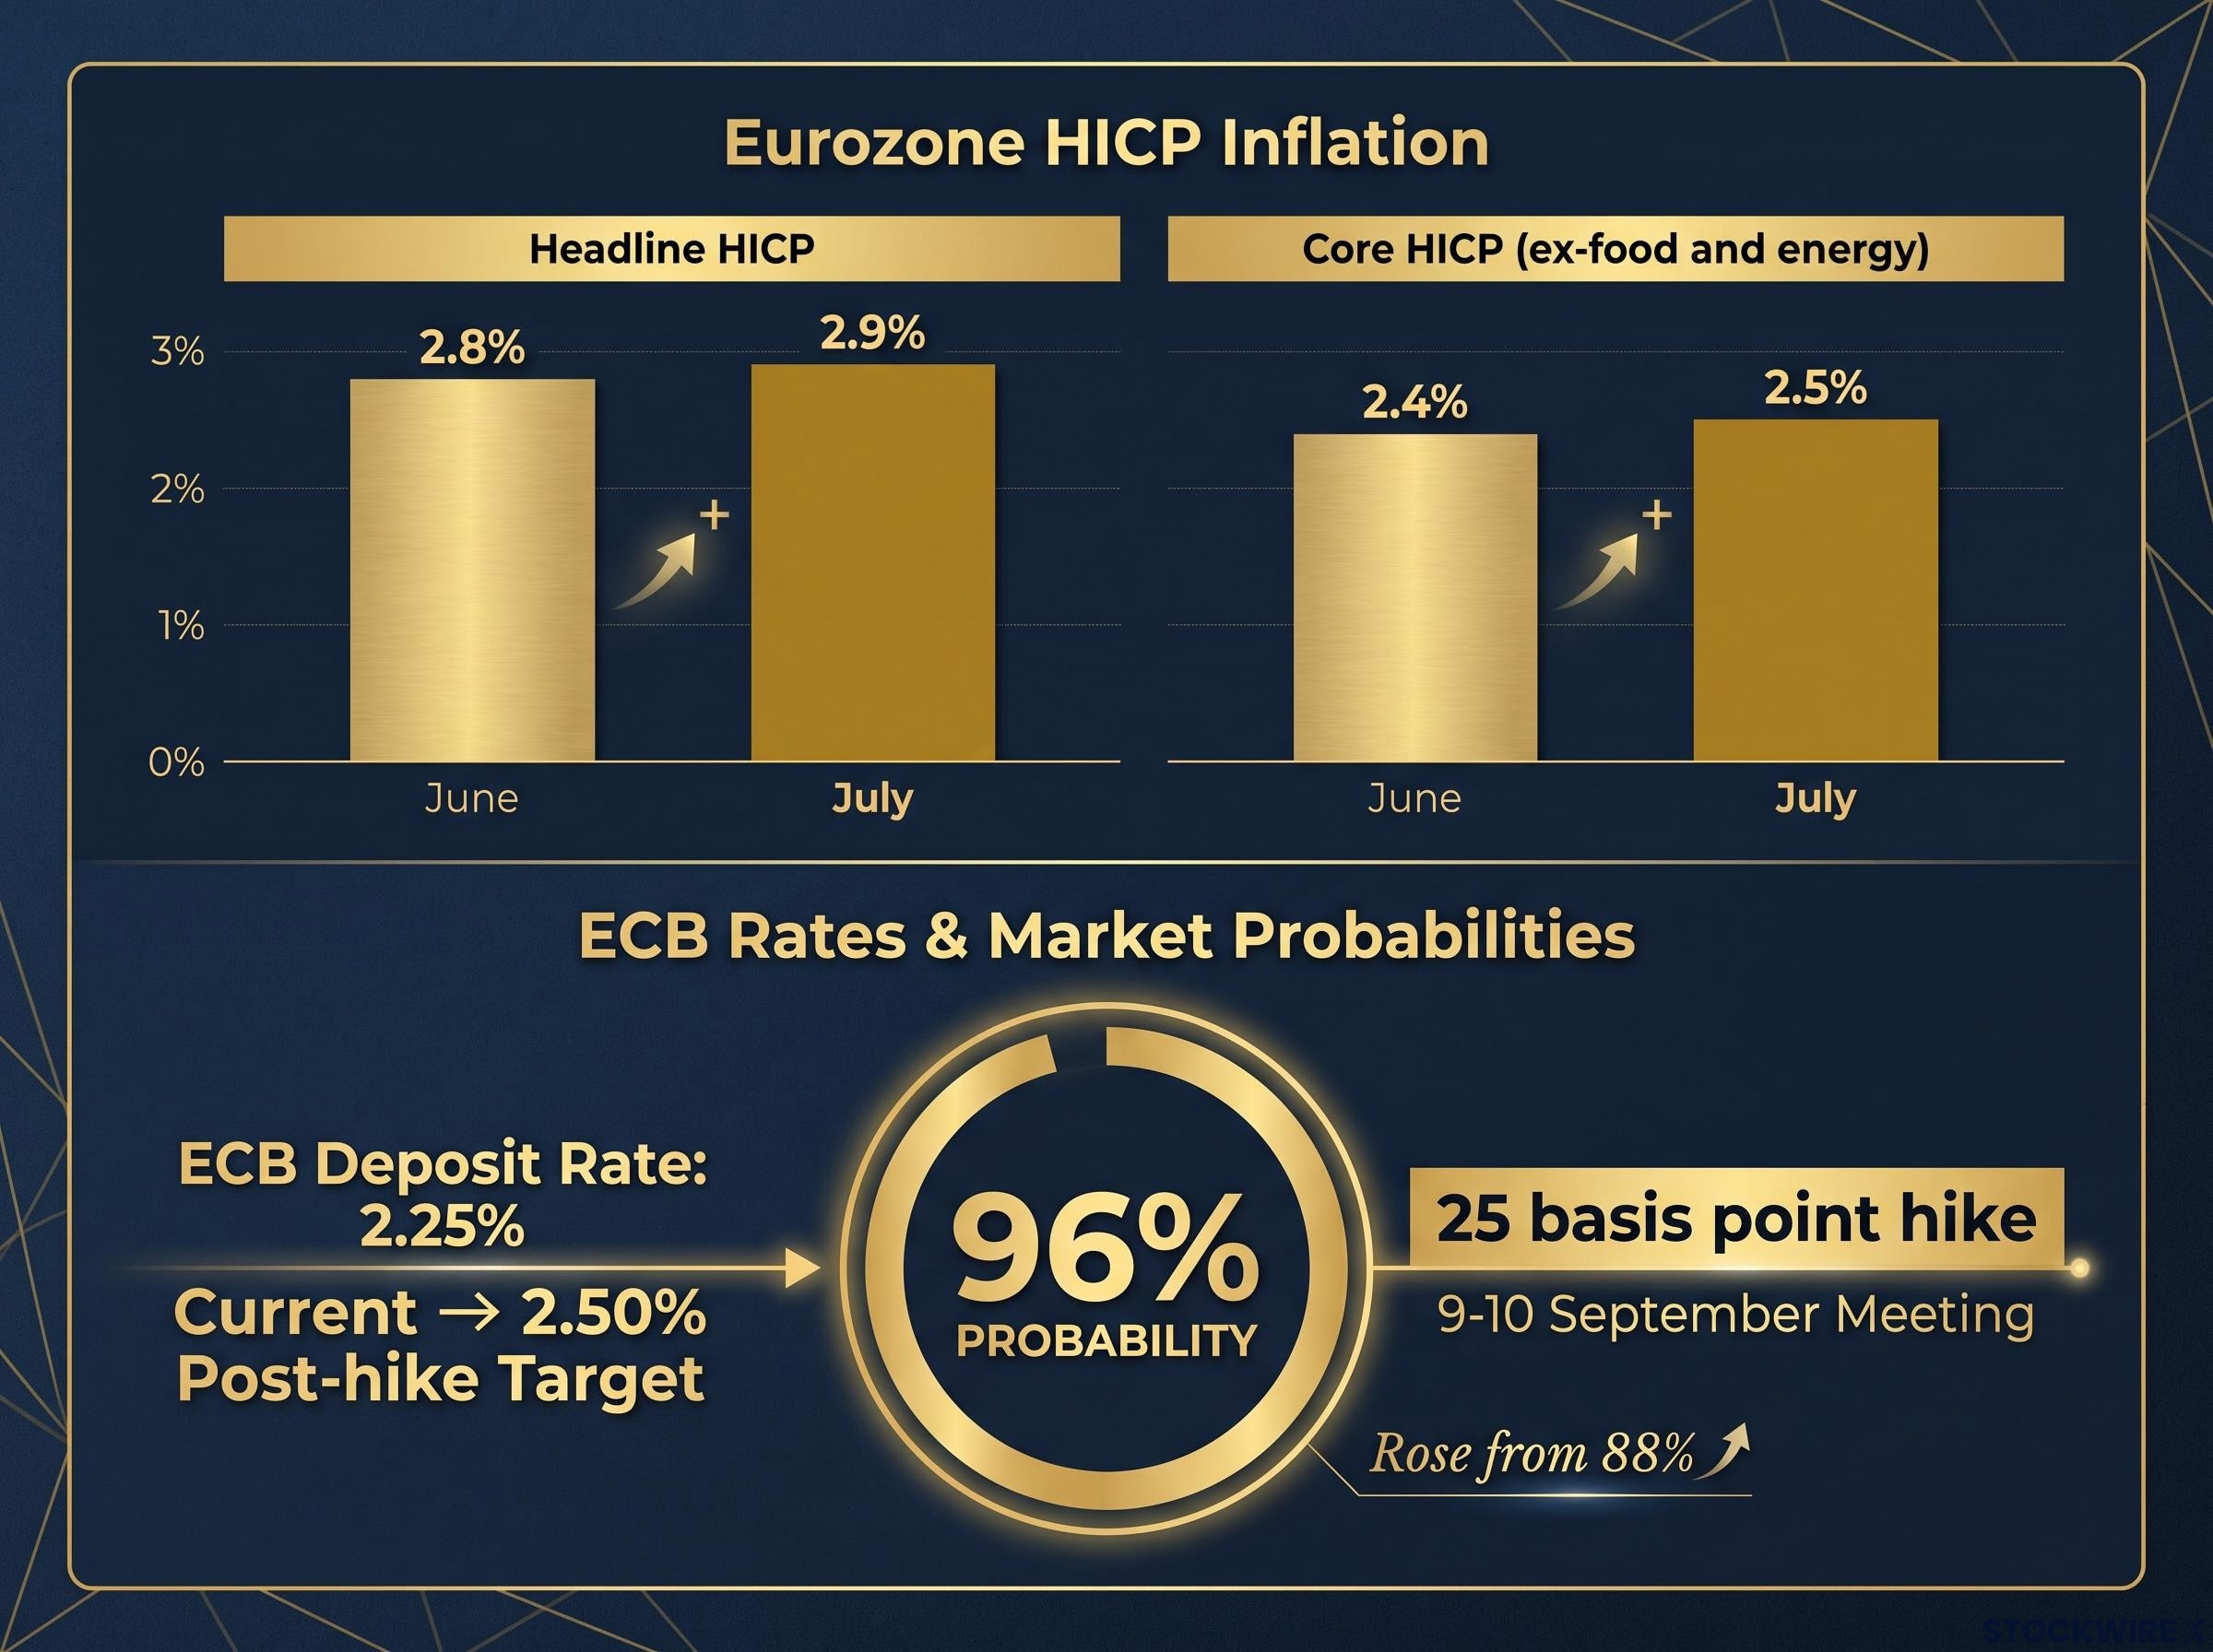
| Metric | June reading | July reading |
|---|---|---|
| Headline HICP (year-over-year) | 2.8% | 2.9% |
| Core HICP (ex-food and energy) | 2.4% | 2.5% |
| ECB deposit rate | 2.25% (current) | 2.50% (post-hike target) |
Both headline and core inflation moved higher month-on-month. That combination matters because it closes the political escape route the ECB might otherwise use. When core inflation (stripping out volatile food and energy prices) is falling while headline holds steady, policymakers can argue the underlying trend is softening. When both are rising, that argument disappears. With inflation still meaningfully above the ECB’s 2% target, pausing would raise serious questions about institutional credibility.
The market has priced this accordingly.
Hike probability: Money market pricing now implies approximately a 96% chance of a 25 basis point rate increase at the ECB’s 9-10 September meeting, according to Grok-verified pricing data following the HICP confirmation. Prior to the July print being confirmed, Prime Terminal data had placed the probability at 88%, reflecting the extent to which the final reading shifted market conviction.
The jump from 88% to 96% after the confirmed data tells you something specific: this hike is no longer a catalyst for surprise. It is a supporting pillar. The Euro’s bullish bias draws real structural support from an ECB that is still tightening, but you should not expect this particular data point to produce a fresh spike. The move is already in the price.
How US Treasury buybacks are capping long yields and clipping the dollar
The second force working against the dollar is less visible and less discussed, which is precisely why it matters. The US Treasury has been acquiring long-dated securities through a buyback programme that Bloomberg-cited sources described as functioning like a yield curve control mechanism, aimed at pulling long-term borrowing costs lower.
Here is the mechanism in three steps:
- Treasury buys long-dated bonds. This increases demand for those bonds, pushing their prices up.
- Higher bond prices mean lower yields. Bond prices and yields move inversely, so the purchases mechanically push long-term yields down.
- Lower US long yields shrink the dollar’s rate premium. When the yield gap between US and Eurozone bonds narrows, the incentive to hold dollars over euros weakens.
The result is a structural headwind for the dollar that operates independently of what the Fed says. The Fed can hold rates high and talk hawkish. If the Treasury is simultaneously buying bonds and capping yields at the long end, the dollar’s carry advantage erodes anyway.
Treasury yield dynamics have taken on a policy function that extends well beyond the forex market: the 10-year and 30-year yields are now the primary pressure mechanism on White House decision-making, displacing equity market signals that previously carried more weight in the policy feedback loop.
This is not a one-off tactical move. Bloomberg-cited sources described the programme as designed to manage the yield curve, framing it as an ongoing structural feature of US fiscal policy. That distinction matters because it suggests the dollar’s near-term ceiling is being partly set by its own Treasury department, not just by the Fed. As long as this programme continues, the usual assumption that hawkish Fed rhetoric equals dollar strength is unreliable.
NBER research on Treasury yields and dollar convenience yields documents how the two can decouple, providing an academic framework for why long-end yield suppression through Treasury buybacks can erode the dollar’s rate premium even when the Fed holds its policy rate unchanged.
The technical picture: support levels, resistance, and an overbought warning
The fundamental story supports euro strength. The chart does too, but with a caveat.
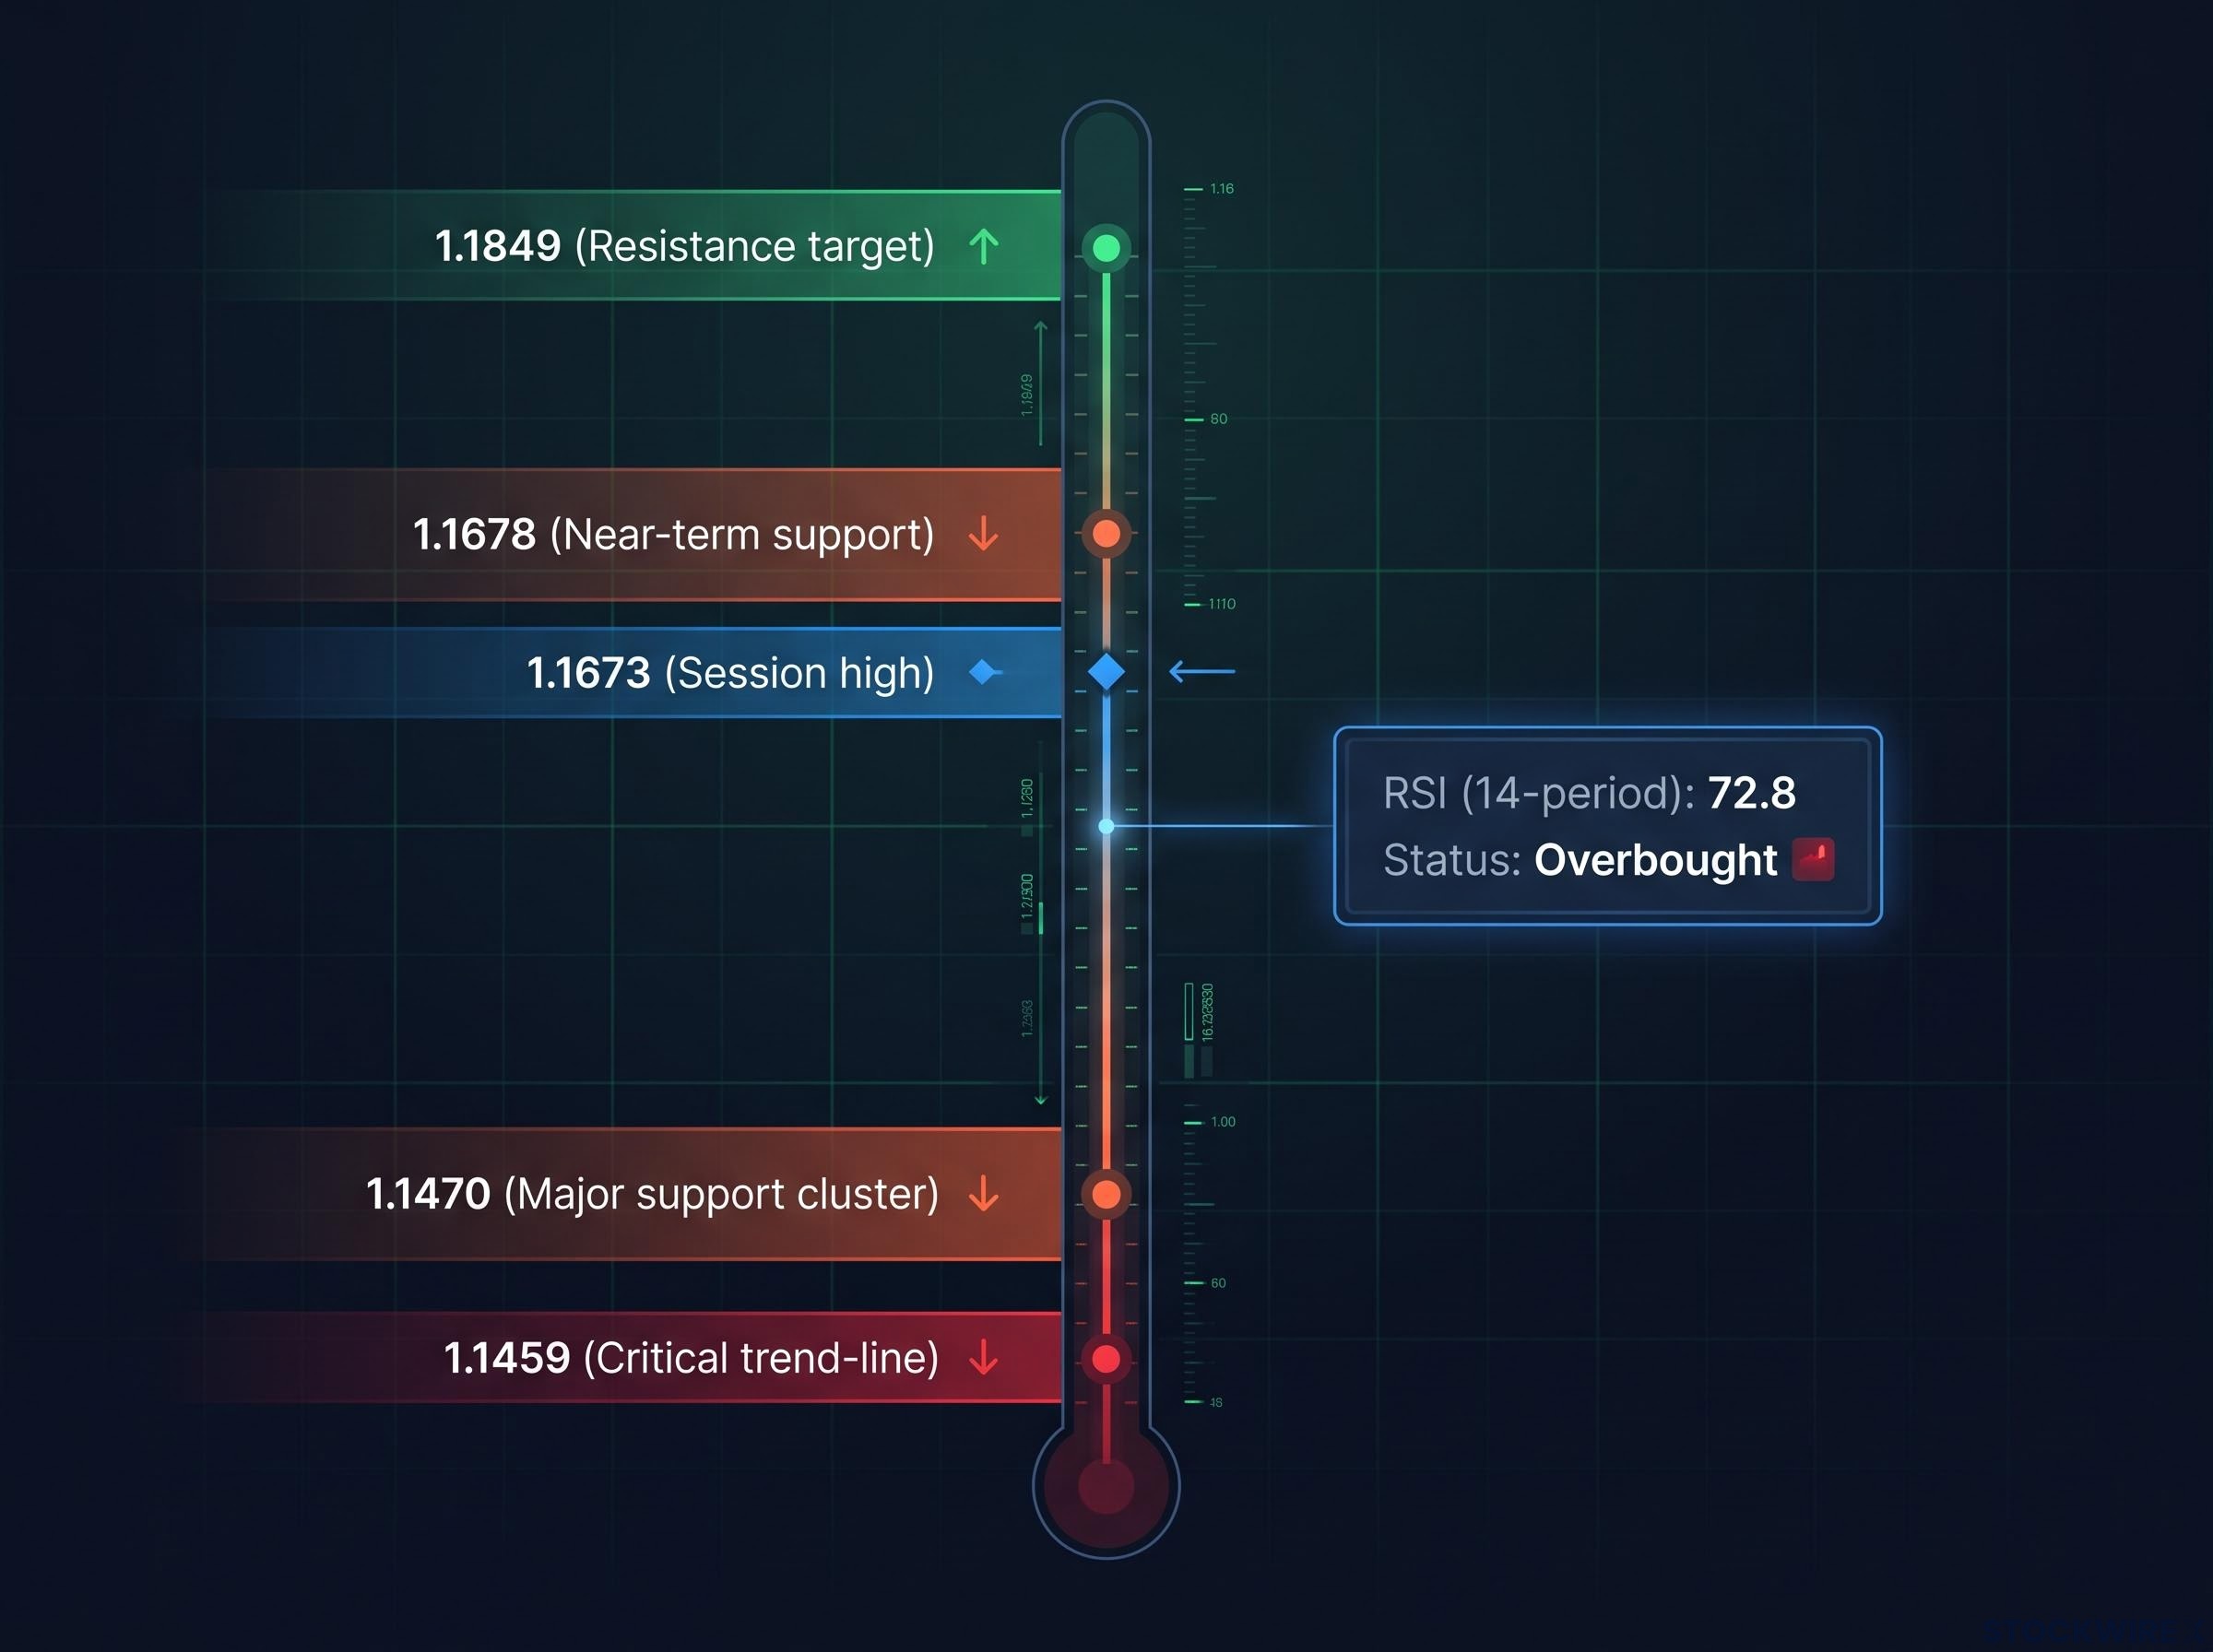
| Level | Price | Significance |
|---|---|---|
| Session high | 1.1673 | Wednesday’s peak; current area of interest |
| Near-term support | 1.1678 | Initial floor for shallow pullbacks |
| Major support cluster | 1.1470 | Triple simple moving average convergence |
| Critical trend-line | 1.1459 | Daily close below flips bias to neutral/bearish |
| Resistance target | 1.1849 | Break and hold signals divergence trade extension |
The key structural pivot sits within the 1.1459-1.1470 zone, where the daily trend-line and a triple simple moving average cluster align to form a combined support base. Price is trading comfortably above this area, which keeps the medium-term bias firmly bullish. A daily close below 1.1459 would be the single clearest signal that the thesis has broken down.
To the upside, the horizontal resistance at 1.1849 is the level that needs to yield before the rally can extend meaningfully further. A clean break and hold above that level would signal the divergence trade, ECB tightening into sticky inflation while US yields are capped, is extending into a stronger Euro leg.
Note: technical analysis for this setup was partially generated with AI assistance per the original FXStreet analysis.
What the RSI reading means in practice
RSI (14-period): 72.8. Any reading above 70 is considered technically overbought, meaning the pace of recent gains has outrun the pair’s short-term average. It does not guarantee an immediate reversal, but it increases the probability of a pullback or sideways consolidation before fresh highs.
An RSI at 72.8 does not mean the rally is over. Momentum can stay elevated for extended periods when fundamentals support it. What it does tell you is that the risk-reward profile for new long positions at current levels is worse than it would be on a dip toward 1.1678 or 1.1470.
The practical takeaway is straightforward: buy dips, not breakouts. If you are watching this pair with a constructive bias, patience offers a better entry than urgency.
Three scenarios shaping where EUR/USD goes from here
Markets rarely follow one script. Here are the three most probable paths forward, defined by specific conditions rather than vague sentiment shifts.
| Scenario | Trigger conditions | Price implications |
|---|---|---|
| Base case: consolidation | ECB stays on track for September hike; US long yields remain subdued; no major data surprises | Range between 1.1678 and 1.1849; shallow dips bought |
| Bullish extension | ECB rhetoric stays hawkish; US yields drift lower or remain capped by buyback programme | Sustained break above 1.1849 opens room toward mid-1.19s; likely a grind, not a spike |
| Bearish reversal | US yields back up meaningfully (buybacks scaled back or stronger US data); ECB officials question September hike | Decisive daily close below 1.1459-1.1470 flips medium-term bias to neutral/bearish |
The base case carries the highest near-term probability given the overbought RSI reading combined with intact fundamental supports. The pair has room to consolidate without breaking its trend. The bullish extension requires the same forces that drove this week’s move to persist and intensify, possible but more likely to unfold as a grind. The bearish reversal requires a specific catalyst: either the Treasury stepping back from yield management or the ECB signalling hesitation on September.
The current move shares a structural feature with earlier EUR/USD advances this year: a dollar-weakness-driven rally, where the pair rises because the dollar is being sold rather than because the euro is being actively bought, tends to be more fragile near resistance than spot charts suggest.
Rather than picking one path, watch three variables: ECB communication, US long-term yield direction, and the 1.1459-1.1470 zone. Those three inputs will tell you which scenario is unfolding in real time, and let you update your view as the data arrives rather than committing to a fixed directional bet.
What shifts the story, and what keeps it intact
Two structural pillars are holding the EUR/USD bullish bias in place right now:
The broader ECB tightening cycle extends beyond a single September move: UBS economists have flagged that markets may be underpricing the total volume of hikes through December 2026, a scenario that would strengthen the euro’s structural support beyond the near-term consolidation range this article outlines.
- ECB tightening remains on track, with a 96% market-implied probability of a September hike
- US long yields are capped by the Treasury’s buyback programme, eroding the dollar’s rate advantage
Two specific developments would break those pillars:
- ECB officials publicly questioning the need for a September rate increase, or incoming data showing a meaningful deceleration in Eurozone inflation
- The Treasury scaling back its buyback programme, or US economic data driving long-term yields materially higher on their own
As long as both pillars hold, the constructive range of 1.1678 to 1.1849 frames the trade. The binary signal is the 1.1459-1.1470 zone: above it, the thesis stays intact; a daily close below it, and the divergence trade is over for now.
This article is for informational purposes only and should not be considered financial advice. Investors should conduct their own research and consult with financial professionals before making investment decisions. Past performance does not guarantee future results. Financial projections are subject to market conditions and various risk factors.