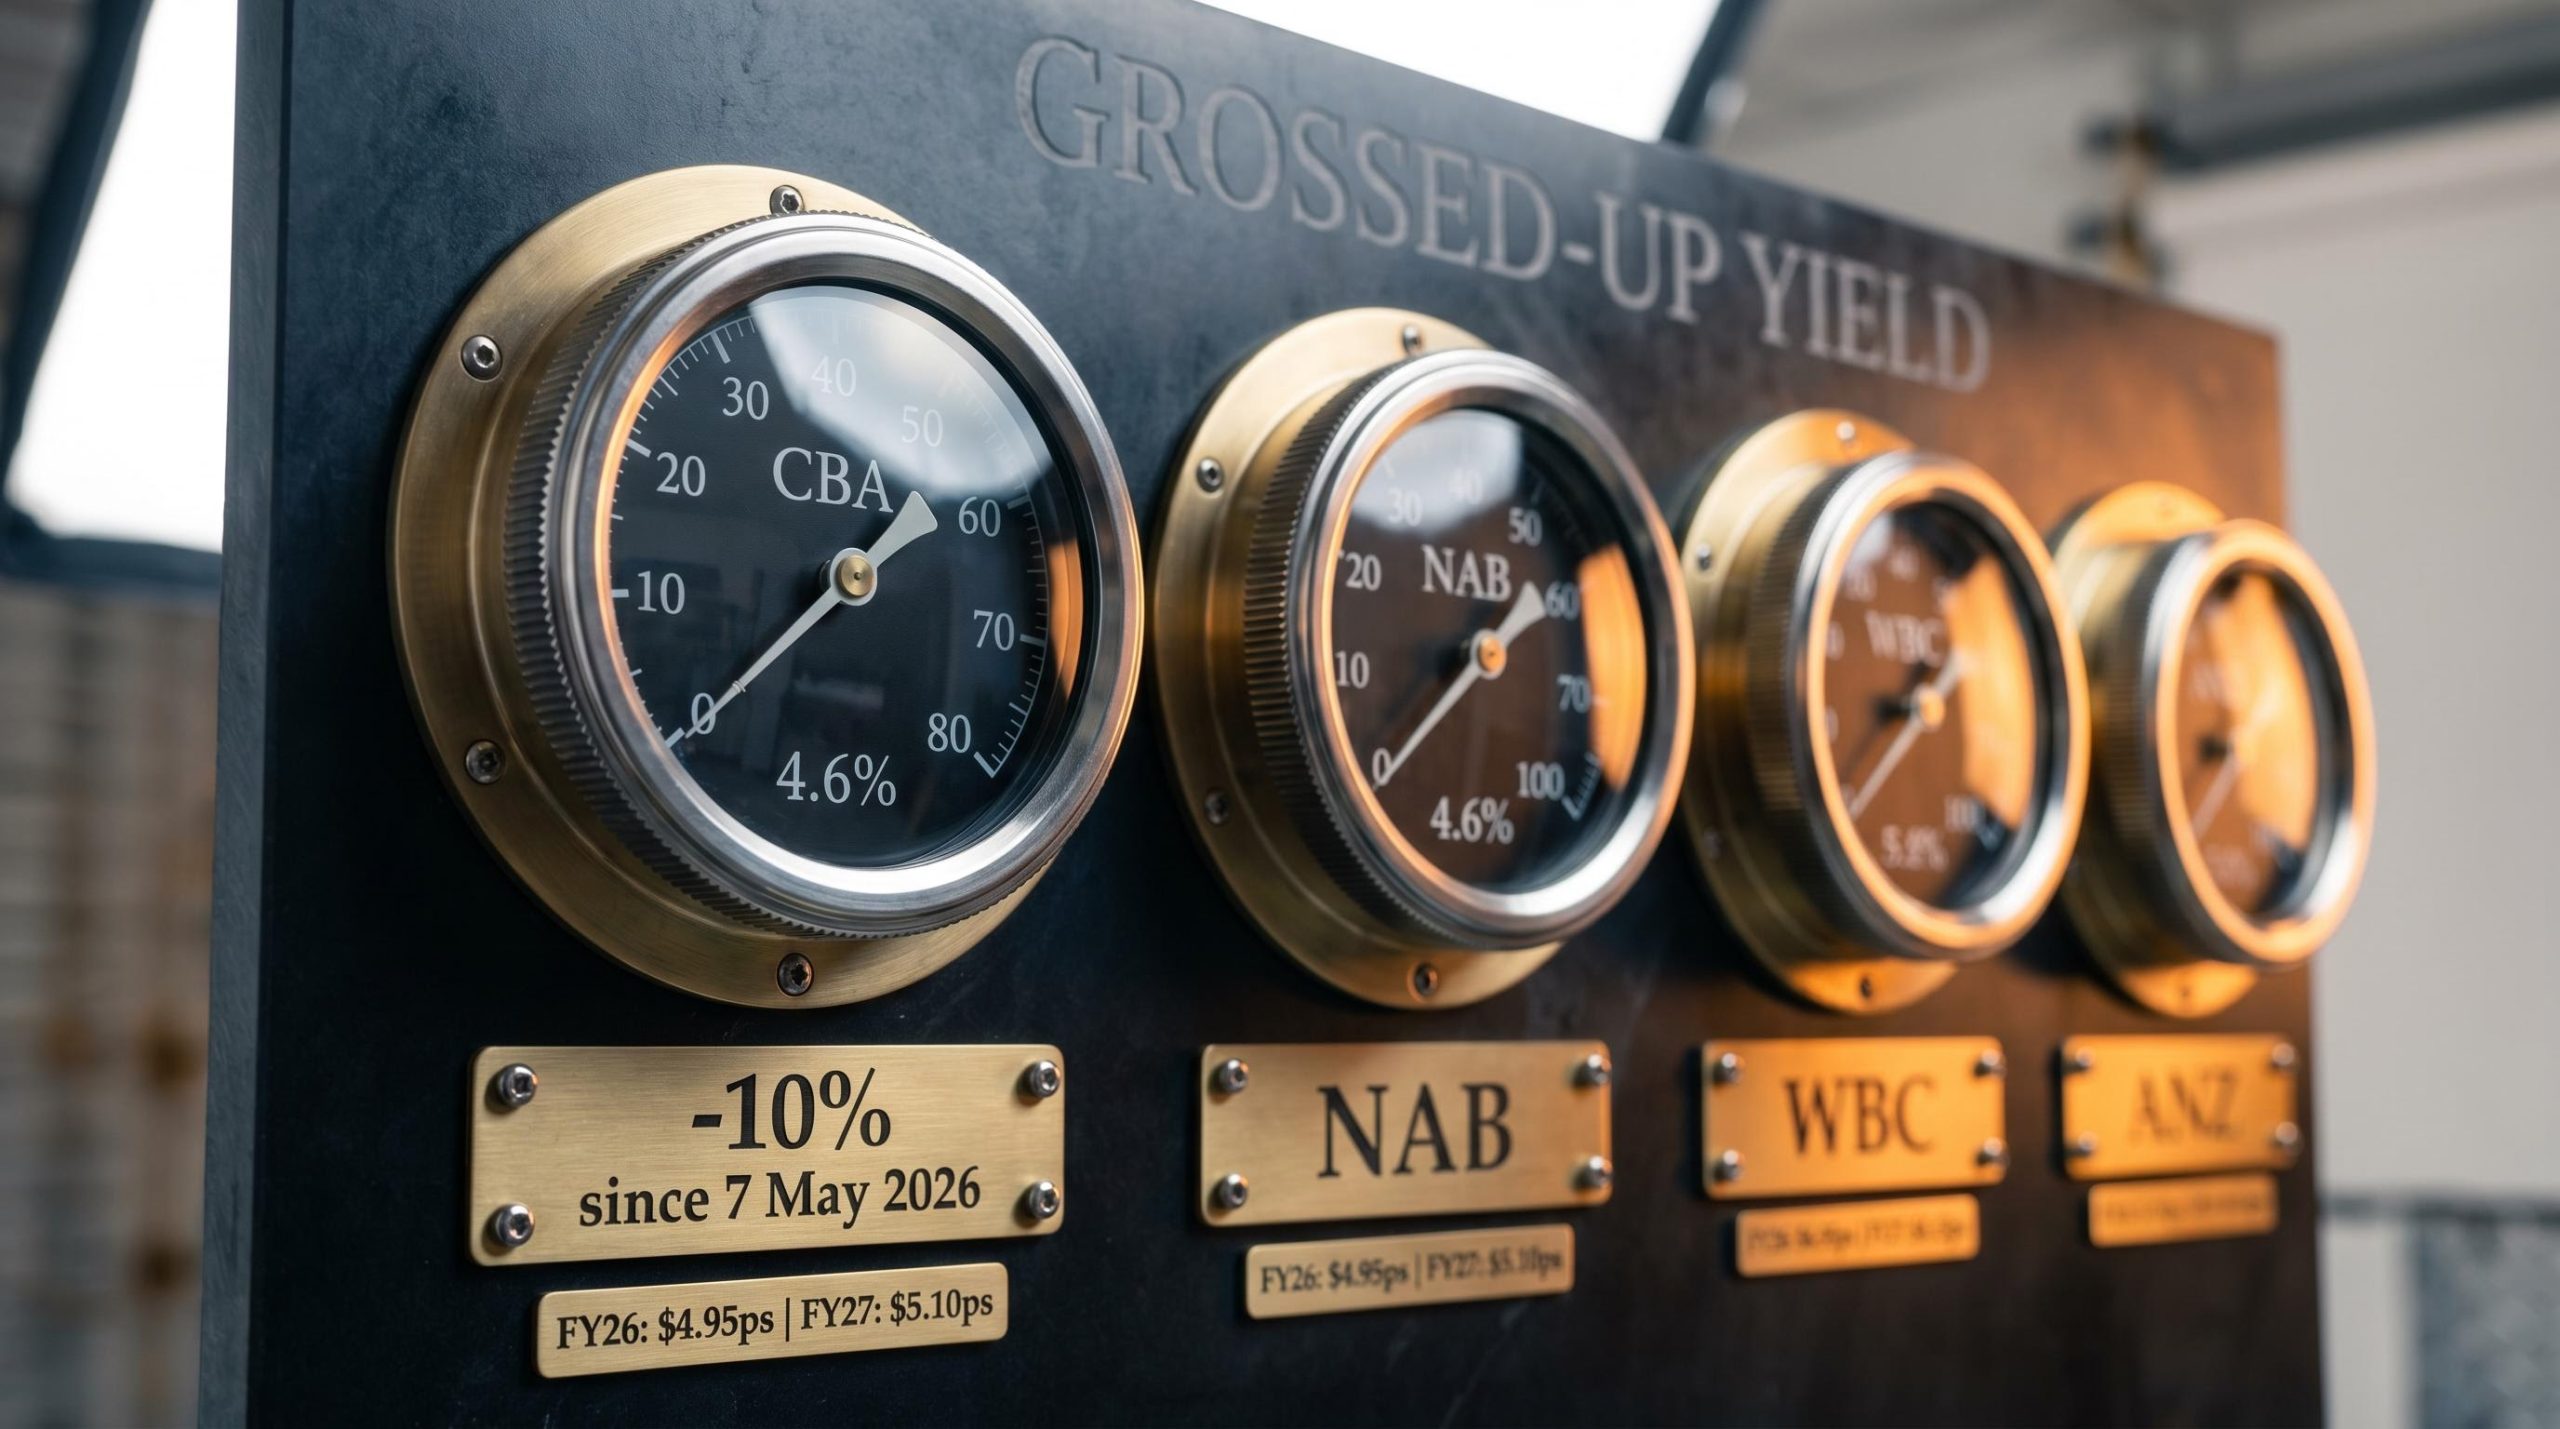
Commonwealth Bank of Australia shares have shed more than 10% since early May 2026, and for income investors watching from the sidelines, that decline raises an immediate question: has the sell-off finally made Australia’s most expensive bank stock worth owning for yield? The pullback, which followed CBA’s Q3 FY26 trading update and the federal budget, has mechanically lifted the stock’s dividend yield. A higher yield on a lower price, however, is not the same thing as genuine income value. The distinction matters when NAB, WBC, and ANZ have been offering materially higher grossed-up yields all along. What follows is an assessment of CBA’s Q3 FY26 results, the FY26 and FY27 dividend forecasts, the franking credit mechanics that determine real yield for Australian investors, and how CBA’s income profile compares to the other Big Four banks, so readers can judge whether the pullback has created a genuine entry point or whether peers remain the better income trade.
What the 10% sell-off has actually done to CBA’s yield
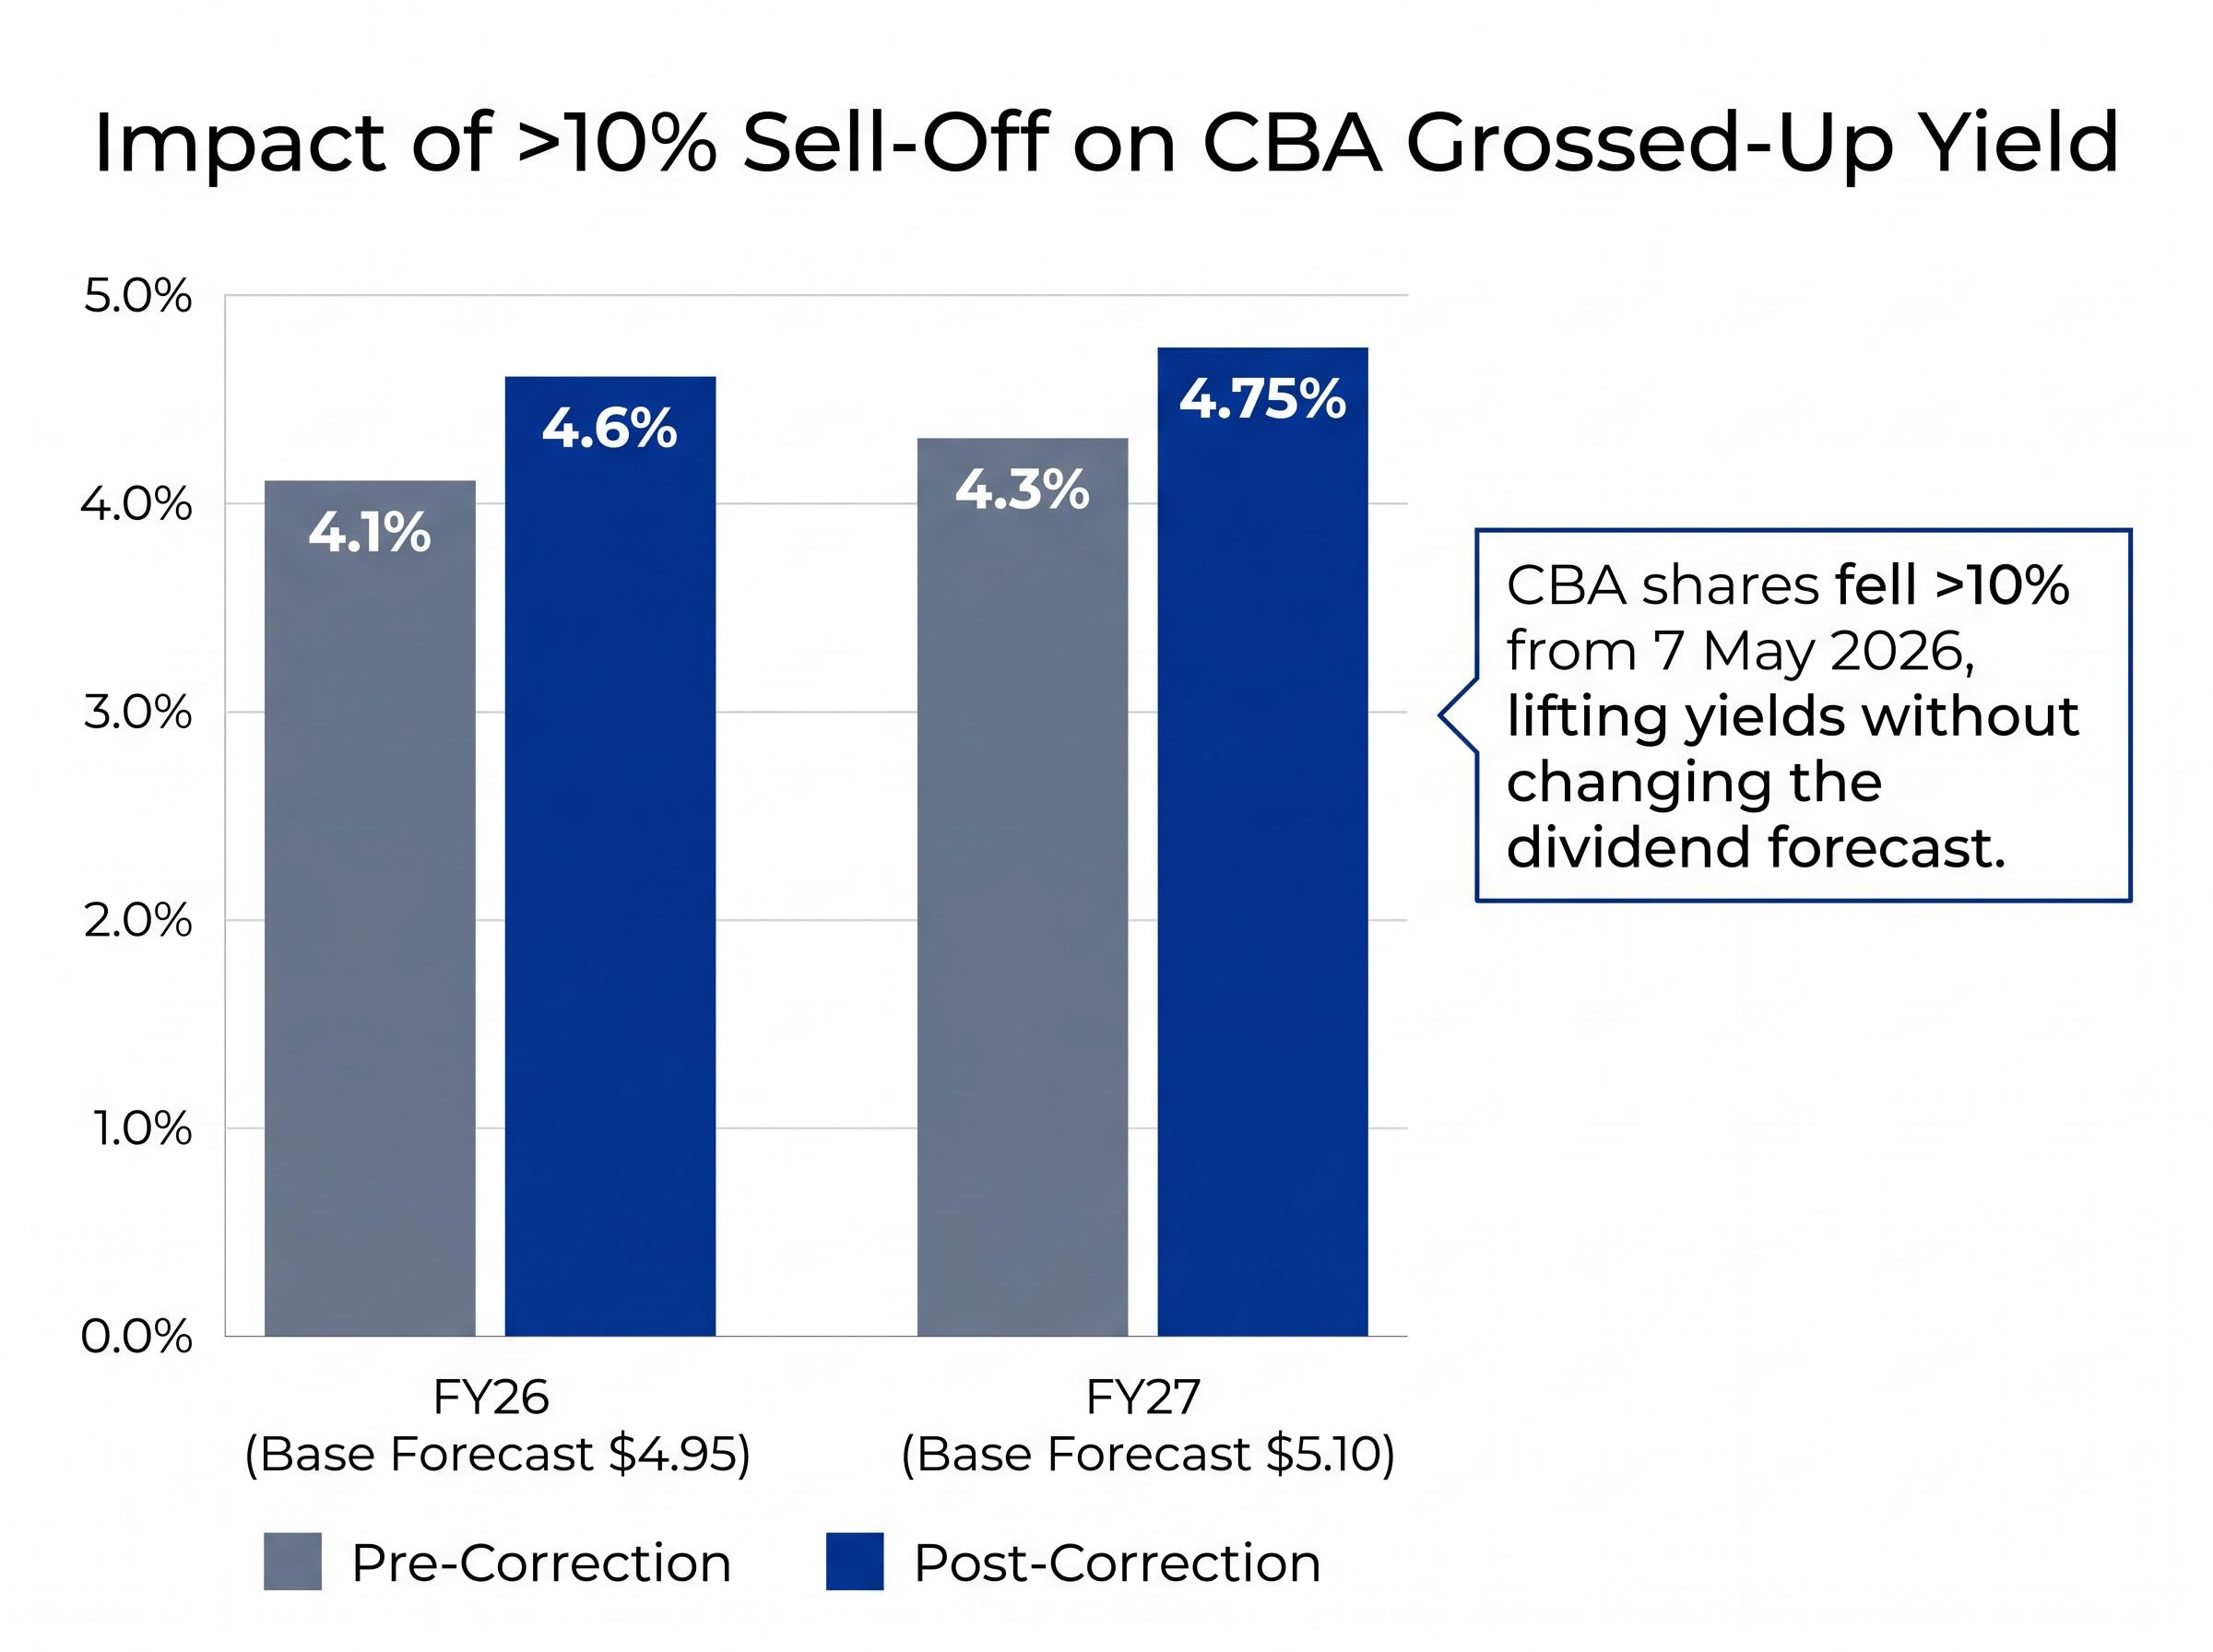
The arithmetic is straightforward. When a share price falls and the expected dividend stays the same, the implied yield rises. CBA’s decline of more than 10% from 7 May 2026 has done exactly that, lifting the stock’s forward yield without any change to the underlying payout forecast.
FY26 dividend forecast: Consensus figures cited by Motley Fool Australia (sourced from CMC Markets, 8 January 2026) project $4.95 per share for FY26, representing approximately 4% year-on-year growth.
The FY27 forecast sits at $5.10 per share. On a grossed-up basis (accounting for full franking at the 30% corporate tax rate), these translate to yields that have shifted meaningfully as the share price has moved.
| Period | Pre-Correction Grossed-Up Yield | Post-Correction Grossed-Up Yield |
|---|---|---|
| FY26 | Approximately 4.1% | Approximately 4.6% |
| FY27 | Approximately 4.3% | Approximately 4.75% |
The improvement is real but passive. The dividend forecast has not been upgraded; only the denominator has changed. Income investors need to separate the signal from its cause before treating this as a buying opportunity.
The distinction between dividend yield and total return is central to evaluating any income stock after a price correction: a higher yield produced by a falling share price does not represent new wealth creation, it represents a redistribution of existing value at a lower entry cost.
When big ASX news breaks, our subscribers know first
CBA’s Q3 FY26 results and what they say about dividend sustainability
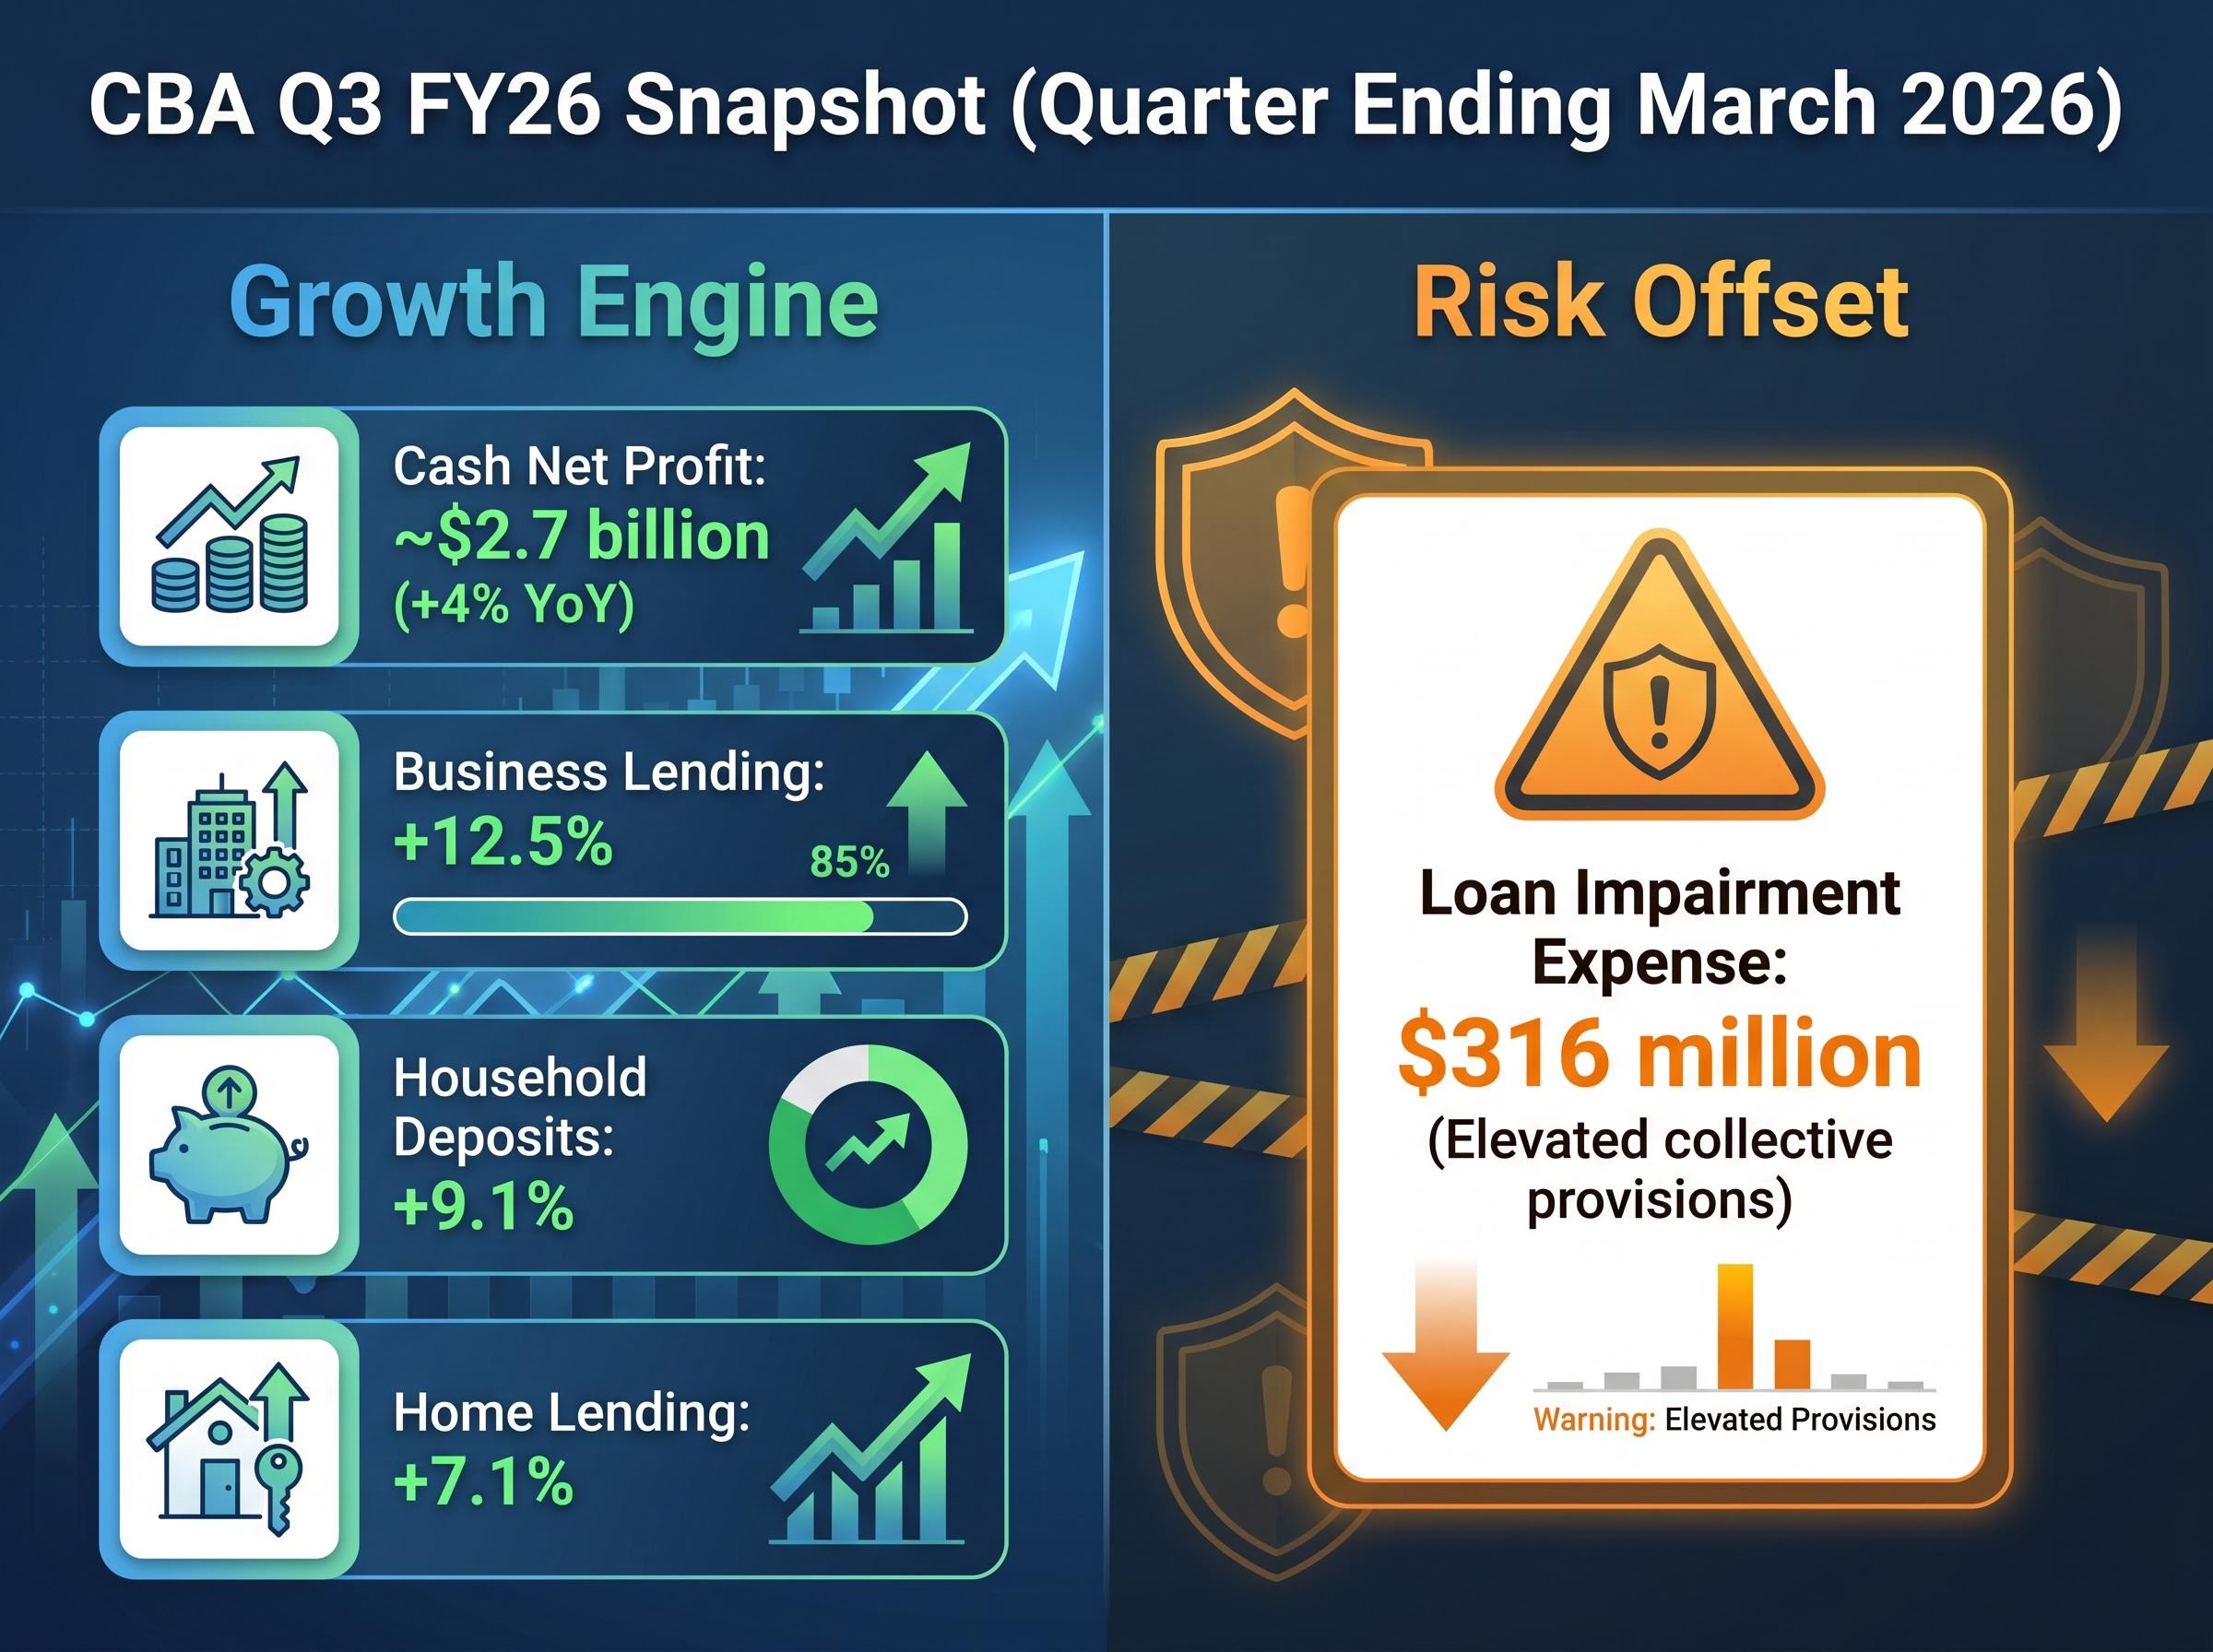
CBA’s Q3 FY26 trading update, released on 13 May 2026 and covering the quarter ending March 2026, showed an earnings base that is growing but carrying a visible credit risk offset. The headline numbers point to a bank still generating the profits needed to support its dividend forecast.
Key Q3 FY26 metrics:
- Cash net profit: approximately $2.7 billion, up 4% year-on-year
- Business lending growth: 12.5% for the quarter
- Home lending growth: 7.1% for the quarter
- Household deposit growth: 9.1% for the quarter
Lending and deposit growth confirm that CBA’s revenue engine is expanding across both sides of the balance sheet. Business lending at 12.5% is a standout figure, reflecting commercial appetite that feeds directly into net interest income. These are the numbers that underpin a $4.95 per share FY26 payout.
Credit quality and the provisioning caveat
The offsetting signal sits in the loan impairment line. CBA reported a loan impairment expense of $316 million for the quarter, with elevated collective provisions attributed to increased economic uncertainty. Collective provisions are reserves set aside for loans that have not yet defaulted but are considered more likely to do so given broader conditions; they represent a forward-looking judgement about where credit losses may head.
Credit impairment provisions across the sector have not been uniform in 2026: NAB’s $706 million charge disclosed in April, linked to stress in agriculture, transport, and manufacturing, represents a forward-looking credit risk signal of a different character from CBA’s collective provisioning, which is spread across the broader loan book rather than concentrated in specific stressed sectors.
Strong credit quality has historically been a CBA differentiator among the Big Four. Whether that advantage is narrowing depends on whether these provisions convert into actual losses or remain a conservative buffer that ultimately unwinds. No changes to CBA’s dividend policy or capital management have been announced since the Q3 update, based on a review of ASX announcements and CBA’s investor centre.
The Q3 results, taken together, support the credibility of the FY26 dividend forecast. Earnings growth of 4% comfortably covers modest dividend growth, provided credit losses do not accelerate materially in the final quarter.
Grossed-up yields explained: why franking credits change the income calculation for Australian investors
Australian resident investors comparing bank dividend yields on a cash basis are using the wrong metric. All four major banks pay fully franked dividends, which means each dollar of dividend carries a franking credit representing the corporate tax already paid on those earnings. For investors in the 30% tax bracket, the franking credit effectively adds a layer of income that a raw yield figure does not capture.
The grossed-up yield calculation involves two steps:
The ATO franking credit allocation rules set out the applicable gross-up rate and corporate tax rate used in imputation calculations, confirming the 30% rate applied throughout this analysis and the mechanics that determine how much additional income a fully franked dividend delivers to Australian resident investors.
- Gross up the cash dividend: divide the cash dividend per share by (1 minus the corporate tax rate of 0.30). For CBA’s FY26 forecast of $4.95, that produces a grossed-up dividend of approximately $7.07.
- Calculate the yield: divide the grossed-up dividend by the current share price. This produces the grossed-up yield, which for CBA sits at approximately 4.6% for FY26.
FY27 grossed-up yield: approximately 4.75%, based on the $5.10 per share consensus forecast, representing the forward income trajectory for investors entering at current prices.
Since all four major banks are fully franked, franking credits do not give CBA a relative advantage over peers. They do, however, meaningfully change the comparison with non-bank yield alternatives such as real estate investment trusts or infrastructure funds, where franking is partial or absent.
How CBA’s yield compares to NAB, WBC, and ANZ for income investors
The peer comparison is where CBA’s income case encounters its most persistent challenge. NAB, WBC, and ANZ all offer higher grossed-up yields than CBA, both before and after the May 2026 correction.
Livewire Markets commentary has referenced a grossed-up yield of approximately 7.6% for NAB, derived from FY26 consensus dividends and share prices around early May 2026. While that specific figure has not been independently verified with a URL, the directional positioning is consistent across available 2026 commentary: CBA’s approximately 4.6-4.75% grossed-up range sits materially below its peers.
| Bank | Yield Characterisation | Key Income Attribute | Relative Risk Profile |
|---|---|---|---|
| CBA | Approximately 4.6-4.75% grossed-up (FY26-FY27) | Dividend consistency, earnings resilience | Lower credit losses, stronger capital position |
| NAB | Materially higher (approximately 7.6% grossed-up, directional) | Higher headline yield | Greater earnings variability |
| WBC | Materially higher than CBA (directional) | Higher headline yield | Greater asset-quality cyclicality |
| ANZ | Materially higher than CBA (directional) | Higher headline yield | Greater earnings variability |
Per-share FY26 and FY27 dividend forecasts for NAB, WBC, and ANZ from verifiable public sources were not available at the time of writing, so the comparison is directional rather than numeric. The qualitative conclusion, however, is consistent across every available source: the yield gap is real.
A direct comparison of big four bank income yields published in late April 2026 placed ANZ as the strongest contrarian income case at that time, with a confirmed raw yield of 4.58% and a grossed-up yield of approximately 5.95%, alongside a price-to-earnings ratio of 18.38x, figures that illustrate the structural valuation discount peers carry relative to CBA.
CBA’s lower yield reflects a deliberate trade-off investors accept in exchange for three income-quality differentiators:
- Capital strength: CBA maintains a strong capital position relative to peers, providing a buffer for dividend continuity through downturns
- Credit quality: historically lower loan loss rates than the other three majors
- Dividend consistency: a track record of steady payout growth since the post-COVID recovery period
The valuation problem that a 10% pullback has not fully resolved
CBA has historically traded at a significant premium to peers on earnings and book-value multiples. That premium is the structural reason its yield was lower to begin with: the market has priced in CBA’s quality, leaving less income upside for buyers at most price points.
A 10% correction is meaningful. It is not, based on the weight of available commentary across the Australian Financial Review, Livewire Markets, and Motley Fool Australia, sufficient to bring CBA into fair-value territory relative to the Big Four. Specific forward price-to-earnings multiples for CBA versus peers from verifiable 2026 public sources could not be located, so the valuation premium characterisation rests on consistent directional commentary rather than precise ratios.
Has the correction changed the premium case?
The Q3 FY26 update on 13 May 2026 is the most recent earnings disclosure informing the current valuation context. No new capital management programmes (buybacks, dividend reinvestment plan changes) have been announced since, based on ASX and CBA investor centre checks.
A 10% decline has compressed the premium, but available commentary does not suggest it has moved CBA to parity with peers on either yield or valuation. The absence of post-correction broker rating changes in accessible public sources limits the precision of this assessment; investors should monitor broker updates as they become available.
For readers wanting to quantify the valuation premium with a formal model, our full explainer on CBA’s DDM valuation applies dividend discount scenarios across a range of growth and discount rate assumptions, producing intrinsic value estimates between approximately $98 and $144 against a share price that has been trading at a material premium, and examines how CBA’s CET1 ratio decline from 12.3% to 11.6% limits the case for accelerated dividend growth.
Income quality over income size: who CBA’s dividend suits and who it does not
The pullback has created a better entry point. It has not created a different stock.
CBA suits investors who prioritise:
- Dividend consistency and a track record of steady post-COVID payout growth
- Lower credit risk exposure relative to peer banks
- Full franking with modest but reliable income growth (approximately 3% from FY26 to FY27)
- A conservative income allocation within a broader portfolio
Peers suit investors who prioritise:
- Higher headline grossed-up yield (directionally near 7.6% for NAB versus CBA’s 4.6-4.75%)
- Maximising current income even at the cost of greater earnings variability
- Comfort with higher asset-quality cyclicality across economic conditions
The core trade-off: CBA’s post-correction grossed-up yield of approximately 4.6% for FY26 and 4.75% for FY27 is meaningfully better than it was a fortnight ago, but it has not closed the gap with peers. The decision remains a quality-versus-yield choice, not a clear winner in either direction.
CBA’s dividend has grown consistently since the post-COVID recovery, with the FY26 to FY27 step representing approximately 3% growth. No capital management changes have been announced post-Q3, per ASX checks.
This article is for informational purposes only and should not be considered financial advice. Investors should conduct their own research and consult with financial professionals before making investment decisions.
CBA’s pullback is a better entry point, not a different investment
The sell-off has improved CBA’s income profile mechanically, lifting grossed-up yields to approximately 4.6% for FY26 and 4.75% for FY27. It has not transformed the stock’s fundamental yield position relative to NAB, WBC, and ANZ, all of which continue to offer materially higher income. The choice between CBA and its peers remains a quality-versus-yield trade-off that persists regardless of where the share price settles.
Two items warrant attention in the months ahead. CBA’s FY26 full-year results, expected in August 2026, represent the next confirmation point for dividend growth and payout policy. The more consequential signal will be whether the elevated collective provisions reported in Q3 translate into actual credit losses, a development that would directly affect FY27 dividend capacity. Until both questions are answered, the income case for CBA remains exactly what it has always been: reliable, fully franked, and lower than the alternatives.
Past performance does not guarantee future results. Financial projections are subject to market conditions and various risk factors.