
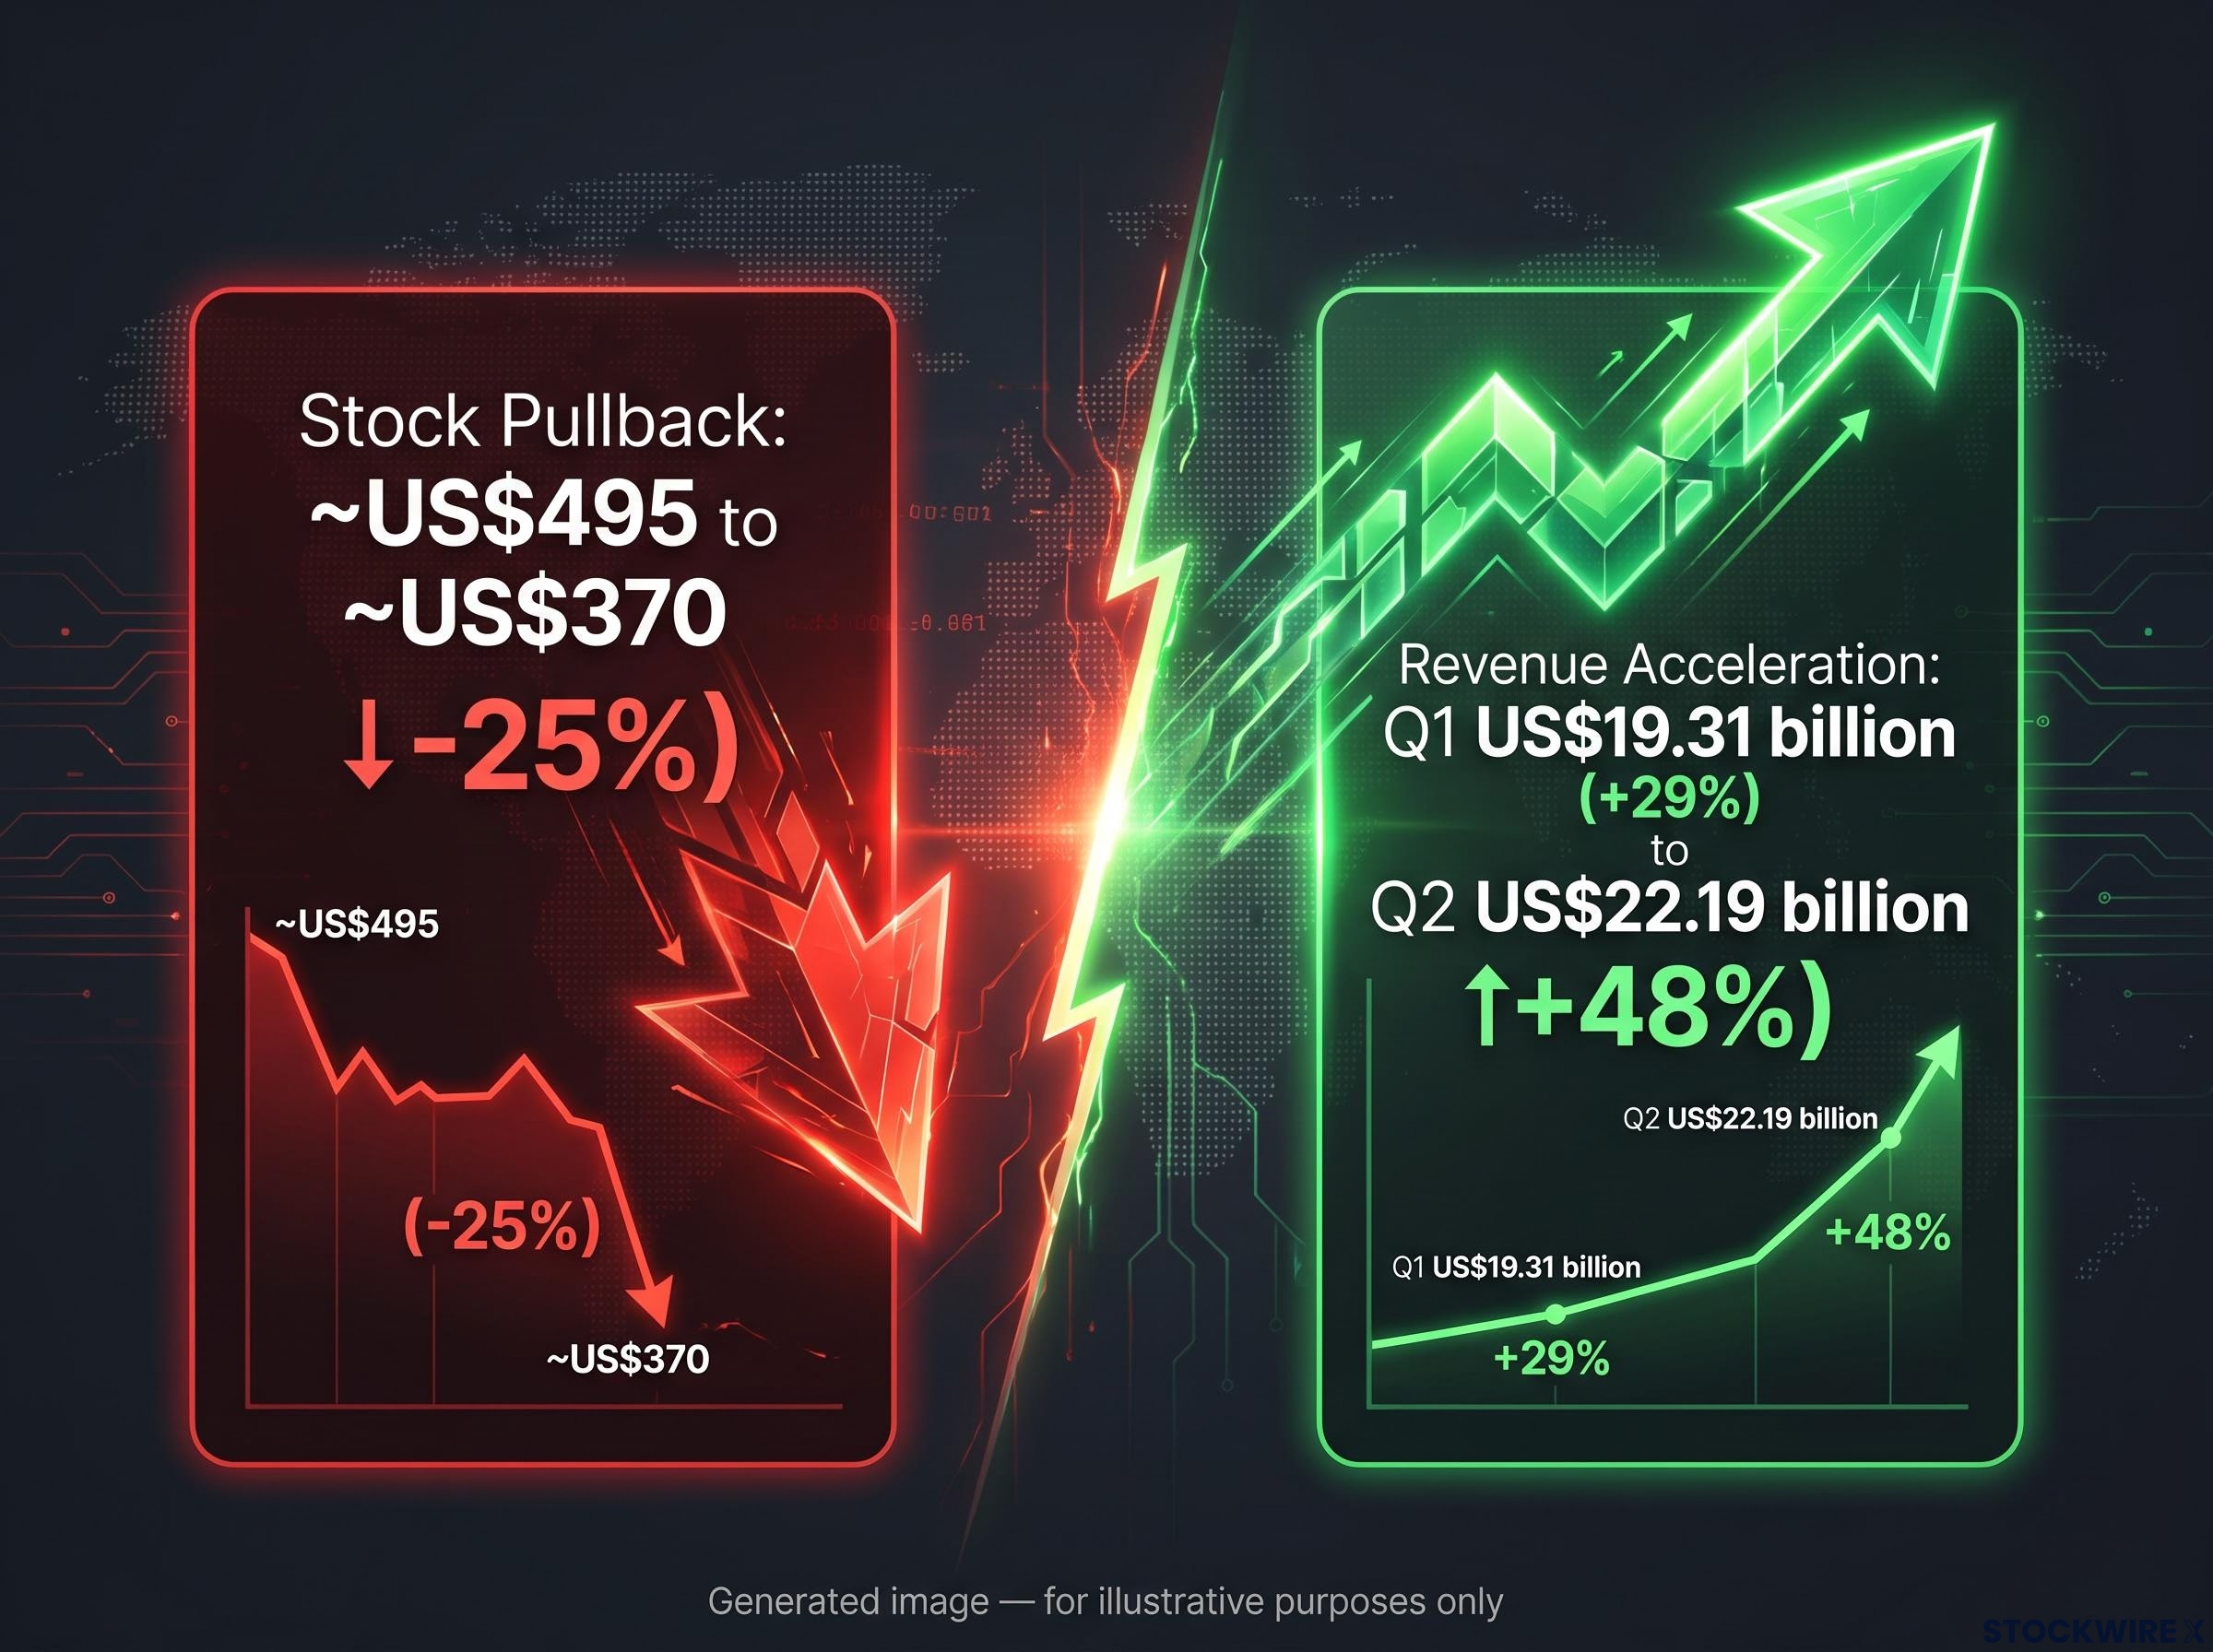
Broadcom shares are sitting roughly 25% below their recent high of approximately US$495, trading near US$370. Yet analyst consensus expects the company to report nearly US$29.5 billion in quarterly revenue on 2 September, a figure that would represent another massive year-over-year acceleration. The gap between stock performance and operational trajectory is the puzzle worth solving before the print lands.
Broadcom is not a simple semiconductor story. It operates as a hybrid of high-growth AI silicon and recurring enterprise software revenue, with the VMware acquisition reshaping its margin profile. That dual structure means the Q3 result will be read as a signal on two distinct investment theses simultaneously: AI infrastructure spending and enterprise IT resilience.
Here is the framework for understanding exactly what numbers to watch on 2 September, what management language would signal upside versus downside, and how to situate Broadcom’s result within the broader AI-exposed semiconductor trade.
What the pullback actually tells you about the setup going into Q3
The decline from approximately US$495 to approximately US$370 looks alarming in isolation. Taken against Broadcom’s recent operational trajectory, it tells a different story.
Consider what the company has actually delivered over the past two quarters:
- Q1 FY2026 revenue: US$19.31 billion, up 29% year over year; adjusted EPS: US$2.05 versus the US$2.03 estimate
- Q2 FY2026 revenue: US$22.19 billion, up 48% year over year; non-GAAP EPS: US$2.44 versus approximately US$2.39-2.40 estimate
Revenue growth has been accelerating, not deteriorating. The stock has moved in the opposite direction.
Q2 AI semiconductor revenue: US$10.8 billion, up 143% year over year.
That divergence between operational performance and share price tells you the market is pricing risk, not repricing fundamentals. The pullback reflects a partial de-risking of elevated valuation expectations that built up during the run to US$495. It does not reflect a broken thesis.
For you as an investor, the distinction matters. A 25% decline against a backdrop of consecutive quarters of accelerating revenue growth and consistent estimate beats statistically lowers the threshold a result needs to clear to trigger a positive price reaction. The bar entering 2 September is meaningfully lower than it was three months ago. That changes how you should read the Q3 print when it lands.
When big ASX news breaks, our subscribers know first
What Wall Street is pricing in for Q3 and why the bar is genuinely high
The consensus revenue estimate for Q3 sits at approximately US$29.4-29.5 billion. That is a very large number, implying continued sharp acceleration driven largely by AI semiconductor demand.
The Q3 GAAP EPS consensus stands at approximately US$2.55, which slots into a full-year FY2026 non-GAAP EPS consensus of approximately US$11.60. (A brief note: earlier research sources cited a lower FY2026 EPS figure near US$9.02, but more recent analyst updates cluster around the US$11.60 figure, which is used here as the more reliable estimate.)
| Metric | Q2 FY2026 (Actual) | Q3 FY2026 (Consensus) |
|---|---|---|
| Revenue | US$22.19 billion | ~US$29.4-29.5 billion |
| Non-GAAP EPS | US$2.44 | ~US$2.55 (GAAP) |
| Operating Margin (Non-GAAP) | ~67% | Not separately guided |
These are not modest expectations. The street has already committed to an optimistic base case, and that commitment raises the cost of any miss.
How the full-year picture amplifies what Q3 needs to do
Full-year FY2026 revenue estimates now sit near US$106 billion. Q1 and Q2 combined delivered approximately US$41.5 billion, meaning the implied second-half run rate is enormous.
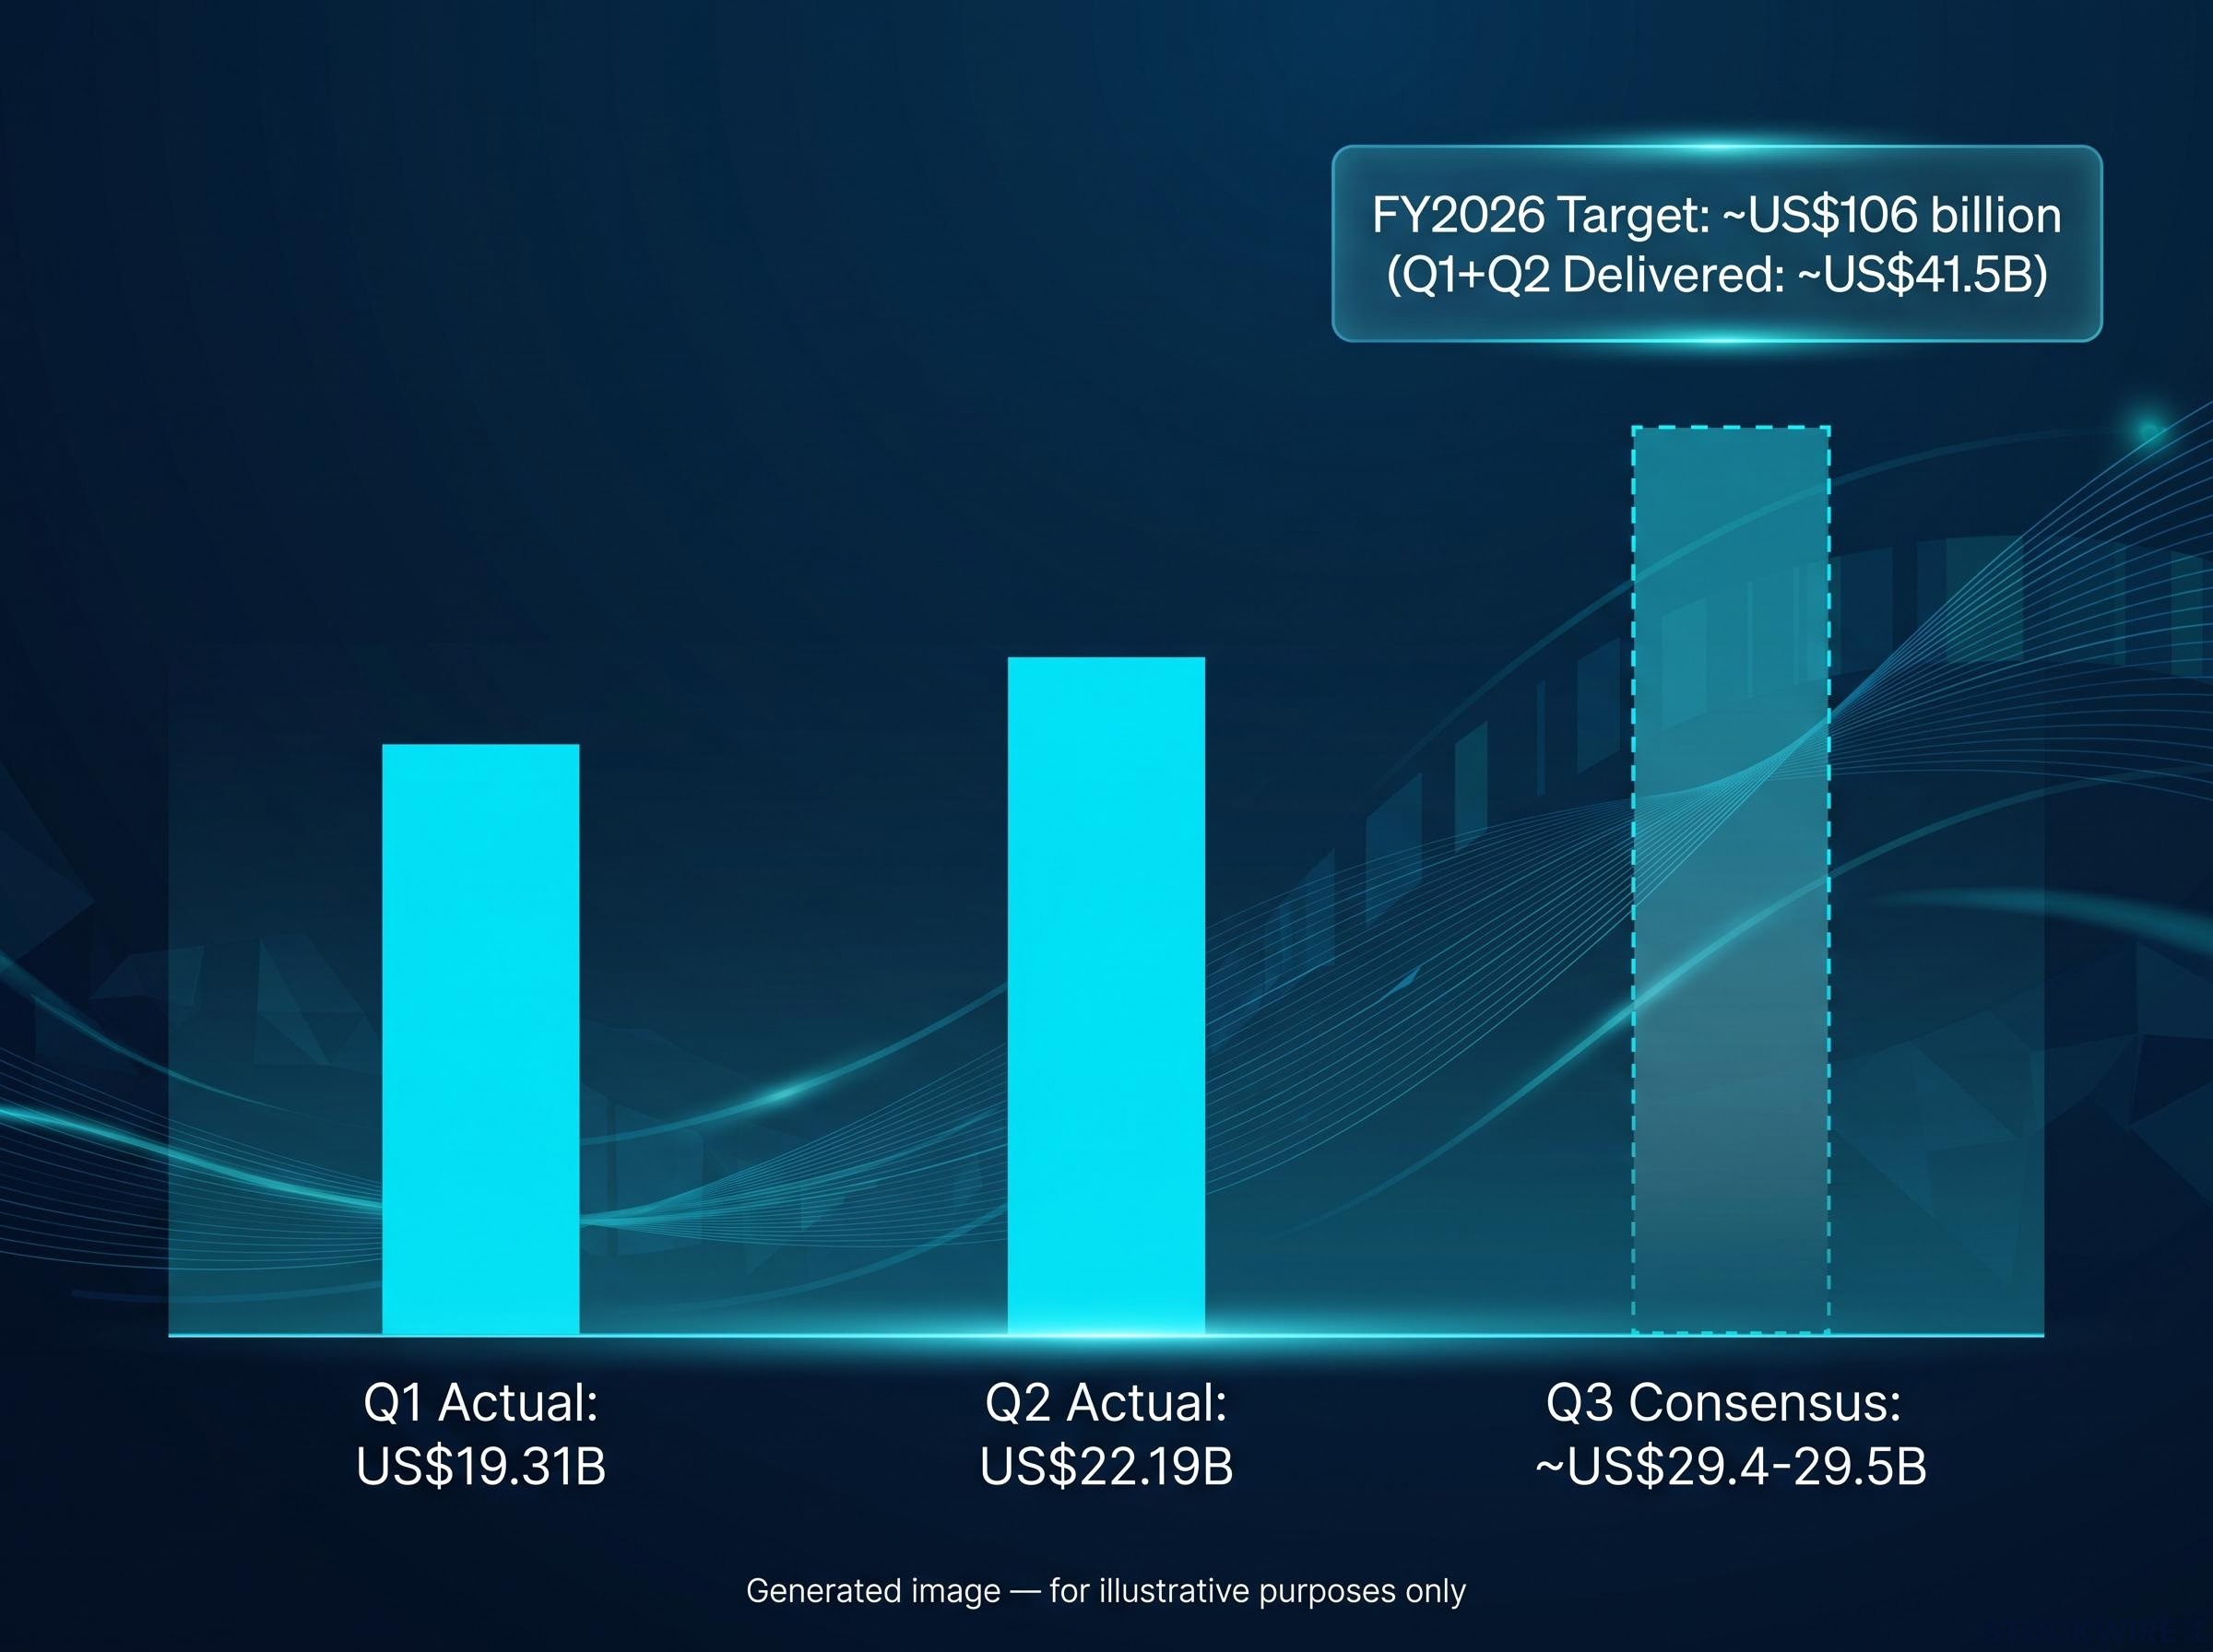
That arithmetic makes Q3 guidance, not just the Q3 result, the more market-moving variable. If management’s forward commentary implies a second half that falls short of the US$106 billion trajectory, estimate revisions would follow immediately, regardless of how strong the reported quarter looks.
For you, what this means is straightforward: a consensus this far ahead of the company’s own recent history narrows the margin for error. A beat that merely meets consensus may not move the stock, because the consensus is already baked into the price. The reward accrues to results that beat and raise.
The four variables that will determine how the market reacts
Semiconductor stocks trade on the forward path, not the reported quarter. That makes management guidance language typically more market-moving than the headline revenue figure. With that hierarchy in mind, here are the four swing factors to watch on 2 September, ordered by market sensitivity:
- Management guidance and FY2026 trajectory. This is the single most important variable. If management confirms or raises its revenue and margin trajectory for the remainder of FY2026, the market’s full-year models remain intact. Any cautious language, even without an explicit cut, could force simultaneous estimate and multiple compression. Watch for specific commentary on AI networking order visibility and customer capital expenditure plans.
- AI semiconductor demand signals. Q2’s AI semiconductor revenue of US$10.8 billion, up 143% year over year, sets a very high comparison base. The year-over-year growth rate in Q3 will be scrutinised intensely. Absolute dollar levels may continue to climb, but any visible deceleration in the growth rate itself will attract attention.
The baseline: US$10.8 billion in Q2 AI semiconductor revenue, up 143% year over year. That is the number Q3 has to build on.
- Margin and free cash flow discipline. Q2 delivered non-GAAP operating margins of approximately 67% and free cash flow conversion of approximately 46% of revenue, with adjusted EBITDA margins running at approximately 68-69% in recent quarters. At Broadcom’s scale, maintaining those levels while absorbing VMware integration complexity is the execution test. Deterioration in either metric, even modest, would attract scrutiny given the premium valuation.
Why VMware metrics deserve as much attention as the chip numbers
- VMware integration and software traction. The VMware acquisition was designed to tilt Broadcom’s revenue mix toward high-margin, recurring subscription-based software. Subscription conversion rates (the pace at which legacy VMware licence customers move to subscription contracts) and customer churn are the key metrics. Specific figures may not be broken out in detail, but management commentary on retention and recurring revenue trends will signal whether the integration is compounding or creating friction.
Improving VMware metrics would structurally support a higher earnings base independent of AI chip cycles, making the software segment a valuation stabiliser. That is why it deserves equal weight in your evaluation framework, even though the AI numbers will dominate the headlines.
Each of these four variables operates as a separate lever on the stock’s valuation. A strong result on three of four can still produce a muted market reaction if the fourth one, typically guidance, disappoints. Enter 2 September understanding that hierarchy.
How to weigh the bull and bear cases before the print
The bull case conditions
The upside scenario requires a specific set of conditions, not just a general positive mood:
- Another modest beat on revenue and EPS, extending the pattern from Q1 (US$2.05 versus US$2.03 estimate) and Q2 (US$2.44 versus US$2.39-2.40 estimate), which suggests Broadcom manages expectations conservatively
- Firm or raised AI semiconductor and VMware guidance that keeps the full-year US$106 billion revenue consensus trajectory intact
- Non-GAAP operating margin maintained at or above 67%, confirming that scale and software mix shift are compounding efficiently
- Confident management commentary on AI networking order visibility, reinforcing the view that hyperscale capital expenditure remains early-cycle
A clean beat plus raised guidance in this environment, with the stock already 25% off its high, could re-justify a premium valuation and trigger positive read-through across other AI-levered semiconductor names.
The bear case conditions
The downside scenario is equally specific:
- Any softening in AI networking order commentary, even qualitative, suggesting capital expenditure normalisation is arriving sooner than the market assumes
- Early signs of VMware customer attrition or slower-than-expected subscription conversion, undermining the margin expansion thesis
- Q3 guidance that implies second-half revenue below the US$106 billion full-year consensus trajectory, forcing estimate downgrades
- AI semiconductor revenue growth rate visibly decelerating from Q2’s 143% year-over-year pace, even if absolute dollar levels continue rising
The practical takeaway is that the asymmetry currently runs slightly toward downside risk from a volatility standpoint. Consensus expectations are high enough that a clean beat may merely stabilise the stock, while a miss could push it further below the recent range. Framing both cases with this specificity lets you form a pre-trade plan rather than reacting emotionally to the headline on 2 September.
What September 2 will actually tell you about the AI trade
Broadcom’s Q3 numbers are scheduled to drop on 2 September 2026 at 5:00 p.m. EDT (Thursday morning Australian time), placing it among the final significant AI-exposed results of this reporting cycle. With most of the US earnings season already behind us, the result carries interpretive weight that extends well beyond Broadcom itself, effectively serving as a late-cycle verdict on whether the AI infrastructure build-out is tracking at the scale investors have assumed.
The question on 2 September is not just whether Broadcom beat consensus. It is whether the underlying AI infrastructure cycle, the one underpinning valuations across the semiconductor and cloud infrastructure space, is sustaining at the pace investors have priced in.
A strong result with confident AI commentary would provide a tangible data point supporting continued AI capital expenditure momentum, with positive read-through to:
- AI networking and custom silicon suppliers
- Cloud infrastructure providers exposed to hyperscale build-outs
- Enterprise software names benefiting from VMware-style subscription conversions
Whether you hold Broadcom or not, the 2 September result will update the market’s confidence interval around the AI infrastructure thesis. That update will ripple through valuations across the sector for weeks. Understanding Broadcom’s print as a sector signal, not just a single-stock event, gives you a broader framework for evaluating other AI-exposed positions in your portfolio.
This article is for informational purposes only and should not be considered financial advice. Investors should conduct their own research and consult with financial professionals before making investment decisions. Forward-looking statements and consensus estimates reflect market conditions as of late August 2026 and are subject to revision based on market developments and company performance.
—