Commonwealth Bank posted a record cash profit. Westpac hit a 52-week low. NAB and ANZ delivered steady quarterly results. And then all four lost billions in market capitalisation over the same month.
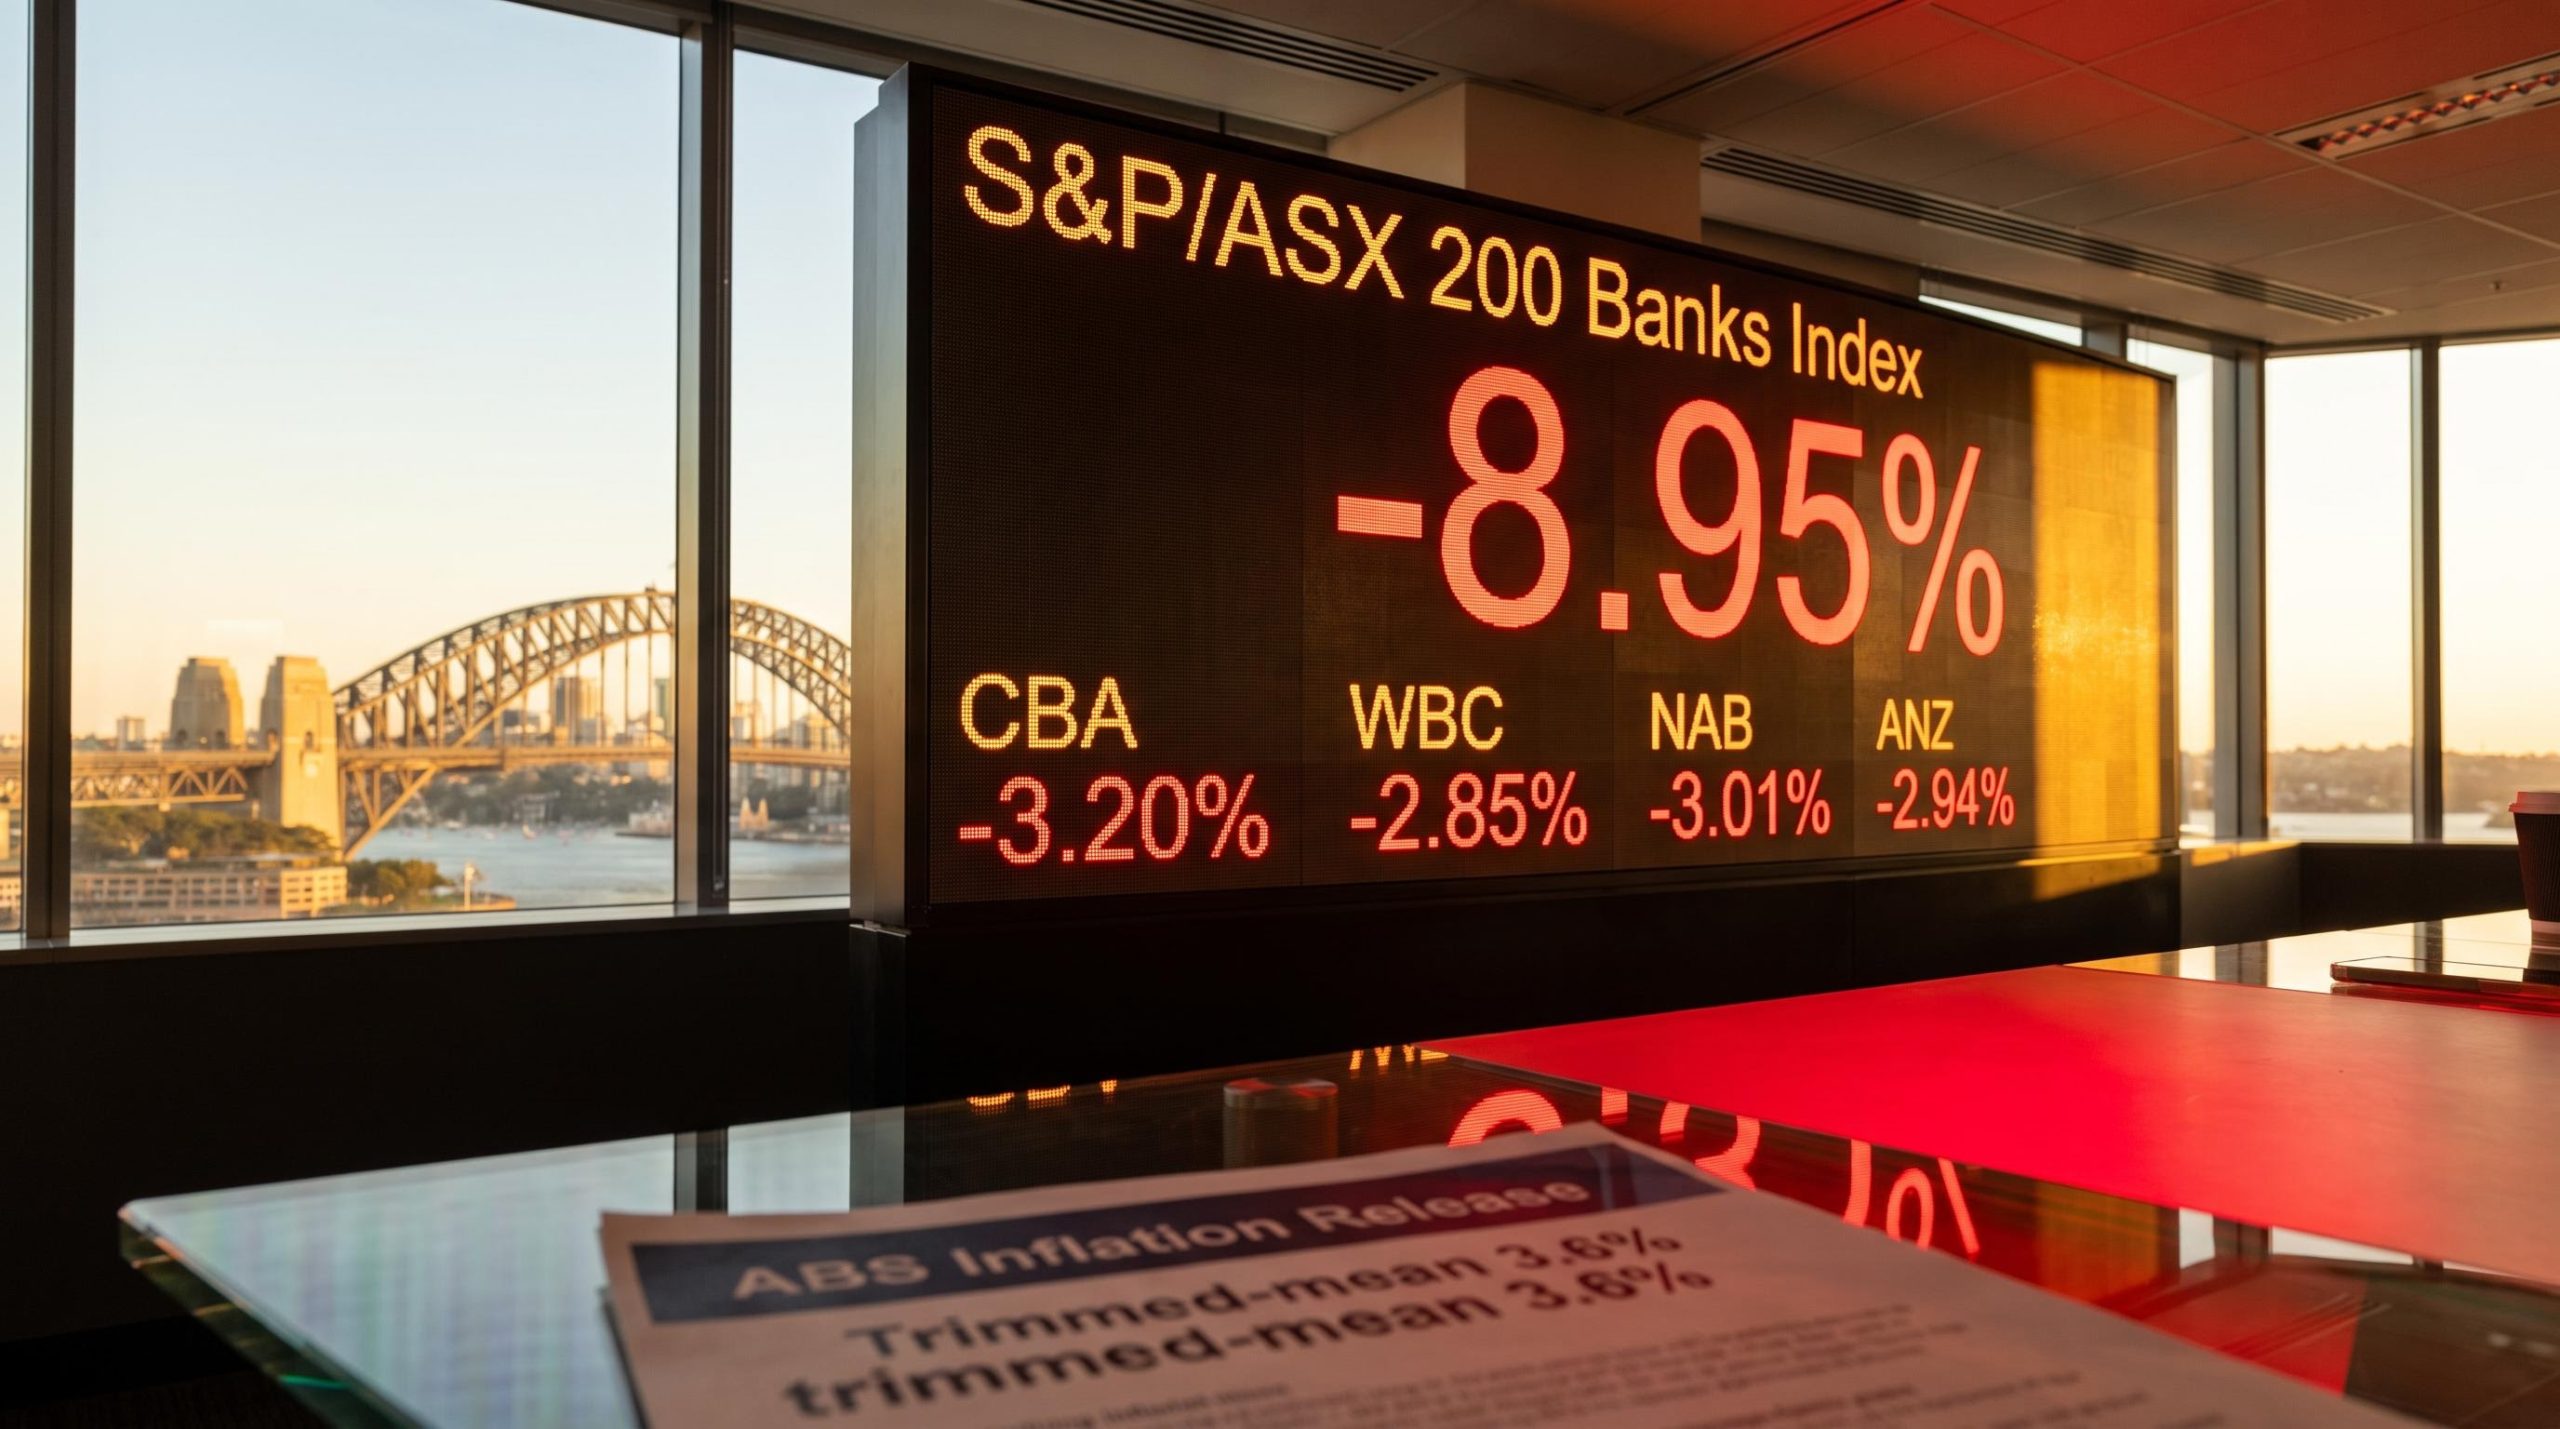
August 2026 was not a panic. It was a repricing. The Australian Bureau of Statistics (ABS) published its July inflation data on 26 August 2026, revealing trimmed-mean inflation unchanged at 3.6%, still well above the Reserve Bank of Australia’s (RBA) 2-3% target band. The S&P/ASX 200 Banks Index fell approximately 8.95% over the month, with individual declines ranging from roughly 2% at ANZ to approximately 12% at CBA. The question investors had been asking, “when do rates fall?”, was replaced by a harder one: how much further could they rise?
Here is what the data tells you about whether this sell-off reflects a structural re-rating of ASX bank stocks or a sentiment overshoot the sector can recover from, and what that distinction means for your existing bank exposure right now.
Why an unchanged inflation number detonated a sector-wide sell-off
A month earlier, things had looked different. June’s softer headline Consumer Price Index (CPI) print had briefly cooled rate-hike expectations. Bank shares stabilised. The consensus was fragile, but it pointed toward the end of the tightening cycle.
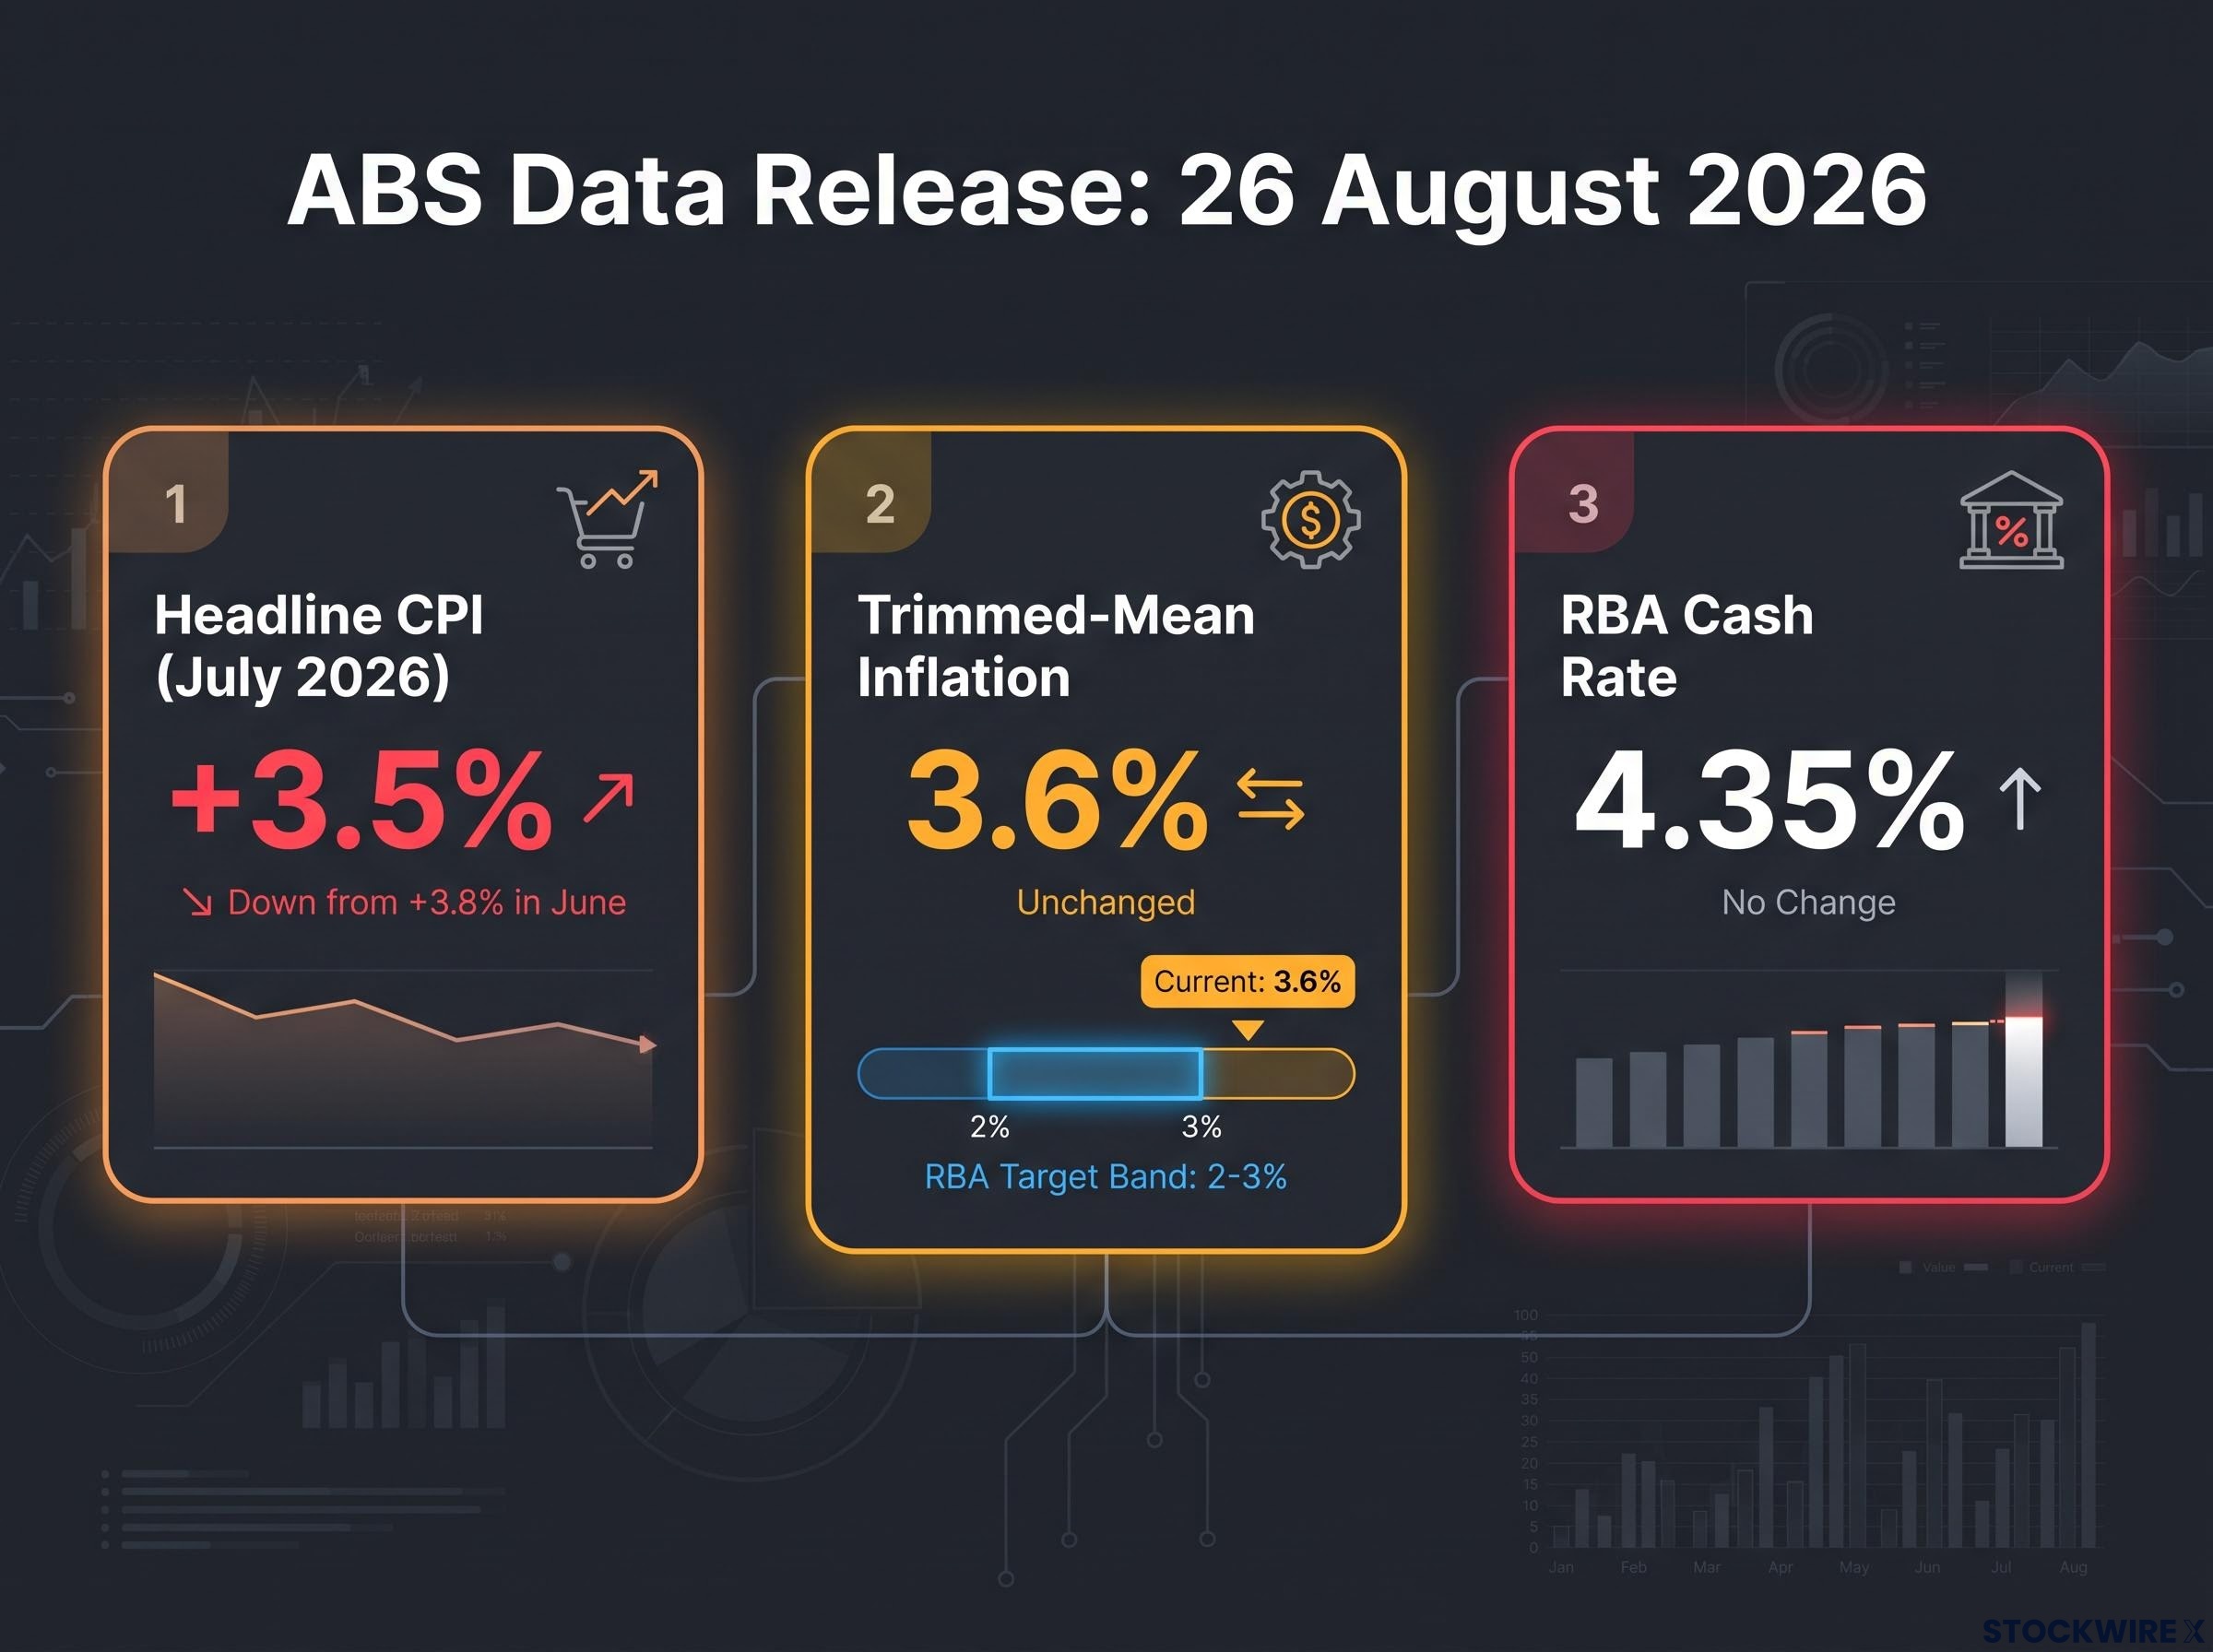
The 26 August ABS release broke that consensus in a single data point. July headline CPI came in at +3.5% year-on-year, down from +3.8% in June, a modest improvement on the surface. But trimmed-mean inflation, the underlying measure the RBA watches most closely, held at 3.6%, unchanged from prior readings and stubbornly above the central bank’s target.
The RBA targets trimmed-mean inflation rather than headline CPI because volatile items like fuel and government-administered prices can distort the headline figure in either direction without reflecting genuine price pressure in the underlying economy.
The key figures:
- Headline CPI (July 2026): +3.5% year-on-year, down from +3.8% in June
- Trimmed-mean (underlying) inflation: 3.6%, unchanged
- RBA cash rate: 4.35%
- RBA inflation target band: 2-3%
- ABS data release date: 26 August 2026
The RBA had already flagged at its August meeting that inflation remained too high and that trimmed-mean inflation had barely improved since the March quarter. The unchanged July reading confirmed that assessment with hard data.
The market reaction was swift. Leading Australian banks updated their rate outlooks, with a number now pencilling in a further hike before the end of September 2026. Australian shares erased early gains on the release day, and financials led the move lower.
What the unchanged trimmed-mean reading tells you is that the RBA’s tightening cycle is not over. Repricing bank stocks lower was not an overreaction; it was a rational response to a rate path that just became materially less certain. For investors holding bank shares through this period, that distinction between a temporary sentiment shock and a genuine shift in the rate outlook is the first thing to get right before making any portfolio decision.
When big ASX news breaks, our subscribers know first
Record profits, falling share prices: how equity markets price future risk
Equity markets are discounting mechanisms, meaning prices reflect not what a company just earned but what investors expect it to earn over the next 12-24 months. By the time CBA reported a record cash profit, that result was already baked into a share price that had run hard through the first half of 2026. The question was never whether the most recent quarter was strong. It was whether the next several quarters could sustain that strength under a changed macro environment.
The ASX bank valuation premium was already under scrutiny before the August sell-off, with Australian banks trading at roughly 27-28 times forward earnings against a long-run average of 18 times and delivering only around a third of the returns posted by European and UK bank peers in 2026.
They might not. And the market priced that view decisively.
| Bank | August 2026 decline | Share price (late August) | Key earnings note |
|---|---|---|---|
| CBA | ~12% | ~$155.68 | Record cash profit |
| Westpac | ~11% | ~$33.83 | Soft quarterly update |
| NAB | ~8% | ~$38.06 | Steady quarterly results |
| ANZ | ~2% | ~$36.54 | Steady quarterly results |
CBA’s record profit did not save it from the steepest decline in the group. ANZ’s relatively modest 2% fall made it the outlier. The pattern is consistent: strong backward-looking earnings did not insulate any of the four from a forward-looking repricing.
How margin compression becomes the next earnings story
The specific mechanism threatening future profitability is net interest margin (NIM) compression. A bank’s NIM is the difference between what it earns on loans and what it pays for funding and deposits, effectively the core profit engine of retail banking.
As funding costs rise and deposit pricing becomes more competitive, that margin narrows. Banks cannot simply pass all higher costs through to mortgage borrowers without losing loan volume in a housing market that is already slowing. Analyst commentary around the August results pointed to emerging NIM compression, with several observers warning that margins may have peaked in this cycle.
Westpac’s near-5% single-day fall following its soft quarterly update illustrates how directly NIM concerns translate into price action. The stock reached a 52-week low in August, and the financials sub-index recorded its biggest intraday loss in three months on that session.
Compounding the margin squeeze, the big four disclosed double-digit percentage falls in new mortgage applications, driven by recent tax policy changes and higher interest rates. New lending is a major revenue driver for retail banking. When the pipeline shrinks, even stable current margins cannot protect forward earnings growth. That is the gap between what last quarter’s profit told you and what the next several quarters may deliver.
Why the big four’s weight in the ASX 200 turns a sector story into a portfolio event
If you hold a diversified Australian equity fund, a balanced superannuation option, or an index fund tracking the ASX 200, you already have significant bank exposure whether you chose it or not.
ASX 200 concentration risk is not a new phenomenon: financials and materials alone account for more than 50% of the index by market-cap weight, meaning the August bank repricing delivered its full force to passive investors who had made no active decision to hold bank shares.
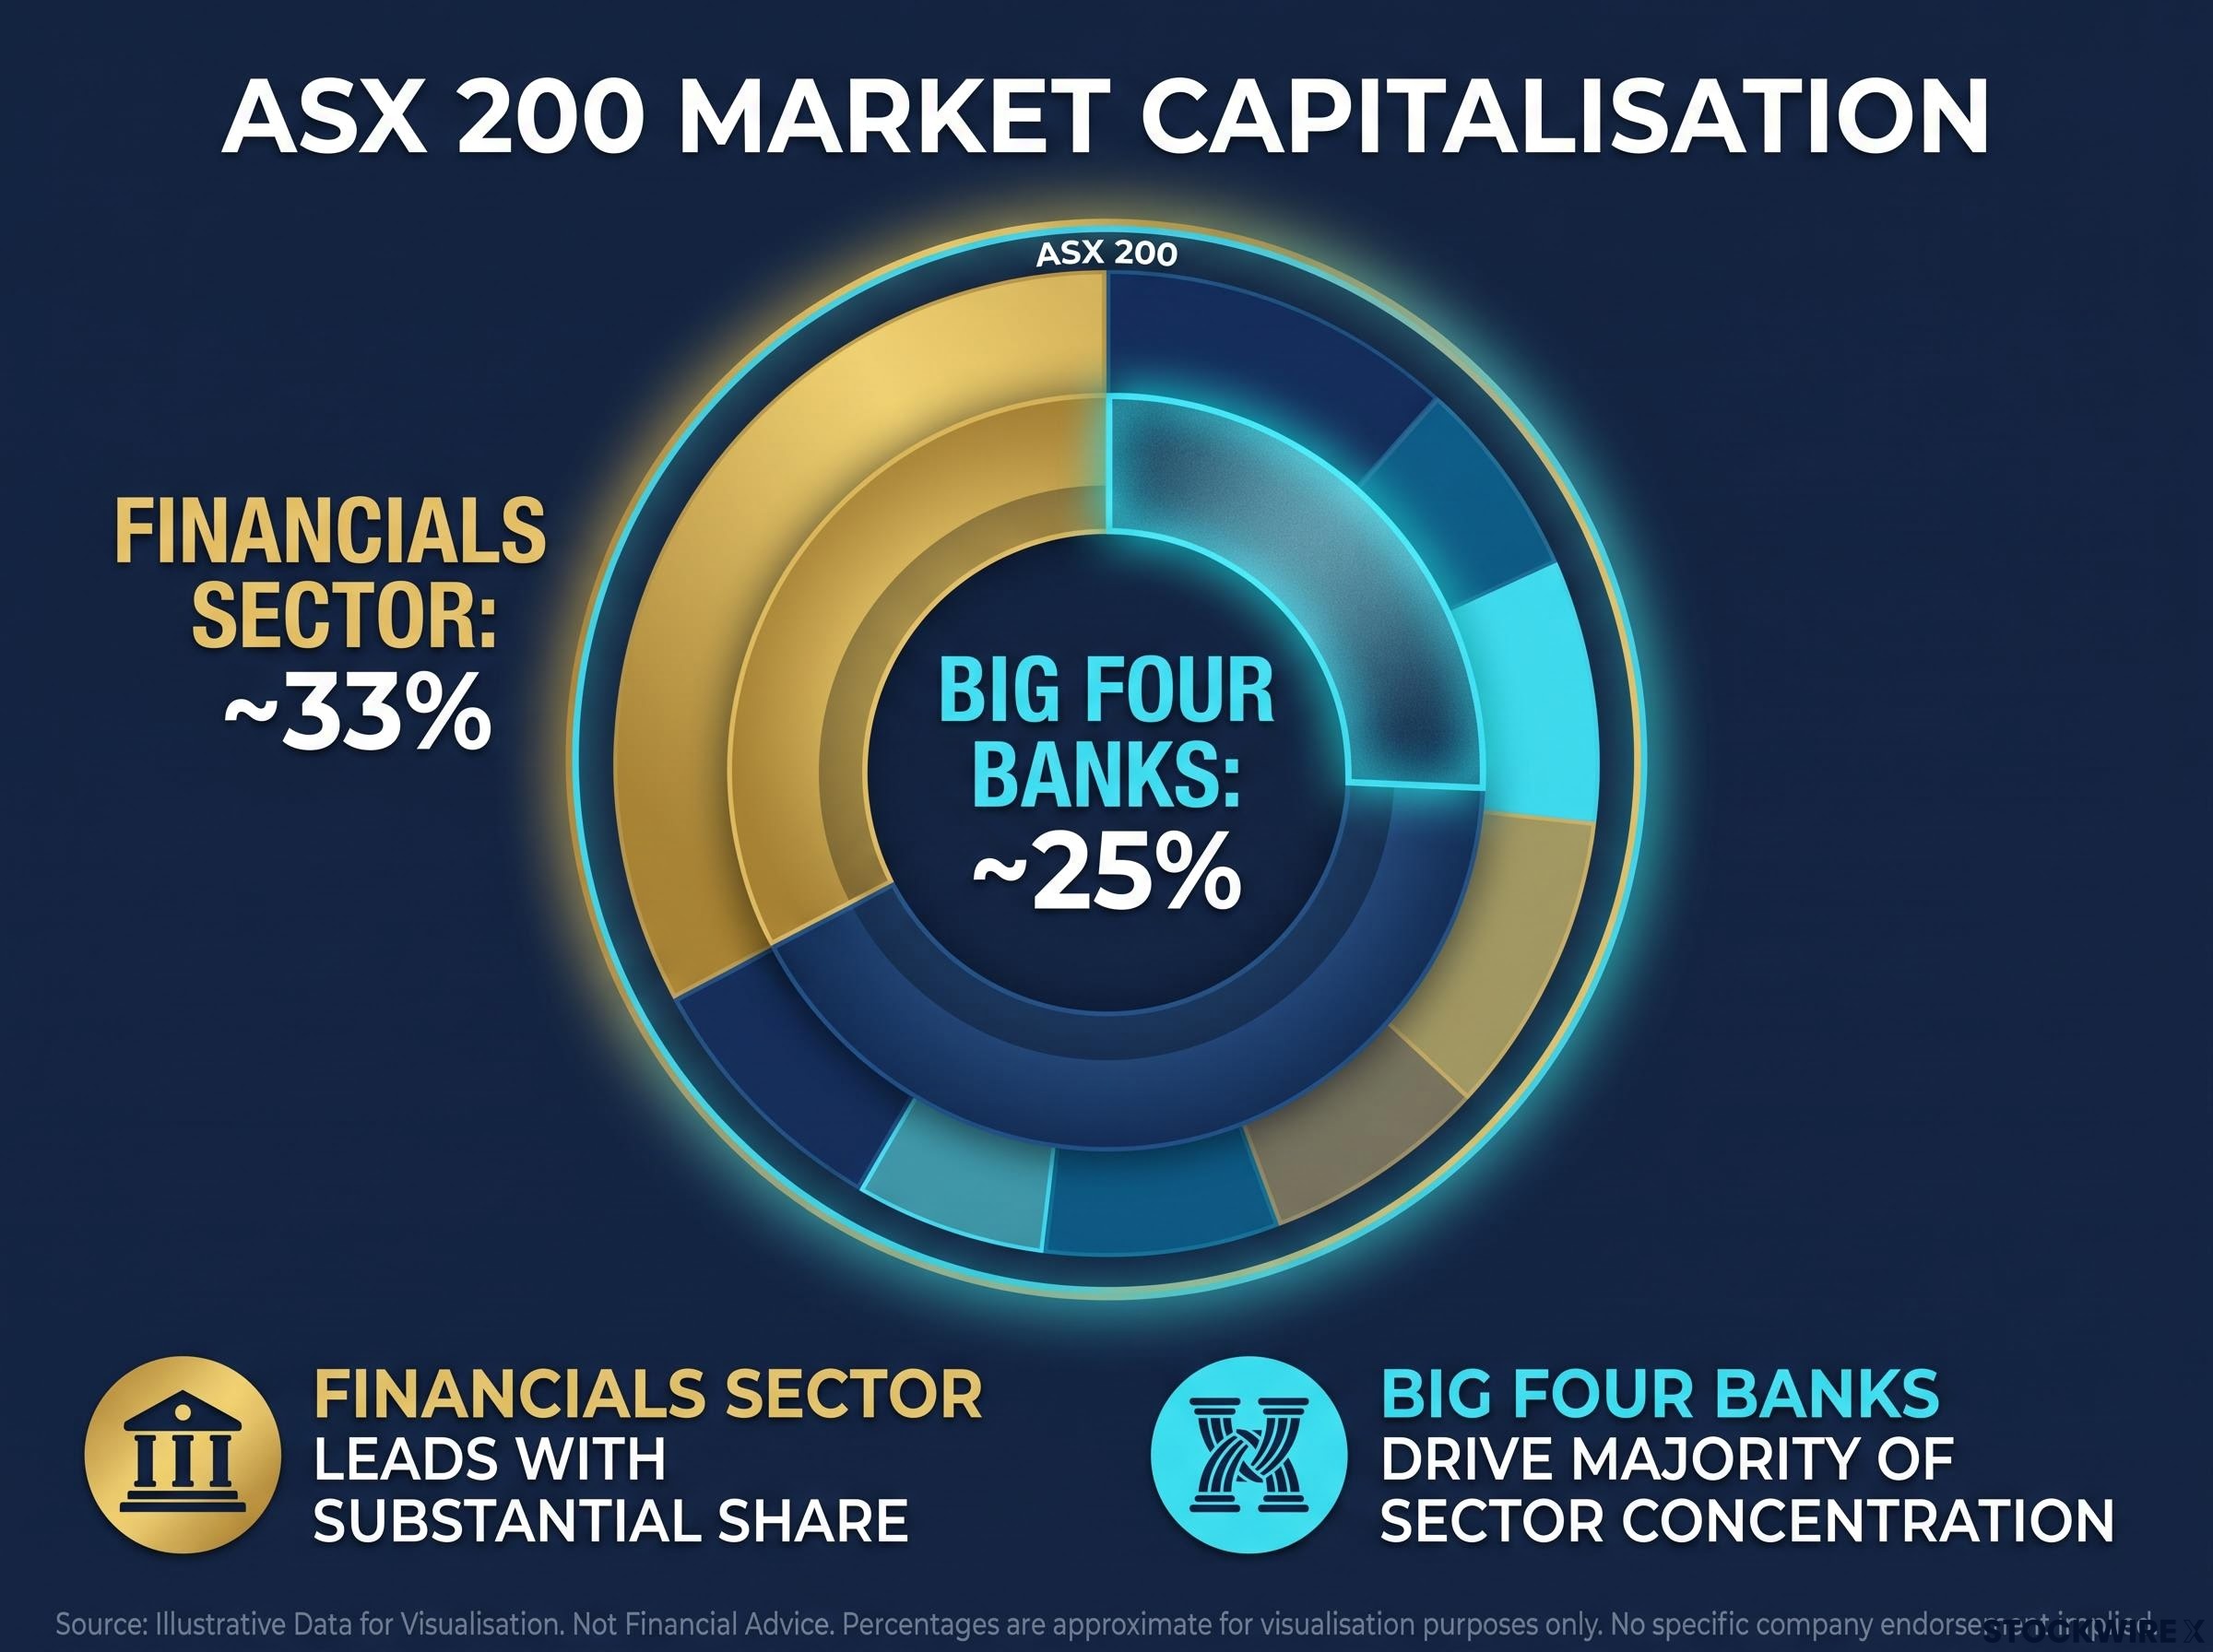
The big four’s combined weight in the ASX 200 sits at roughly one quarter of the index by market capitalisation. Financials as a whole account for roughly one-third of the index by some estimates. When bank shares fall 8-12% in a single month, the benchmark follows. The ASX 200 repeatedly closed lower on key inflation and results days in August, with banks and retail stocks identified as the primary drags.
The key concentration data:
- Big four share of ASX 200: approximately 25% by market capitalisation
- Financials sector share of ASX 200: approximately one-third by some estimates
- S&P/ASX 200 Banks Index decline: approximately 8.95% over the one-month period to late August 2026
Sector-specific stress in the big four becomes a whole-of-portfolio event for most domestic investors. A 25% concentration in four bank stocks is not diversification in any meaningful sense.
For superannuation funds and passive investors, the August drawdown was driven by concentrated exposure to a handful of large lenders rather than broad-based weakness across all sectors. Most retail investors are not choosing to hold bank stocks directly, yet they are absorbing their performance through index funds and managed portfolios.
That reframing matters. If you evaluated August’s damage as a “bank sector problem,” you likely underestimated how much of the drawdown landed in your own portfolio. The systemic weight of the big four means their repricing is your repricing, regardless of whether you own a single bank share directly.
Three variables that will determine whether August was a correction or the start of a re-rating
The analysis so far explains what happened and why. The harder question is what happens next. Three variables will resolve the ambiguity, and each one is trackable.
- The RBA’s September 2026 decision. A rate hike accompanied by hawkish language extends pressure on bank shares by reinforcing the “higher for longer” narrative and heightening household debt-servicing concerns. A hold, particularly if accompanied by evidence of easing inflation or language suggesting the cycle is near its end, opens the door to a sentiment recovery and a relief rally in financials. A number of leading banks have already updated their rate forecasts to include a further hike in September.
- Housing activity and mortgage pipeline data. With the big four already disclosing double-digit falls in new mortgage applications, trends in home-loan volumes and auction clearance rates will shape expectations for loan growth. This is the leading indicator: if mortgage demand continues to contract, forward revenue estimates come under further pressure.
- Credit-quality data. This is the lagging indicator, but it carries the most weight for long-term earnings.
Reading the credit-quality signal
Quarterly updates on arrears, hardship arrangements, and corporate impairments will reveal whether higher rates are translating into real stress on household and business loan books. Analysts will watch mortgage delinquency trends, hardship arrangement volumes, and small-business loan impairments as early indicators of debt-servicing strain.
The risk is not an immediate surge in bad debts. It is a gradual deterioration that compresses provisioning buffers and forces banks to set aside more capital against future losses, eating into the profit line even if headline revenues hold steady. Westpac’s slide to a 52-week low in August already priced in some of this concern. Whether the credit data confirms or eases those fears will determine how the next leg of bank stock performance unfolds.
One corporate event worth noting: CBA received partial share price support late in the month from the settlement of a long-running class action lawsuit around 26 August 2026. Individual events like this can create noise within the broader macro trend, which is why monitoring the three structural variables matters more than reacting to any single day’s price action.
What this framework gives you is a concrete monitoring checklist. Rather than waiting for a vague “things to improve,” you now know exactly which data points will signal whether the sell-off was a correction or the beginning of something larger.
What August’s sell-off changes about how to think about bank stock valuations
The core analytical takeaway from August is straightforward: the sell-off was a forward repricing of risk under sticky inflation and potential late-cycle rate hikes, not a verdict on current profitability. Investors who evaluate bank stocks should do so on that basis going forward.
Late-cycle rate hikes are double-edged. Moderate increases can expand NIMs, but hikes driven by stubborn inflation at an already-elevated cash rate of 4.35% raise household debt-servicing risk and potential provisioning needs that can outweigh margin benefit. The question is no longer whether banks are profitable today. It is whether that profitability can survive the combined pressure of NIM compression, shrinking mortgage volumes, and a potential uptick in loan losses.
Three metrics now sit at the centre of any bank stock assessment:
Bank stock stress-testing under a higher-for-longer rate scenario requires adjusting both the revenue side (NIM trajectory and loan volume assumptions) and the cost side (provisioning buffers and potential impairment charges), inputs that interact in ways a simple PE ratio or dividend yield screen cannot capture.
- NIM trajectory: Whether margins have peaked and how quickly they compress under competitive deposit pricing and constrained mortgage repricing
- Credit-quality trends: Mortgage arrears, hardship volumes, and small-business impairments as leading indicators of provisioning risk
- Trimmed-mean inflation path: Currently at 3.6% against the RBA’s 2-3% target band, this is the variable that determines the rate path, which in turn drives everything else
Holding Australian bank stocks now requires a view on inflation and household resilience, not just dividend yield. The August repricing has reset the analytical framework for the sector. Given that the big four account for close to a quarter of the ASX 200 by market capitalisation, that reset is not confined to investors who actively chose bank exposure. It applies to virtually every Australian with domestic equity holdings.
This article is for informational purposes only and should not be considered financial advice. Investors should conduct their own research and consult with financial professionals before making investment decisions. Past performance does not guarantee future results. Forward-looking statements regarding rate decisions, inflation trends, and bank earnings are subject to change based on market developments and economic conditions.