
Bendigo and Adelaide Bank (ASX: BEN) shares are trading at approximately $10.40 in late May 2026, yet a dividend discount model built on forecast dividends and franking credits points to an estimated fair value of $19.64 per share. That gap demands scrutiny, not assumption. Cash earnings are recovering modestly, the net interest margin is widening, and the fully franked dividend stream remains intact. But on the two metrics that matter most to long-term equity investors, return on equity and CET1 capital adequacy, BEN trails its ASX banking peers. What follows is a metric-by-metric benchmark of BEN across five measurable dimensions: net interest margin, return on equity, capital adequacy, workplace culture, and dividend discount valuation. The aim is not a directional call but a structured framework for evaluating where the Bendigo Bank share price sits relative to what the bank actually delivers.
Where BEN’s profitability engine runs hot: net interest margin versus the sector
BEN’s net interest margin (the spread between what a bank earns on its loans and what it pays depositors) is the bank’s clearest point of outperformance. At 1.9% for the most recent full financial year, BEN sits comfortably above the ASX major bank average of 1.78%, a gap of 12 basis points that has widened over recent halves.
NIM comparison: BEN’s 1.9% versus the major bank average of 1.78% represents a meaningful lending efficiency advantage for a regional bank competing against scale-driven incumbents.
The trajectory reinforces the signal:
- 1H25 NIM: 1.88%
- 1H26 NIM: 1.92% (up 4 basis points half-on-half)
- ASX major bank average NIM: 1.78%
Lending income accounts for approximately 87% of BEN’s total revenue, making NIM uniquely consequential for this bank’s earnings profile. A small move in the margin has an outsized effect on the bottom line.
The tension sits in what happens after the margin is earned. A NIM above the sector average suggests strong lending efficiency, yet BEN’s return on equity still lags its peers. Something between the loan book and the shareholder absorbs that advantage, and the next section traces exactly where it goes.
When big ASX news breaks, our subscribers know first
What return on equity reveals about BEN’s capital efficiency
Return on equity measures the annual profit generated for every $100 of shareholder equity on the balance sheet. It is the metric that connects a bank’s operational performance to the return its shareholders actually receive.
BEN’s ROE of 7.9% for the most recent full financial year falls 145 basis points short of the sector average of 9.35%. In practical terms, BEN generates roughly $1.45 less profit per $100 of equity than the average ASX-listed bank.
A bank earning below its cost of equity threshold is, in analytical terms, destroying value even while paying dividends, which reframes BEN’s ROE gap not as a minor lag but as a question of whether the earnings base structurally justifies the current capital allocated to it.
| Metric | BEN | Sector Average | Gap |
|---|---|---|---|
| Return on Equity | 7.9% | 9.35% | -145 bps |
| Profit per $100 Equity | $7.90 | $9.35 | -$1.45 |
The 1H25 result was starker still: ROE of 7.55%, down 99 basis points on the prior comparative period, even as cash earnings for FY25 came in at $514.6 million.
The cost structure dragging on equity returns
The cost-to-income ratio explains the disconnect. At 61.5% in 1H25, BEN spends more of each revenue dollar on operating expenses than its major bank peers, effectively consuming the NIM advantage before it reaches shareholders.
There is a modest signal of improvement. Cash earnings in 1H26 rose to $256.4 million, up 2.8% on the prior half, suggesting cost discipline may be gaining traction. Whether this trajectory holds through the full-year FY26 result is the variable most worth monitoring. The NIM advantage is real; the question is whether BEN’s cost base will allow it to flow through.
Understanding CET1: the capital buffer that protects shareholders in a downturn
Common equity tier 1 (CET1) measures the proportion of a bank’s risk-weighted assets held as high-quality, loss-absorbing capital. It is the metric the Australian Prudential Regulation Authority (APRA) treats as the primary gauge of a bank’s ability to absorb losses without requiring external support. A higher CET1 ratio means a larger buffer between current conditions and the point at which a bank’s capital position comes under stress.
APRA Prudential Standard APS 110 sets the minimum CET1 ratio for Australian authorised deposit-taking institutions at 4.5%, with an additional capital conservation buffer of 2.5%, while also granting APRA discretion to impose higher requirements on individual ADIs, which explains why the effective supervisory target range sits well above the regulatory floor.
APRA’s typical target range sits at approximately 11.0% to 11.5%. BEN has operated within that band, but the direction across recent reporting periods warrants attention.
| Period | BEN CET1 | Major Bank Range (indicative) | APRA Target Range |
|---|---|---|---|
| 1H25 (31 Dec 2024) | 11.17% | 11.5%-12.3% | 11.0%-11.5% |
| FY25 (30 Jun 2025) | 11.00% | 11.5%-12.3% | 11.0%-11.5% |
| 1H26 (early 2026) | 10.93% | 11.5%-12.3% | 11.0%-11.5% |
One structural caveat is worth noting. BEN uses the standardised approach to calculating risk-weighted assets, while the major banks use the internal ratings-based (IRB) approach. The IRB methodology typically produces lower risk weights, making direct numerical comparisons between BEN and the Big Four potentially misleading. Some commentary suggests BEN’s CET1 appears approximately 26% higher than the major bank average on a like-for-like standardised basis, though this figure has not been independently confirmed against primary source documents.
Three points for investors to hold:
- BEN remains APRA-compliant, but CET1 has drifted from 11.17% to 10.93% across three consecutive reporting periods, a direction worth watching particularly if credit conditions deteriorate.
- The standardised versus IRB methodology gap means the headline CET1 difference between BEN and the majors overstates the actual capital position gap.
- Liquidity coverage ratio (LCR) and net stable funding ratio (NSFR) are both maintained above 100%, consistent with APRA requirements.
The relationship between CET1 adequacy and dividend sustainability in a credit downturn is not abstract: BOQ’s thinner capital buffer relative to the major bank range has generated persistent questions about payout continuity that have weighed on its market valuation independent of headline yield, a dynamic that informs how investors should read BEN’s own CET1 drift.
Culture scores as a leading indicator: what BEN’s Seek rating tells long-term investors
Employee culture scores occupy an unusual space in financial analysis. They are not balance sheet metrics, and a single platform rating carries obvious limitations (self-selected respondents, platform-specific sample bias). Yet long-term investors increasingly incorporate these signals into qualitative due diligence, and the data point is worth considering alongside the financial metrics.
Culture comparison: BEN scores 2.9 out of 5.0 on Seek’s employee review platform, versus a banking sector average of 3.1 out of 5.0. Source: Seek employee review platform, analysis by Rask Invest Research Team.
The 0.2-point gap is not large in isolation, but it sits below the sector average on a metric that long-term investors treat as a proxy for three operational risk factors:
- Talent retention cost: Below-average sentiment increases the risk of elevated turnover and the associated expense of recruiting and training replacements.
- Service quality consistency: Staff dissatisfaction can surface in customer-facing service, particularly in a branch-heavy model.
- Management effectiveness signal: Culture scores can reflect employee confidence in leadership direction, a qualitative factor that financial metrics alone do not capture.
A below-average culture score does not disqualify BEN as an investment. It does, however, surface a potential operational risk that pure financial metrics cannot capture, and one that income-focused investors with long holding periods should weigh alongside the dividend arithmetic.
The full scorecard: a side-by-side benchmark of BEN versus ASX banking peers
The four metrics above consolidate into a single comparative view.
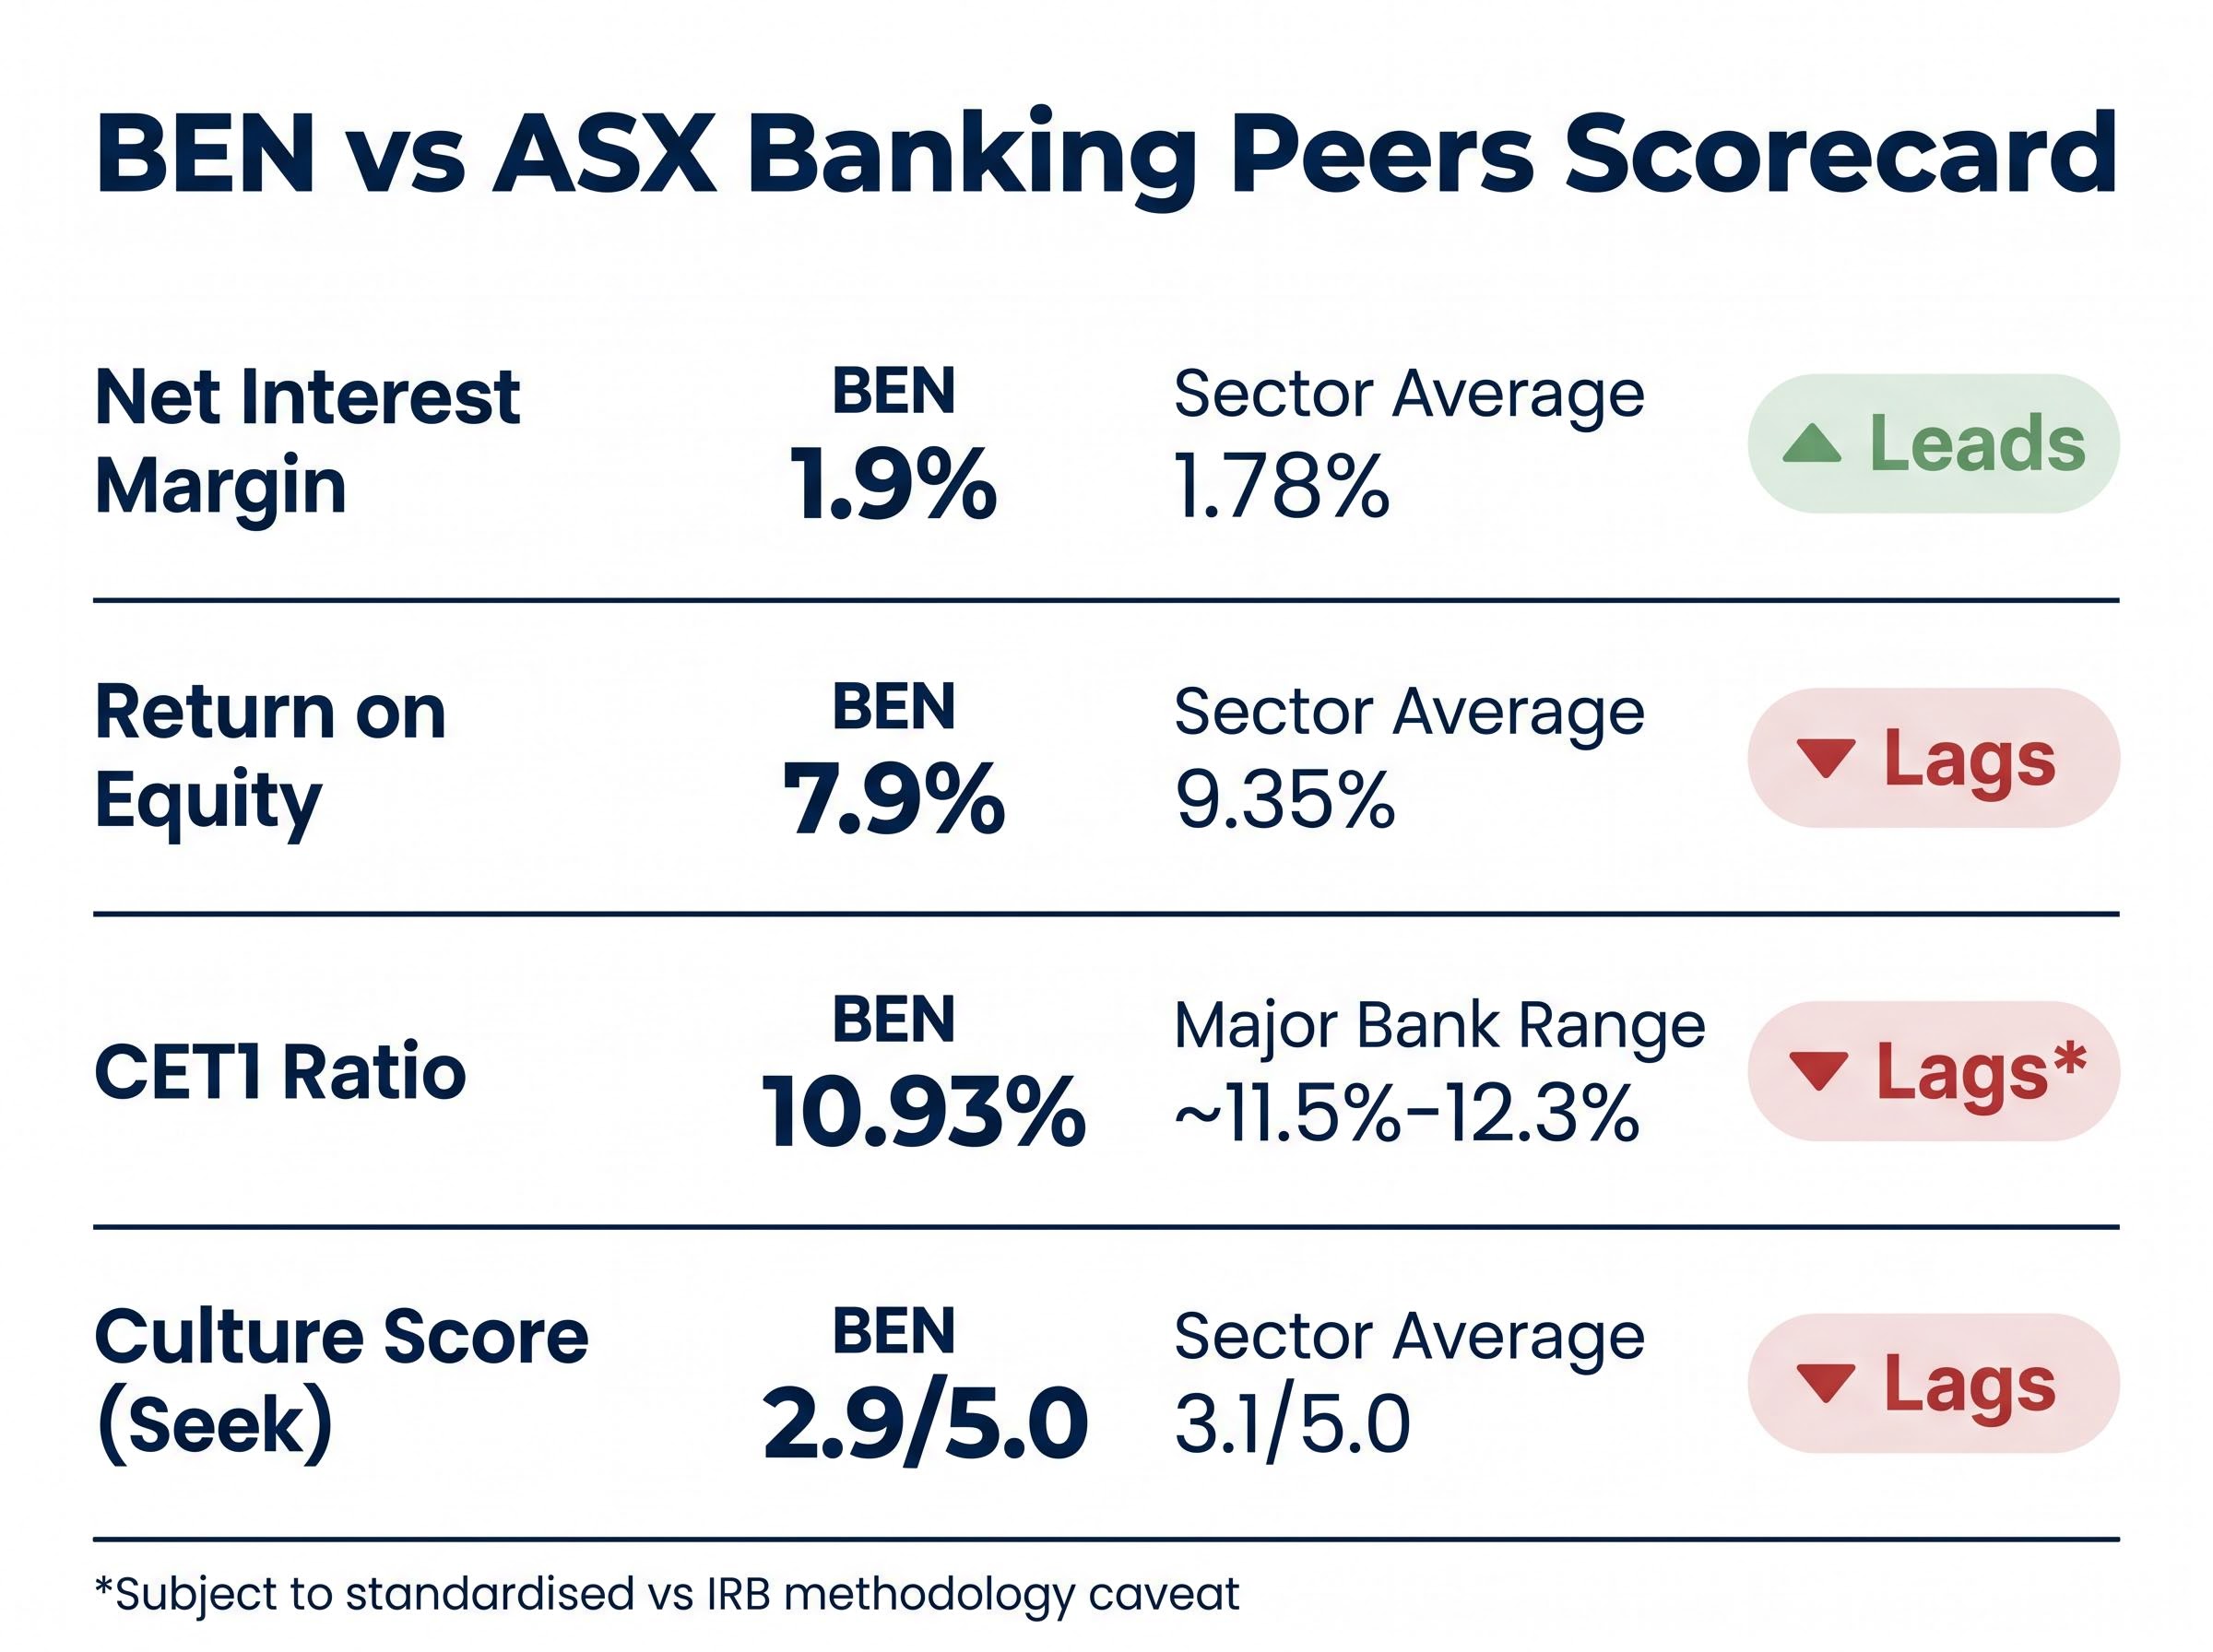
| Metric | BEN | Sector Average | BEN vs Peers |
|---|---|---|---|
| Net Interest Margin | 1.9% | 1.78% | Leads |
| Return on Equity | 7.9% | 9.35% | Lags |
| CET1 Ratio | 10.93% | ~11.5%-12.3% | Lags* |
| Culture Score (Seek) | 2.9/5.0 | 3.1/5.0 | Lags |
*CET1 comparison subject to standardised vs IRB methodology caveat.
The pattern is consistent: BEN earns well on its lending book but has not yet translated that advantage into competitive equity returns or above-average organisational strength. It leads on one metric and lags on three.
Dividend anchor: BEN paid a fully franked dividend of $0.63 per share in FY25, with the $0.30 per share interim maintained in 1H26. For income-focused investors, the dividend stream provides a stabilising element while the earnings recovery unfolds.
The scorecard presents a mixed picture, and that is the point. The investment case does not rest on a single metric. It rests on whether the NIM advantage and fully franked yield compensate for lagging capital efficiency and culture indicators.
What the DDM valuation signals about the current share price
The dividend discount model (DDM) estimates a stock’s value by dividing its annual dividend by the difference between the investor’s required rate of return and the expected dividend growth rate. It is a framework built on assumptions, and those assumptions determine everything.
Three scenarios illustrate the range:
| Scenario | Dividend Input | Risk Rate | Growth Rate | Estimated Value |
|---|---|---|---|---|
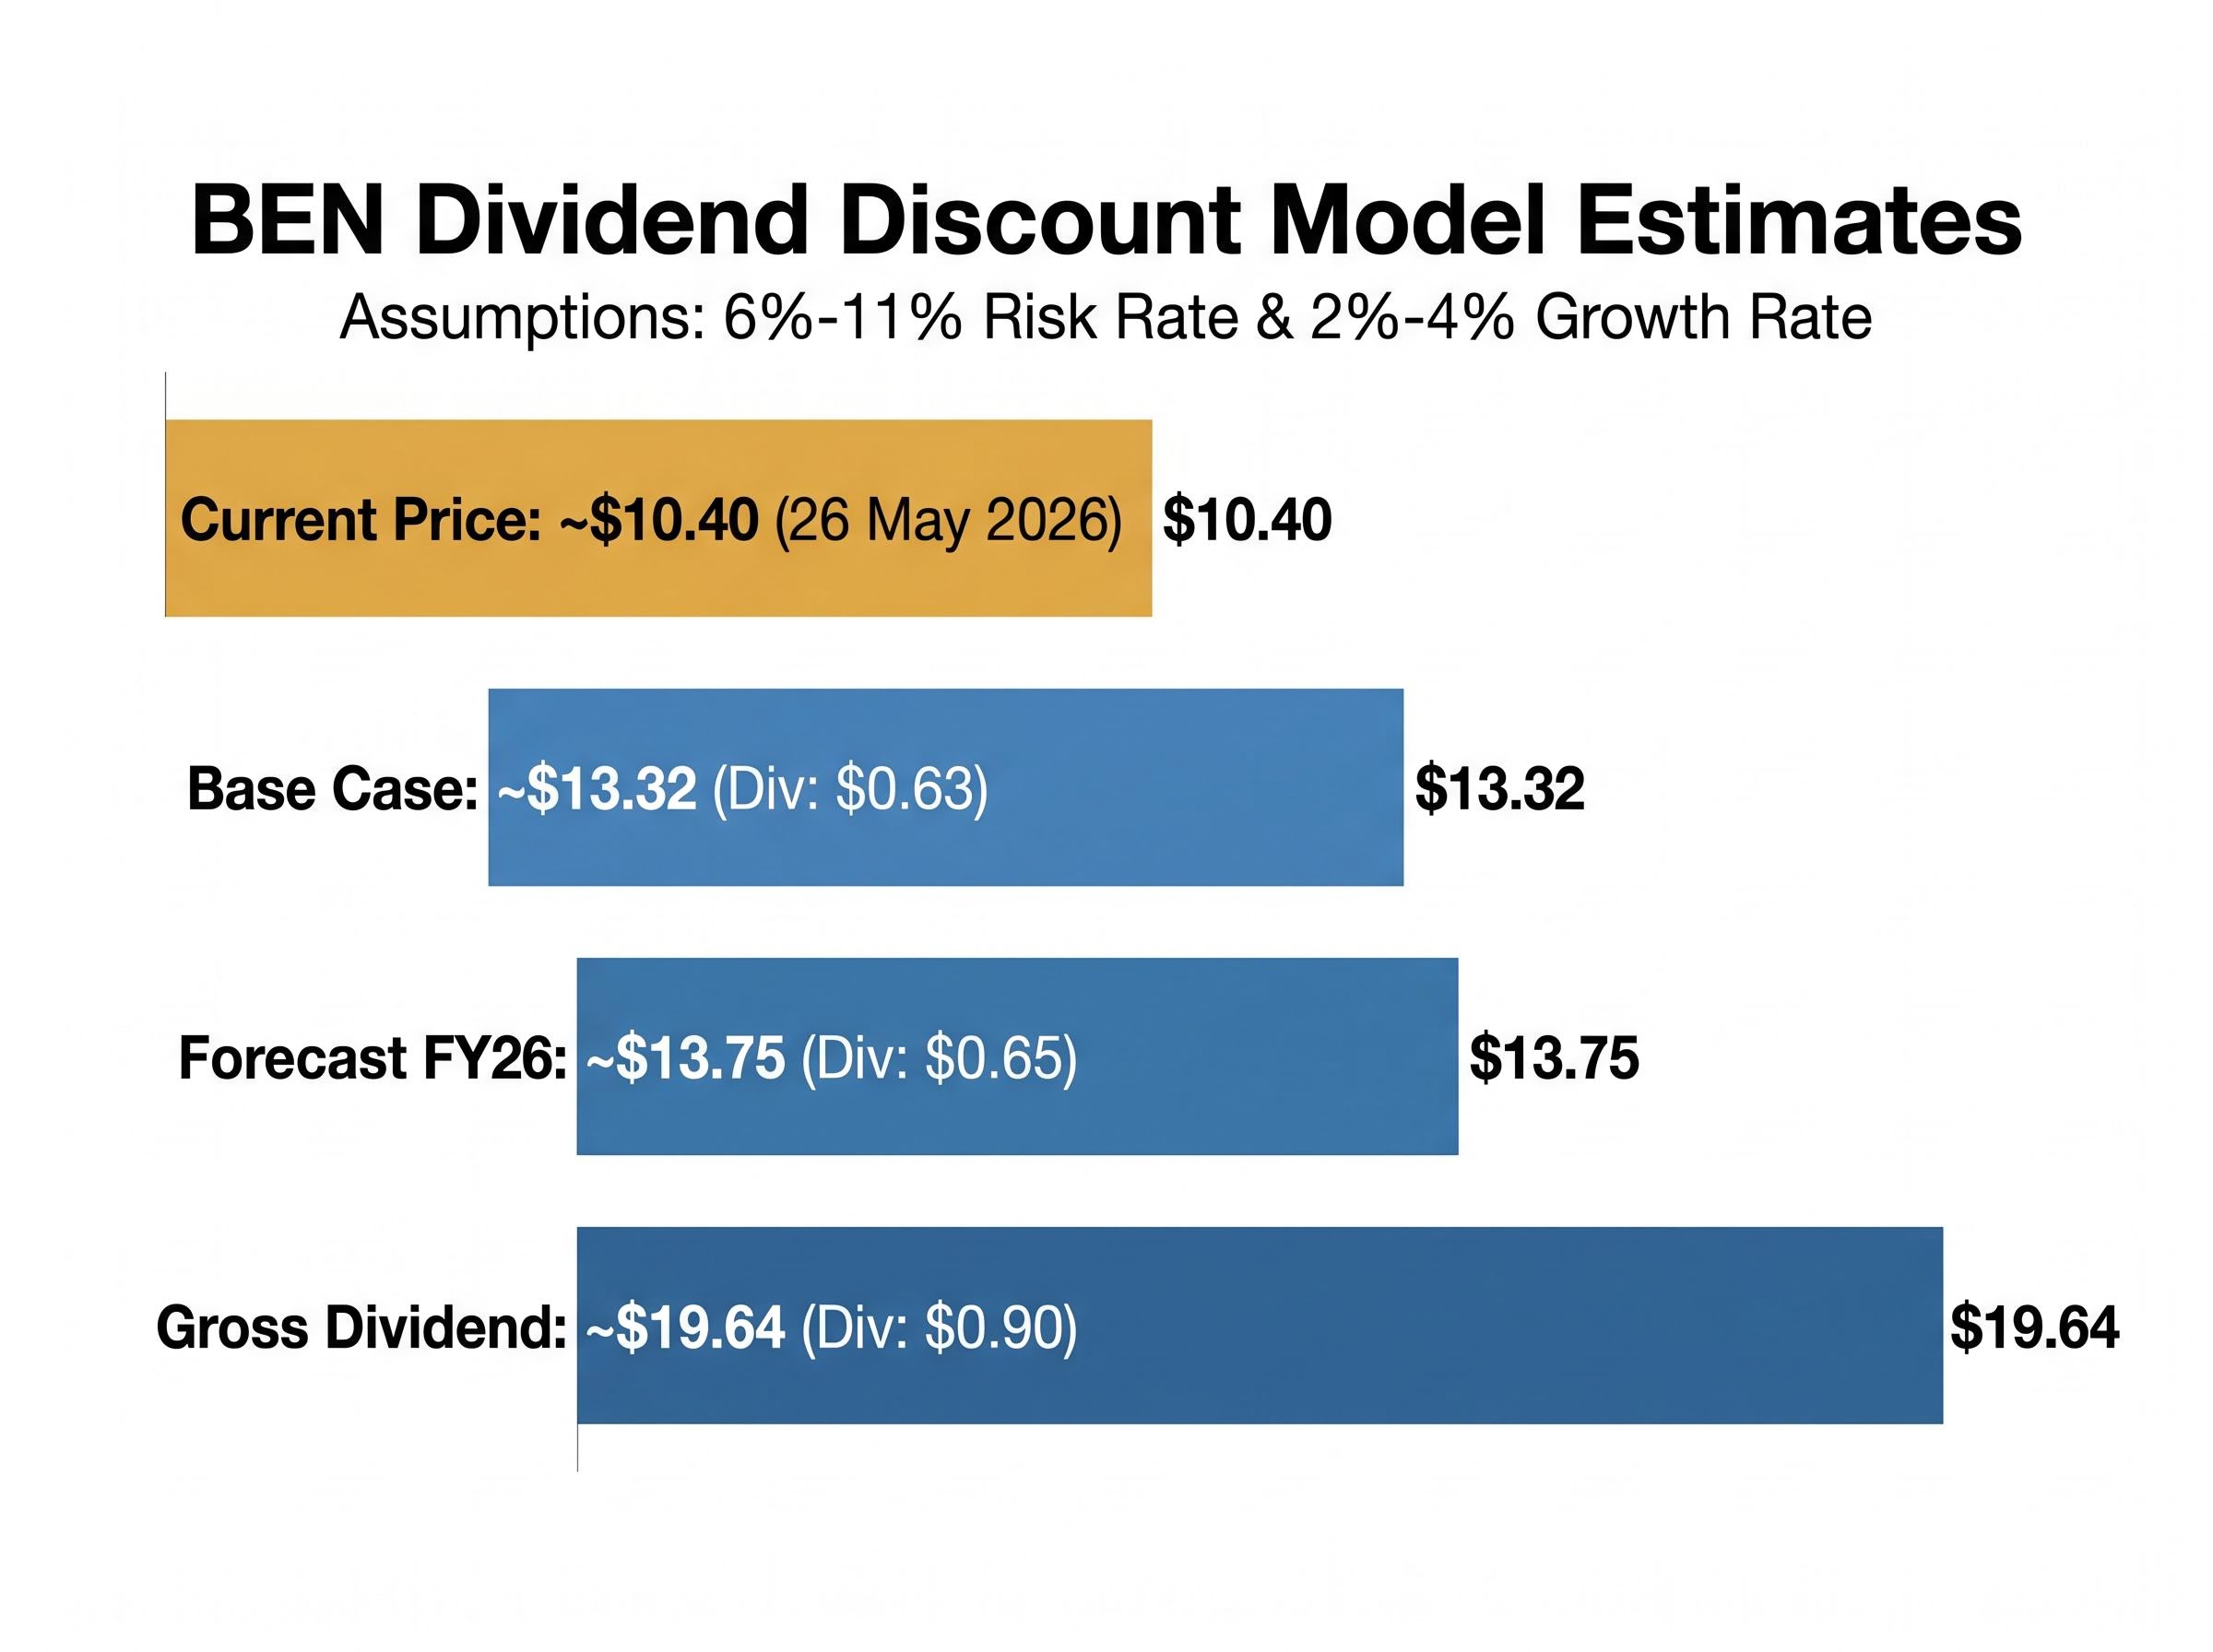
| Base Case (FY25 actual) | $0.63 | 6%-11% | 2%-4% | ~$13.32 |
| Forecast FY26 Dividend | $0.65 | 6%-11% | 2%-4% | ~$13.75 |
| Gross Dividend (incl. franking) | $0.90* | 6%-11% | 2%-4% | ~$19.64 |
*Gross dividend reflects fully franked value inclusive of franking credits.
The current share price of approximately $10.40 (as at 26 May 2026) sits below all three estimates. The gap is striking, but three caveats temper any rush to interpret it as a straightforward buy signal:
- Rate sensitivity: Small changes in the required rate of return produce large swings in the output. A risk rate of 11% versus 6% can halve the estimated value.
- Growth assumption uncertainty: Dividend growth of 2% to 4% is an assumption, not a guarantee. If BEN’s earnings trajectory stalls, so does the growth input.
- Franking credit relevance: The $19.64 gross dividend estimate is most relevant for tax-exempt investors (such as superannuation funds in accumulation phase). Taxable investors receive a partial benefit that varies by marginal tax rate.
The franking credit tax treatment for superannuation funds in accumulation phase allows franking credits to offset the 15% tax payable on dividend income, with any excess credits refunded by the ATO as cash, which is why the gross dividend figure of $0.90 per share carries its full stated value for this investor cohort rather than a discounted partial benefit.
The market is pricing in either a higher required return, slower growth, or a risk discount the DDM does not capture. The model provides a structured framework for thinking about valuation; it does not provide a definitive answer.
Past performance does not guarantee future results. Financial projections are subject to market conditions and various risk factors.
Mixed metrics, stable dividends: what BEN’s benchmark position means for the patient investor
BEN is a lending-efficient, capital-adequate but below-peer, cost-heavy bank with a reliable fully franked dividend and a share price that DDM analysis suggests may carry a margin of safety. That is the synthesis the scorecard supports.
The forward trajectory will be shaped by three variables, all of which the FY26 full-year results should illuminate:
- Cost-to-income ratio: The single metric most likely to shift the ROE gap. Cash earnings of $256.4 million in 1H26 (up 2.8%) suggest early progress, but a full-year confirmation is needed.
- CET1 ratio: The drift from 11.17% to 10.93% across three reporting periods is not alarming, but continued movement below APRA’s typical target range would raise questions about capital management.
- NIM sustainability: The progression from 1.88% (1H25) to 1.92% (1H26) is encouraging. Whether BEN can hold or extend the margin above 1.9% in a potentially shifting rate environment is a key input to the earnings outlook.
The fully franked interim dividend has been maintained at $0.30 per share across consecutive halves, providing a degree of income stability while the broader earnings picture develops.
For commercially oriented investors, the question is not whether BEN is a good or bad bank. It is whether the current price adequately compensates for the identified gaps in capital efficiency and organisational strength, while the NIM advantage and dividend yield do the work of delivering returns. The FY26 full-year results will provide the next substantive data point for answering that question.
Investors who want to complement the scorecard metrics above with a structured qualitative framework will find our dedicated guide to qualitative bank stock analysis covers management credibility, compliance history, loan book quality, and governance history in depth, applying ASIC research findings on why retail investors systematically underweight these factors relative to their actual importance in driving long-term outcomes.
This article is for informational purposes only and should not be considered financial advice. Investors should conduct their own research and consult with financial professionals before making investment decisions.