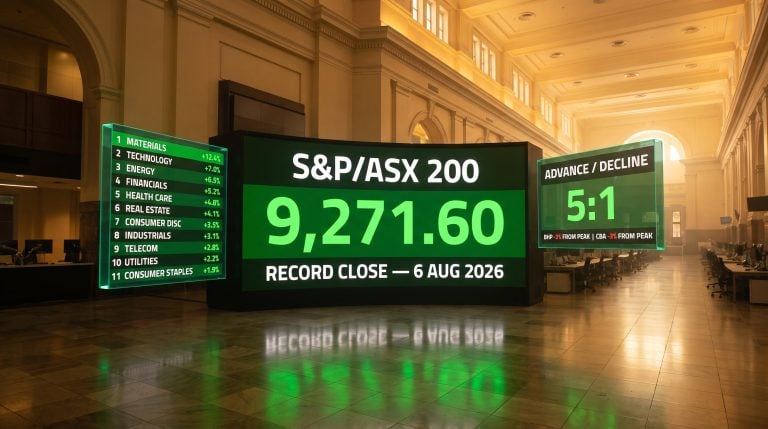
The ASX 200 closed Monday with buyers absorbing every attempt to push prices lower, finishing the session at or near its high. That kind of candle, where selling pressure gets swallowed and demand persists into the close, is what technical analysts look for immediately before a breakout. The index sits just below 9,201, the level that separates a promising setup from a confirmed one.
Between now and Friday night, Australian equities will have to navigate four significant macro events: US manufacturing sentiment, US services data, Australian household spending, and most consequentially, Friday’s US Non-Farm Payrolls (NFP). Each release can either support or complicate what the chart is already signalling. What makes this week unusual is that the technical setup and the macro calendar are on a collision course, and the outcome will determine whether this becomes the breakout week or a return to the support zone.
Here is the framework for assessing each data point as it lands: the technical conditions that need to hold, the macro releases most likely to move the needle, and the specific scenarios that lead to either a confirmed rally or a pullback toward support.
What the Monday candle is actually telling you
The 3 August daily candle on the ASX 200 was not a passive drift higher on thin volume. It told a specific story about what buyers and sellers did during the session, and that story matters more than the closing number.
Three characteristics defined it:
- Lower shadow (downward wick): Price traded below the open during the session, meaning sellers tried to push it lower. That selling was absorbed and reversed, which tells you buyers were willing to step in at lower prices.
- White body (close above open): Net buying pressure across the full session. More demand than supply by the close.
- Close at or near the session high: Demand was not exhausted into the final hour. No late-session selling pressure materialised, which signals buyers remained confident through the close.
That combination tells you this is not a low-conviction, thin-market drift. Buyers are actively competing for stock, and that is the precondition for a genuine breakout rather than a false one.
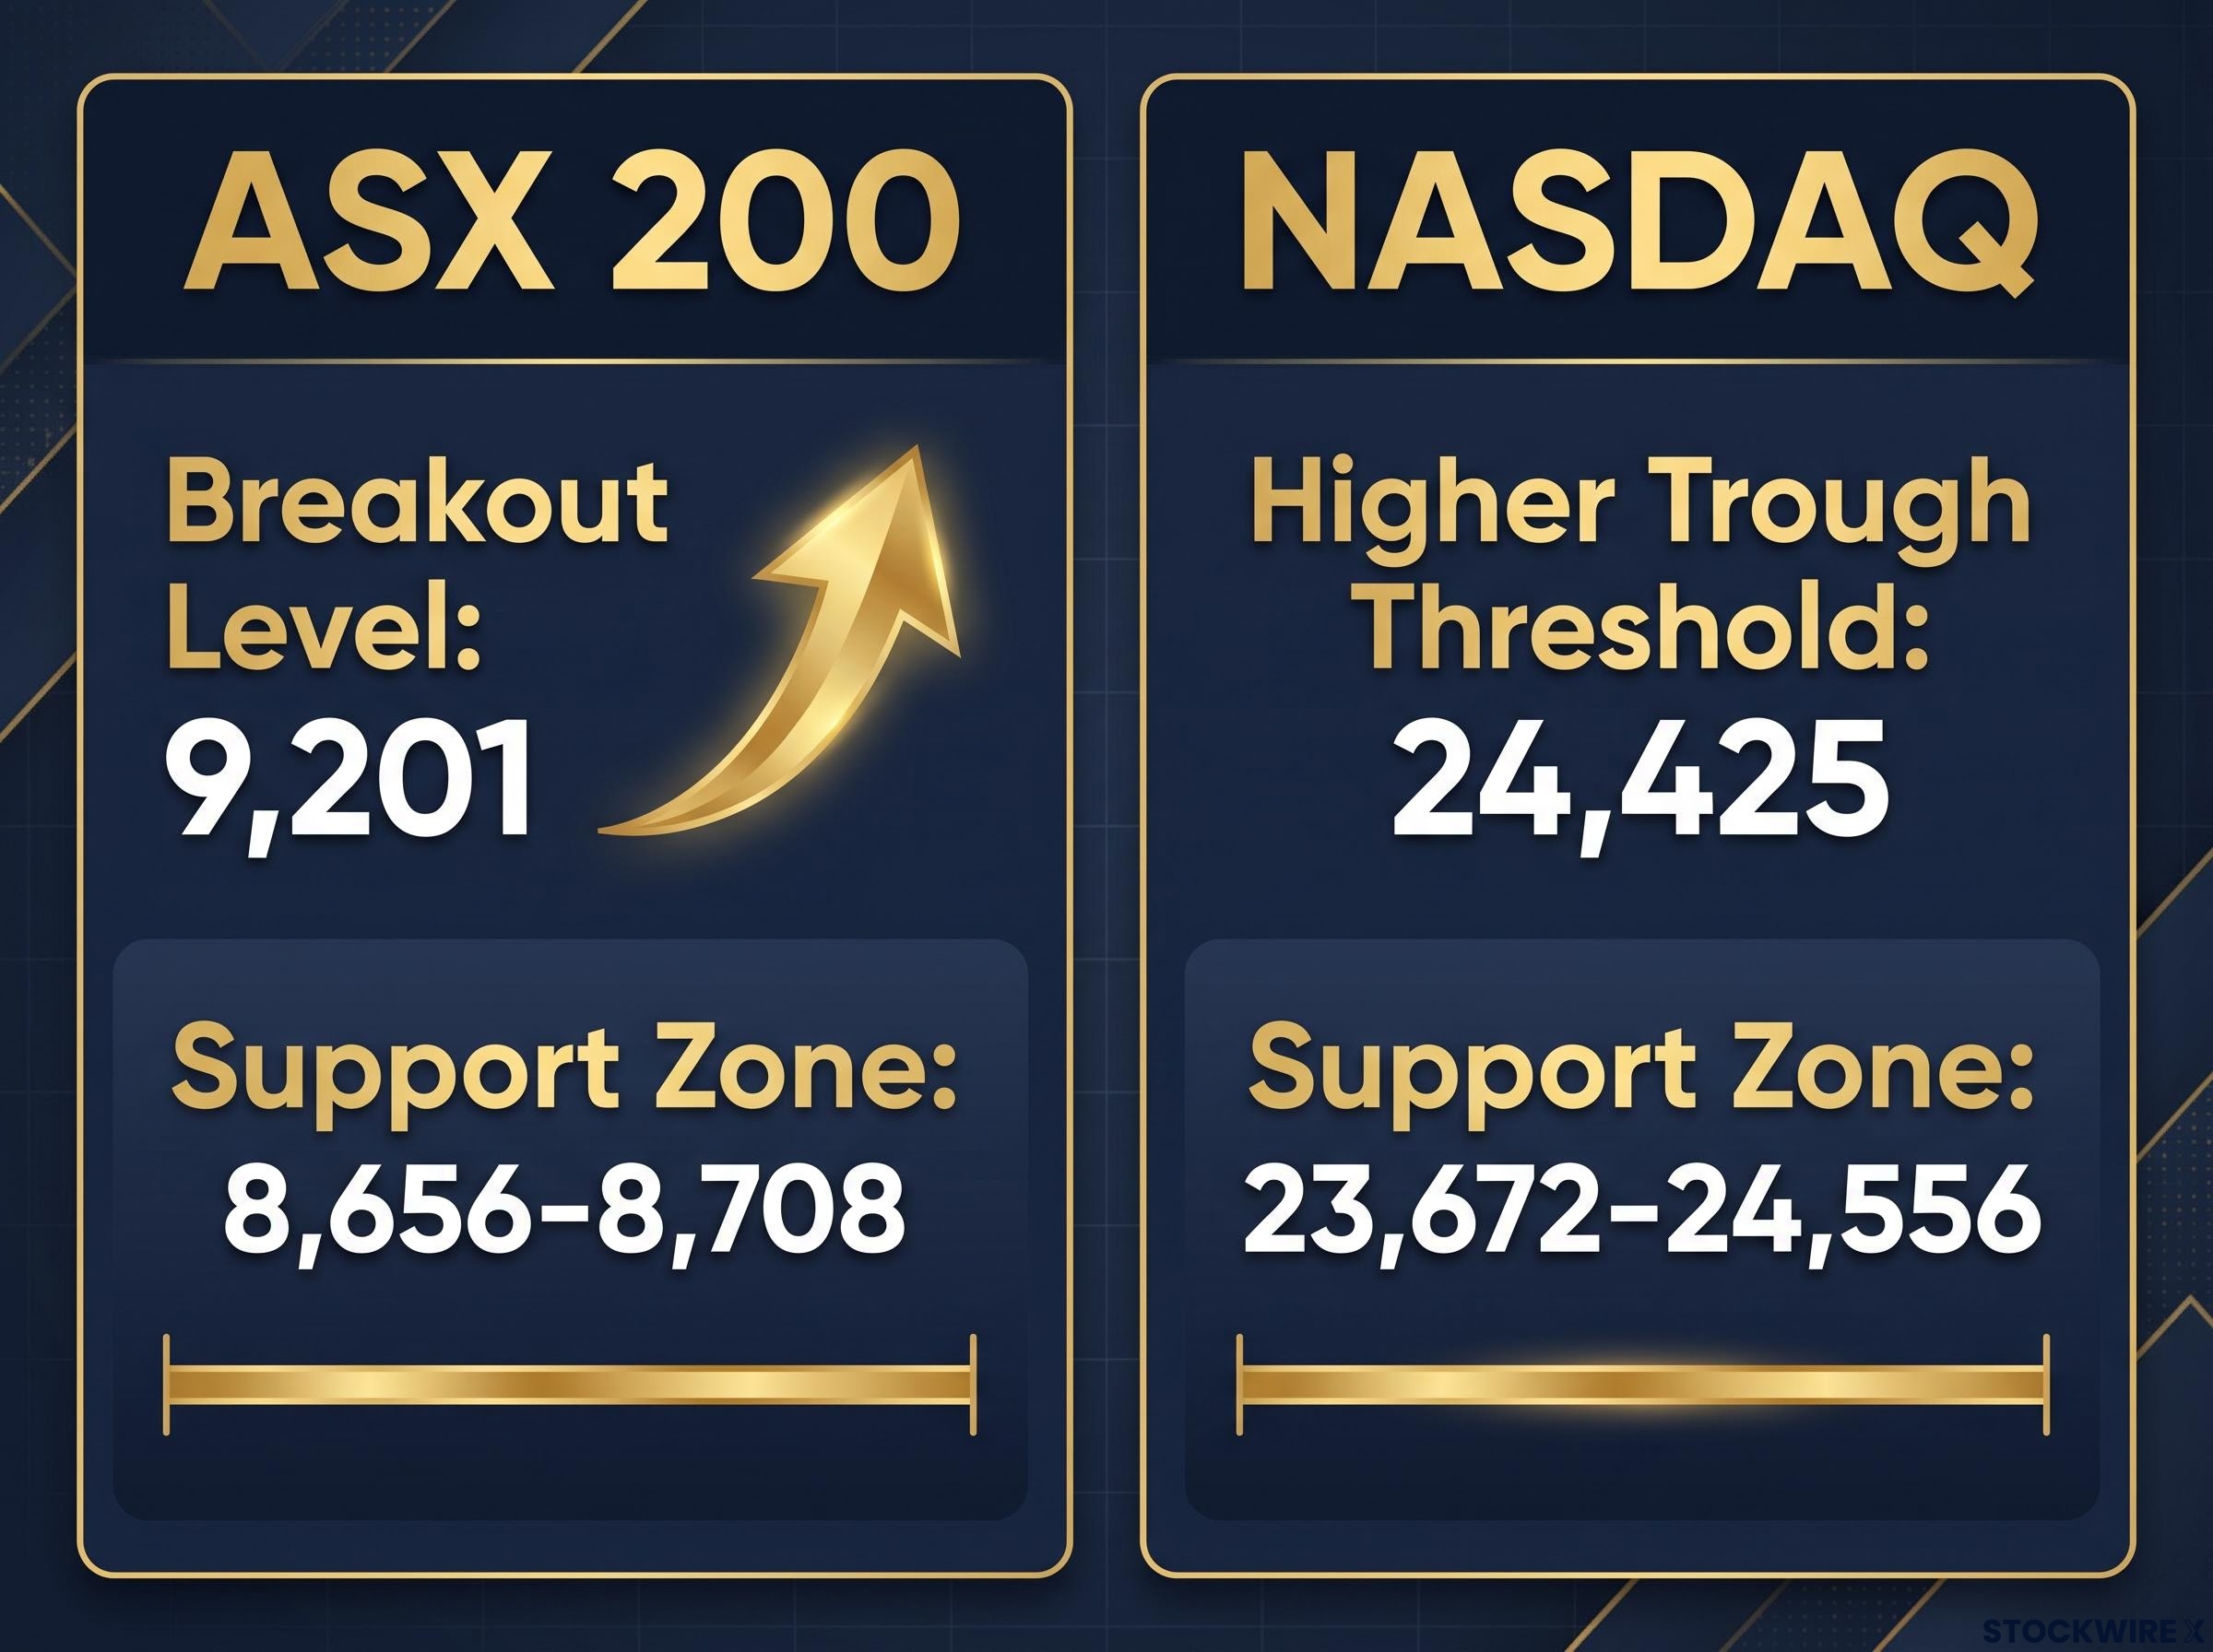
The line between promising and confirmed sits at 9,201. Below that, the setup remains constructive but tentative. The support zone at 8,656-8,708 has held during recent weakness, reinforcing it as a floor.
The 8,656-8,708 support zone referenced above did not emerge in isolation; internal breadth signals from late July revealed that 216 of 300 ASX stocks were already declining on days the headline index barely moved, a divergence that made the support band’s subsequent hold more significant than the index level alone suggested.
One more high-quality demand-side candle with solid volume through 9,201 would, in Carl Capolingua’s Market Index ChartWatch framework, justify full risk allocation to Australian equities.
When big ASX news breaks, our subscribers know first
Where the Nasdaq fits into the ASX outlook
The ASX 200 does not break out in isolation. US market sentiment, particularly from the Nasdaq Composite, feeds directly into Australian equity positioning. Right now, the Nasdaq’s own technical picture is mixed, and that matters for whether the 9,201 level holds or fails.
The Nasdaq is sitting on a support zone where the daily chart’s long-term uptrend ribbon and the weekly chart’s short-term uptrend ribbon converge at the same price region. Key details:
- Demand zone: approximately 23,672-24,556 on the daily and weekly ribbon
- Short-term trend status: still showing falling peaks and falling troughs, which is the technical definition of a downtrend
- Key threshold for structural change: a higher trough forming above 24,425
The two most recent sessions produced demand-side candles off this support zone, and Friday’s volume was notably elevated, suggesting real buyer engagement rather than thin end-of-month noise. Carl Capolingua’s current exposure to US equities sits between one-third and one-half of maximum allowable risk: not fully committed, but not underweight either.
For Australian equity investors, the Nasdaq’s failure to yet form a higher trough is a reason for calibrated, not maximum, exposure. The global support condition has not been satisfied even as the local chart looks constructive.
The threshold that matters: 24,425
A “higher trough” means something specific: the next low must form above the previous low, breaking the pattern of successive lower lows that defines the current short-term downtrend. Until that happens above 24,425, the Nasdaq remains a short-term downtrend nested inside a longer-term uptrend.
That is a mixed picture, not a bear-market signal, but it means a confirmed Nasdaq recovery would make the ASX breakout significantly more credible, while a US rollover would make it significantly harder to sustain.
How to read the economic calendar as it unfolds
This week’s data releases are not isolated events. They form a sequence, and each one reshapes expectations for the next. The chain builds toward Friday night’s NFP as the week’s definitive verdict.
| Release | Day/Time (AEST) | Forecast | Prior |
|---|---|---|---|
| US ISM Manufacturing PMI | Tue 5 Aug | 54.0 | 53.3 |
| Australian Household Spending | Tue 5 Aug, 11:30am | +0.2% m/m | +1.3% m/m |
| US JOLTS Job Openings | Wed 6 Aug | 7.42 million | 7.59 million |
| US ISM Services PMI | Thu 7 Aug | 54.5 | 54.0 |
| US Non-Farm Payrolls | Fri 8 Aug, 10:30pm | +88,000 jobs / 4.2% / +0.3% m/m | +57,000 / 4.2% / +0.3% m/m |
Tuesday’s Australian Household Spending figure is the first domestic test. The forecast of +0.2% month-on-month, down sharply from May’s +1.3%, already signals expected consumer softening. A miss below even that modest number would confirm ongoing consumer stress and add a mild headwind to any ASX breakout attempt.
Wednesday’s JOLTS and Thursday’s ISM Services then set the US mood heading into Friday. A run of solid readings from Tuesday through Thursday would mean markets approach NFP with elevated confidence, making a goldilocks payrolls number more likely to act as an accelerant rather than mere relief.
NFP releases at 10:30pm AEST on Friday 8 August, after the ASX close. The market impact arrives via futures and the Monday 10 August open. Australian investors will not be able to react in real time during the local session.
Why the NFP number is not as simple as it looks
The instinct is to read Non-Farm Payrolls as a binary: good number or bad number. The reality is that NFP is a three-variable equation, and different combinations of those variables produce very different market reactions.
The three-number read: jobs, unemployment, wages
Markets do not read NFP as a single headline figure. A strong jobs number paired with rising wages reads very differently from strong jobs paired with stable wages. The first combination signals inflationary pressure; the second signals a healthy labour market without complicating the Federal Reserve’s path. For Australian investors, the wages component matters most because it directly affects the Fed rate outlook, which in turn shapes global cost of capital and growth asset valuations.
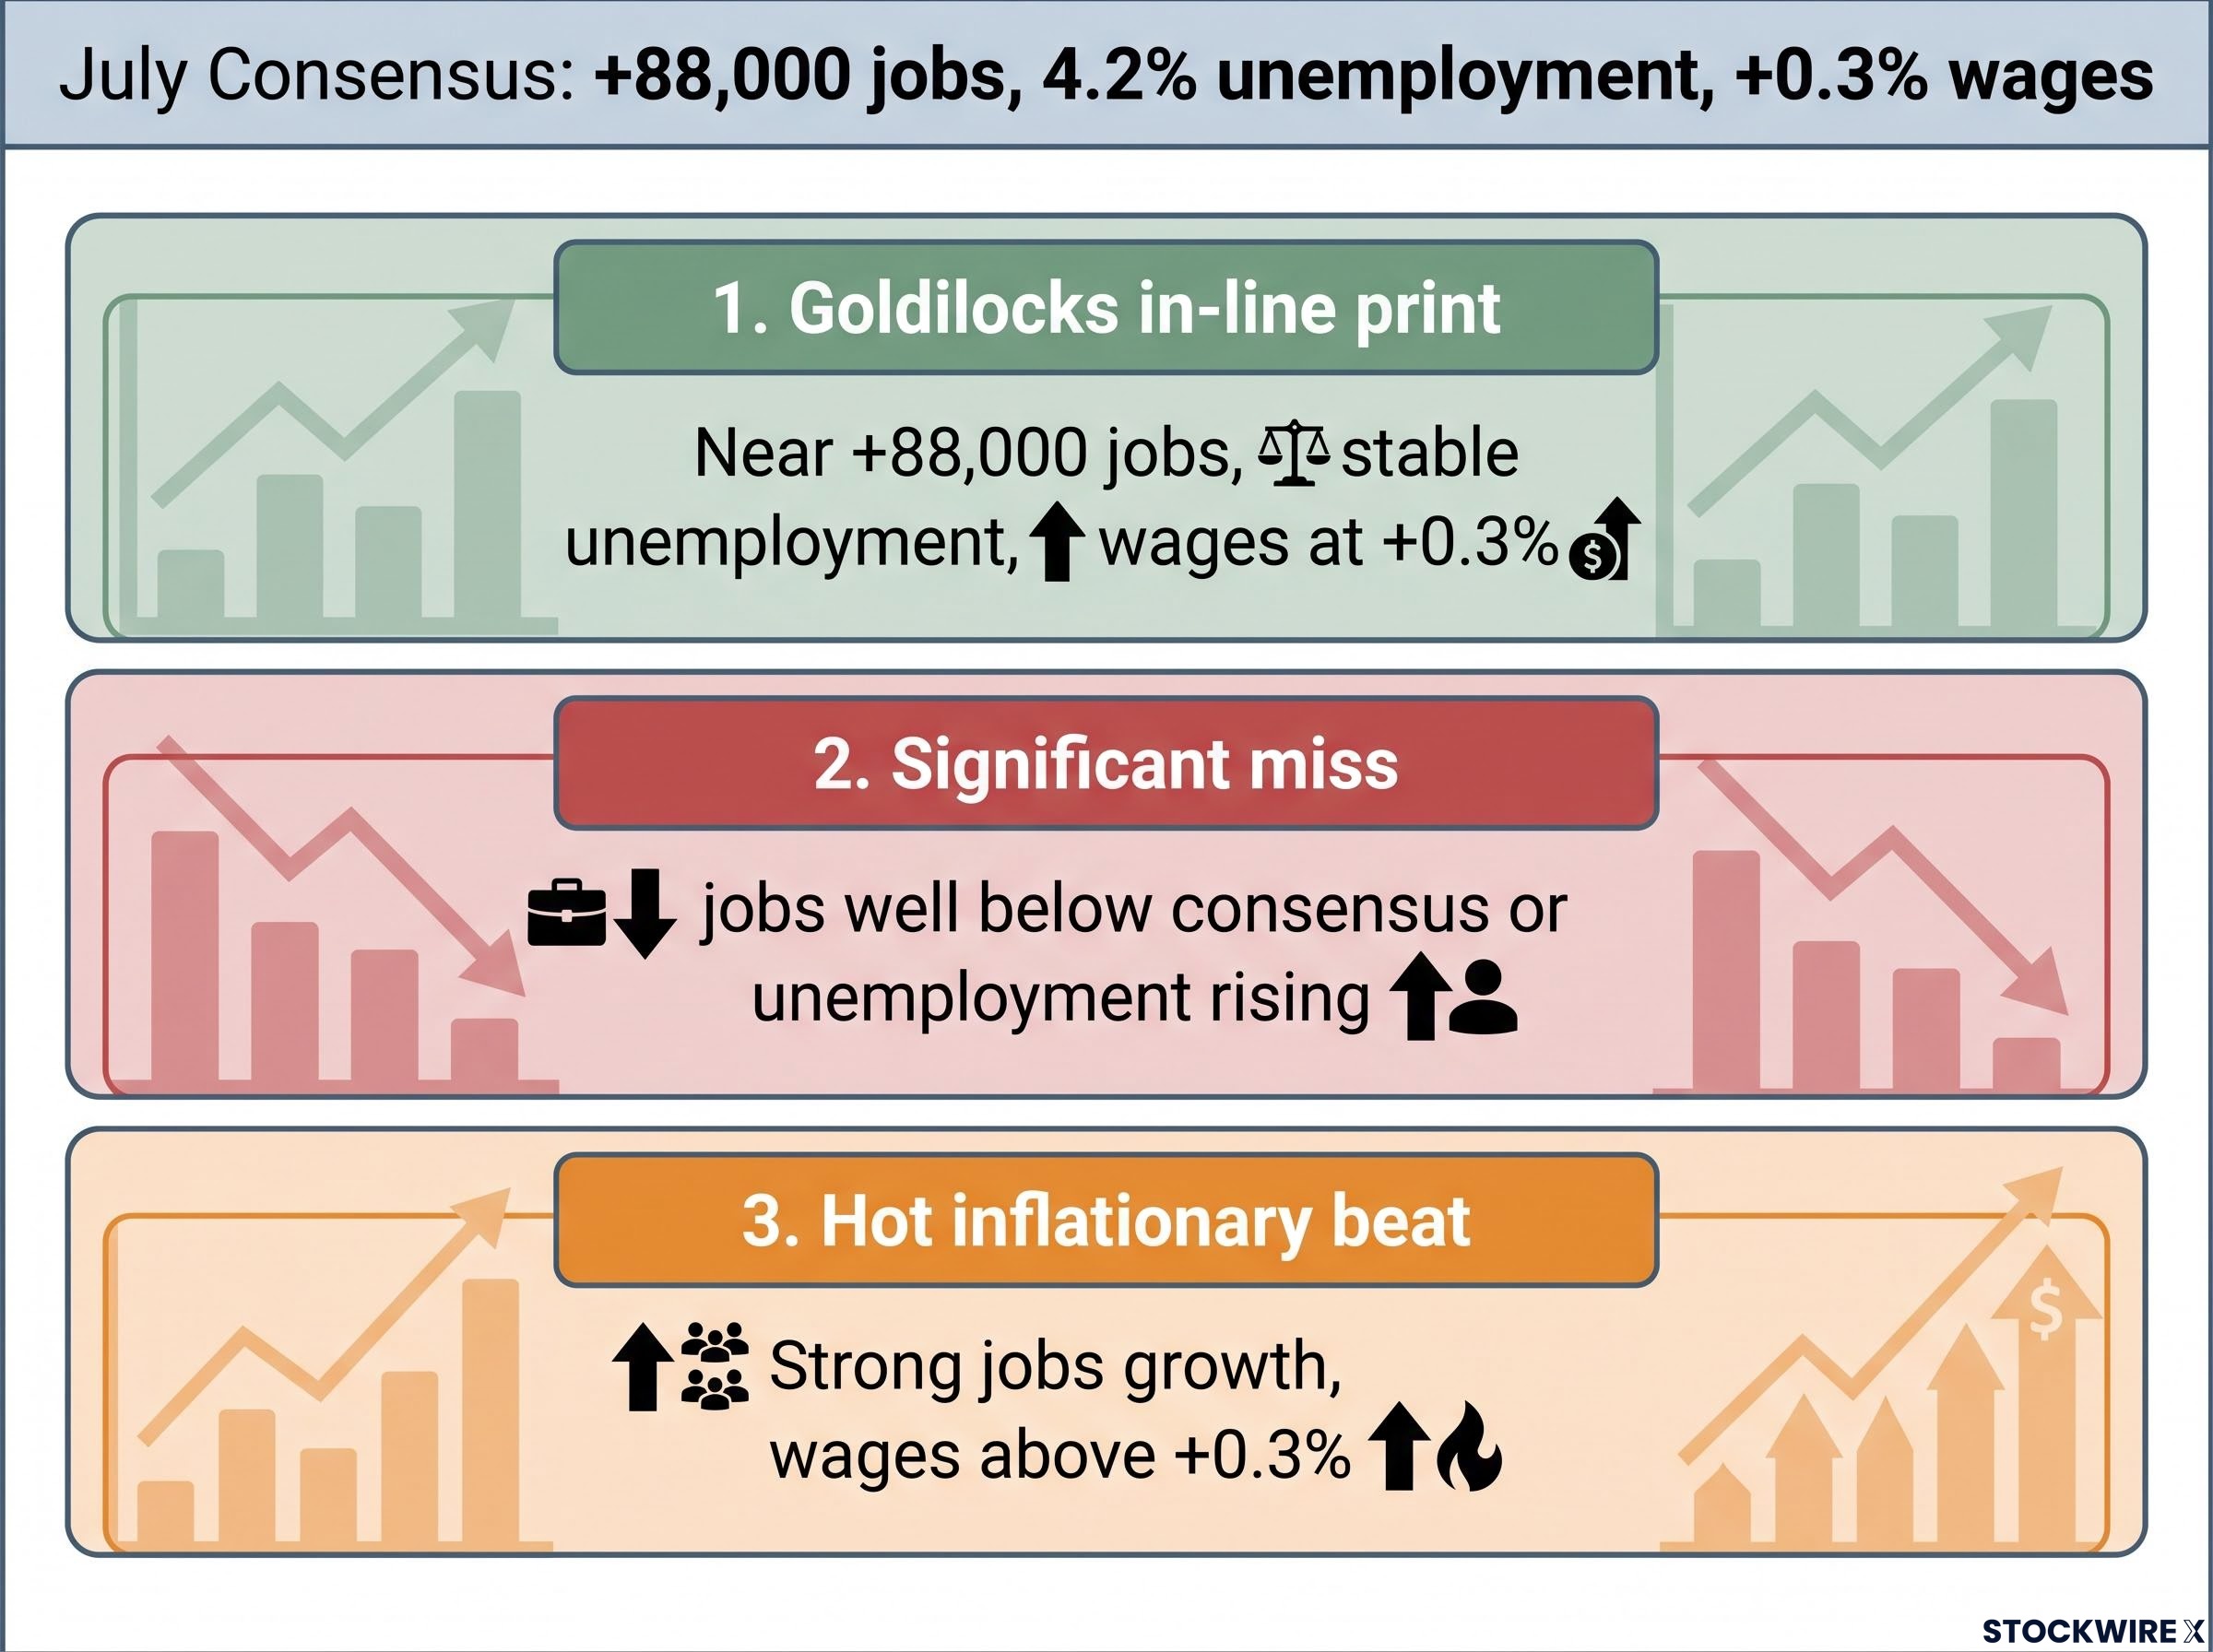
Consensus for July: +88,000 jobs (vs +57,000 in June), unemployment at 4.2% (unchanged), average hourly earnings at +0.3% month-on-month (unchanged).
The current consensus of +88,000 jobs is itself a product of the same NFP interpretation framework that showed how sector composition and internal variables matter as much as the headline, particularly when the Fed is operating without explicit forward guidance and a single data point carries the full interpretive burden.
Three scenarios to watch:
- Goldilocks in-line print: Jobs near +88,000, unemployment stable, wages at +0.3%. This signals no deterioration but no inflationary reacceleration either. It supports Nasdaq forming a higher trough above 24,425, removes a structural headwind for global equities, and would likely give the ASX 200 the sentiment boost to push through 9,201 at Monday’s open.
- Significant miss: Jobs well below consensus, or unemployment rising. Short-term, this could accelerate rate cut expectations, which is initially equity-positive. But if the miss is large enough, it signals genuine economic fragility, which is a risk-off driver. The ASX could retreat toward the 8,656-8,708 support zone.
- Hot inflationary beat: Strong jobs growth combined with wages above +0.3%. This complicates the Fed’s easing path, increases volatility, and does not offer clean upside for equities. The market reaction tends to be choppy rather than directional.
For Australian investors watching Friday’s number, the most constructive outcome is not the strongest jobs print but the most predictable one: a reading that lets the Fed stay on its current path without forced pivots.
What the Melbourne Institute inflation surprise changes
The local technical picture looks constructive. The macro calendar offers potential catalysts. But there is one piece of the puzzle that complicates the otherwise favourable setup, and it landed on 3 August.
The Melbourne Institute Inflation Gauge rose +1.0% month-on-month in July 2026, reversing June’s -0.4% reading. That is a +1.4 percentage point swing in a single month.
The Melbourne Institute gauge is not an official ABS release, but it is monitored by the Reserve Bank of Australia (RBA) alongside official data. The scale of this monthly reversal is significant enough to attract RBA attention.
If future official ABS data confirms this trend, the implications land directly on the RBA’s rate cut timeline. A sustained increase could delay or dilute the easing cycle that much of the current ASX rally is priced around. The sectors most exposed:
The Melbourne Institute gauge compounds a risk that was already present before the July reading: the RBA easing timeline was already under pressure from the Bank’s own published forecasts, which projected inflation remaining above the 2-3% target band through 2028 and described any near-term cut as a bet against the RBA’s own numbers.
- REITs (real estate investment trusts), which rely on falling rates to compress yields and lift asset valuations
- Utilities, where higher borrowing costs erode margins on capital-intensive infrastructure
- Infrastructure, where project economics are highly sensitive to the cost of debt
A single month’s inflation gauge does not derail a technical breakout. But it does mean that any rally built on an anticipated RBA easing cycle is resting on a shakier foundation than it appeared a month ago. Even if the ASX pushes through 9,201 this week, the medium-term tailwind from rate cuts is less certain than it was before this reading.
Bull case, risk case, and what to watch for each
This week does not call for a prediction. It calls for a framework. The technical setup and macro calendar create two distinct paths, and each has specific, measurable conditions that either confirm or deny it as the week unfolds.
The five signposts
The table below is not a set of forecasts. It is a monitoring checklist. Each signpost is conditional: if the bull case signal materialises, weight increases toward the breakout scenario; if the risk case signal appears, probability shifts toward a pullback. Note that the final signpost, NFP, reaches the ASX via futures, so the full picture will not be complete until the Monday 10 August open.
| What to Watch | Bull Case Signal | Risk Case Signal |
|---|---|---|
| ASX 200 daily candle quality | Demand-side candles; close above 9,201 with conviction | Failure at or below 9,201; supply-side candles |
| Nasdaq higher trough | Higher trough forms above 24,425 | Rollover below 24,425; falling troughs continue |
| US ISM Services (Thu) | Beat vs 54.5 forecast; resilience confirmed | Miss toward 50; soft-landing narrative challenged |
| US NFP (Fri, 10:30pm AEST) | Near +88,000 / 4.2% / +0.3% wages | Significant miss on jobs or rising unemployment |
| Australian Household Spending (Tue) | At or above +0.2% m/m forecast | Miss below +0.2%; consumer stress deepens |
Under the bull case, demand-side candles continue, 9,201 breaks on conviction, US data lands in-line, and the Nasdaq forms its higher trough. Carl Capolingua’s framework would at that point technically justify full risk allocation to Australian equities. The AUD/USD at 0.7027 as of 3 August provides the currency baseline for the week.
Under the risk case, NFP significantly undershoots, risk-off sentiment materialises, and the ASX fails at resistance and retreats toward the 8,656-8,708 support zone. The breakout gets postponed, not cancelled, but the momentum resets.
What a confirmed breakout would and would not resolve
If the ASX 200 closes above 9,201 on solid volume and demand-side candles this week, it would be a genuinely significant technical signal. It would confirm:
- Buyer conviction is real and sustained, not a thin-market drift
- The technical structure supports a broader move higher
- The support zone at 8,656-8,708 has held and the index has progressed through resistance
What it would not resolve:
- The Melbourne Institute inflation gauge and its potential impact on the RBA rate cut timeline remain an open question until official ABS data either confirms or denies the July reading
- Whether the Nasdaq forms a confirmed higher trough above 24,425, which remains the anchor for global sentiment and sustained risk appetite
- The medium-term sustainability of a rally built partly on rate cut expectations that may now be less certain
For investors tempted to treat a breakout as a green light to stop watching, this is the counterpoint. The most important macro variables shift rather than disappear when a technical level breaks. The analytical framework from this week, the signposts, the inflation wildcard, the Nasdaq dependency, continues to apply in the sessions that follow.
For investors wanting the full historical context behind the Nasdaq dependency described throughout this article, our deep-dive into ASX-Nasdaq divergence maps the supply zones, demand levels, and allocation sizing that explained the flat ASX 200 return across a period when the Nasdaq was trending cleanly higher.
This article is for informational purposes only and should not be considered financial advice. Investors should conduct their own research and consult with financial professionals before making investment decisions. These statements are speculative and subject to change based on market developments and company performance.
Technical analysis framework attributed to Carl Capolingua, Market Index ChartWatch. Economic forecasts represent market consensus estimates as of the week of 4-8 August 2026.
—