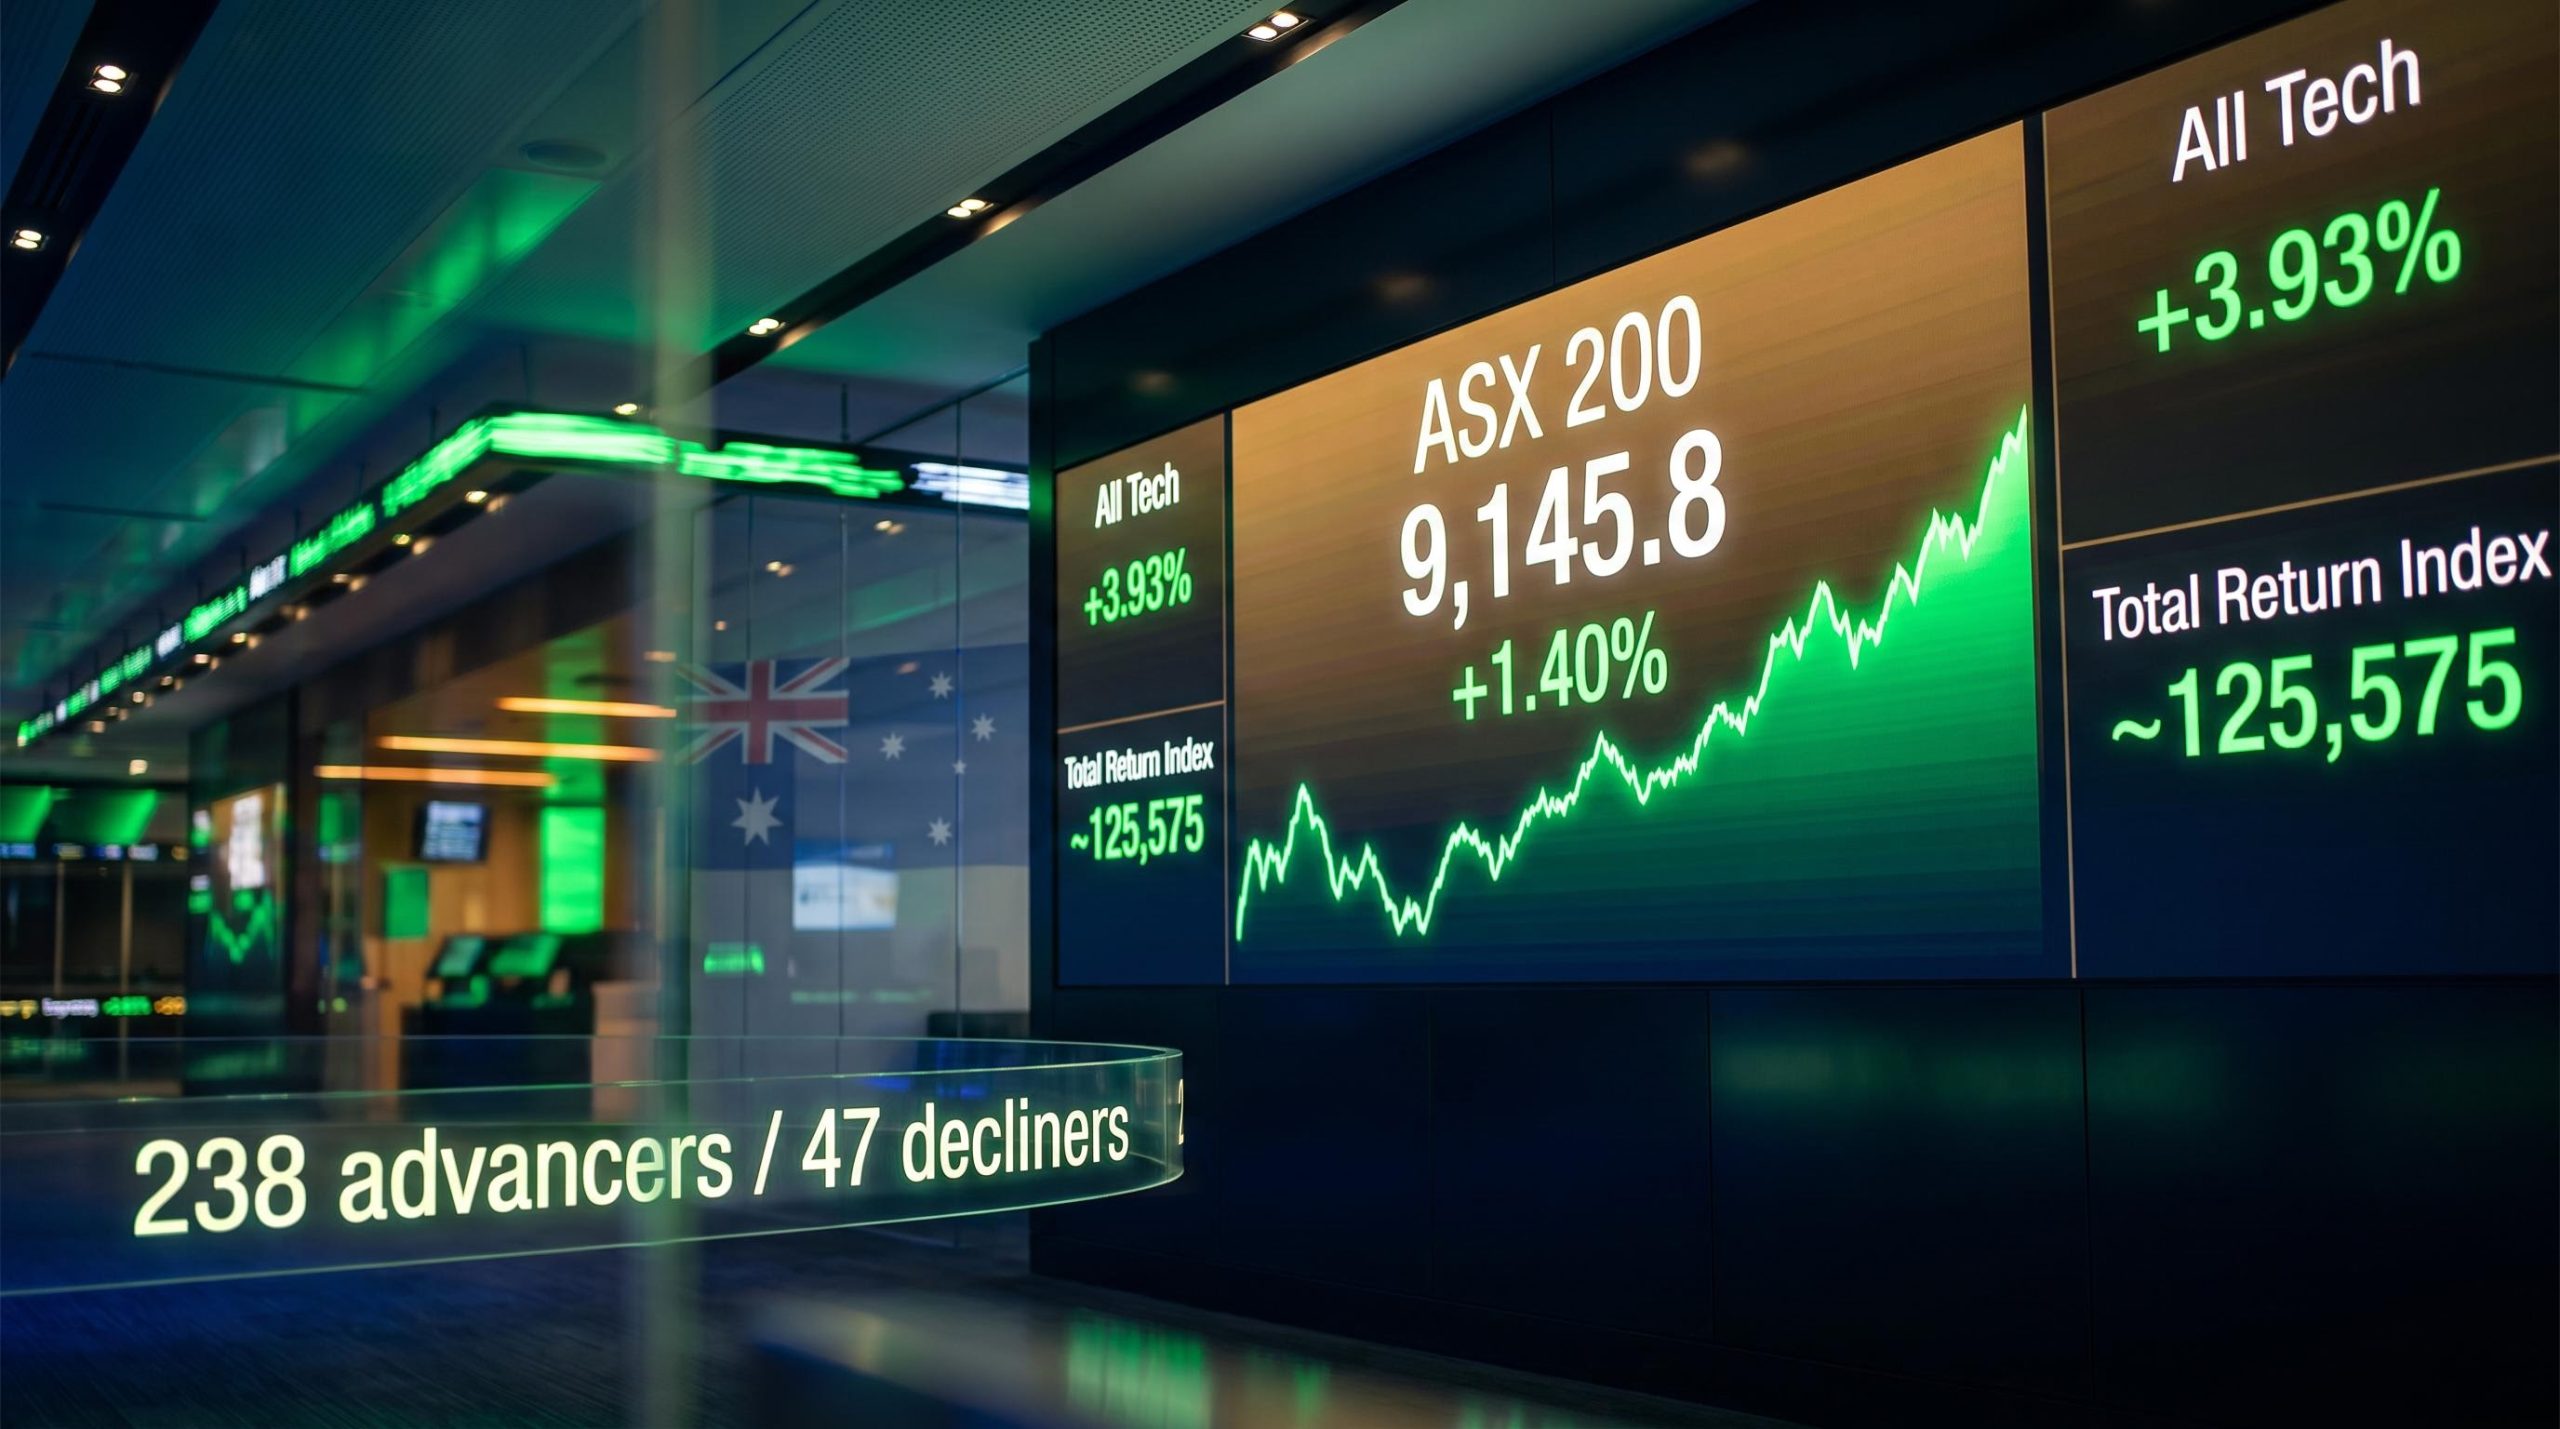
On 4 August 2026, the S&P/ASX 200 Total Return Index notched a fresh all-time high, with the session closing at its peak price for the day and the count of rising stocks running at close to five times the number of fallers. That closing pattern is not routine.
The record matters less for the number itself than for how it was made. Broad participation across sectors, small-cap outperformance, and thematic alignment between global AI momentum and Australian assets all converged in a single session, reinforced by better-than-expected domestic economic data released the same day. This is a story about the composition of a rally, not just its existence.
Here is what the breadth, the sector leadership, and the macro backdrop actually tell you about where the Australian market sits in its cycle, and which themes are now central to the ASX story rather than peripheral to it.
From prior peak to new record: what the Total Return Index is telling you
The S&P/ASX 200 Total Return Index reached an estimated ~125,575 on 4 August 2026, clearing the prior record of 124,880 set on 2 March 2026. The price-only ASX 200 (XJO) closed at 9,145.8, up 126.5 points (+1.40%), but the total return number is the one that matters for measuring actual investor wealth.
The distinction is worth understanding:
- The price-only ASX 200 tracks share prices alone. It ignores dividends entirely.
- The Total Return Index reinvests all dividends back into the index, capturing the full return shareholders actually receive.
- When the Total Return Index sets a record, it confirms that cumulative price gains plus dividends have reached their highest combined level ever.
The S&P/ASX Australian Indices Methodology published by S&P Dow Jones Indices specifies that total return variants reinvest gross dividends at the closing price on the ex-dividend date, which is precisely what separates the Total Return Index from its price-only counterpart when measuring cumulative investor wealth.
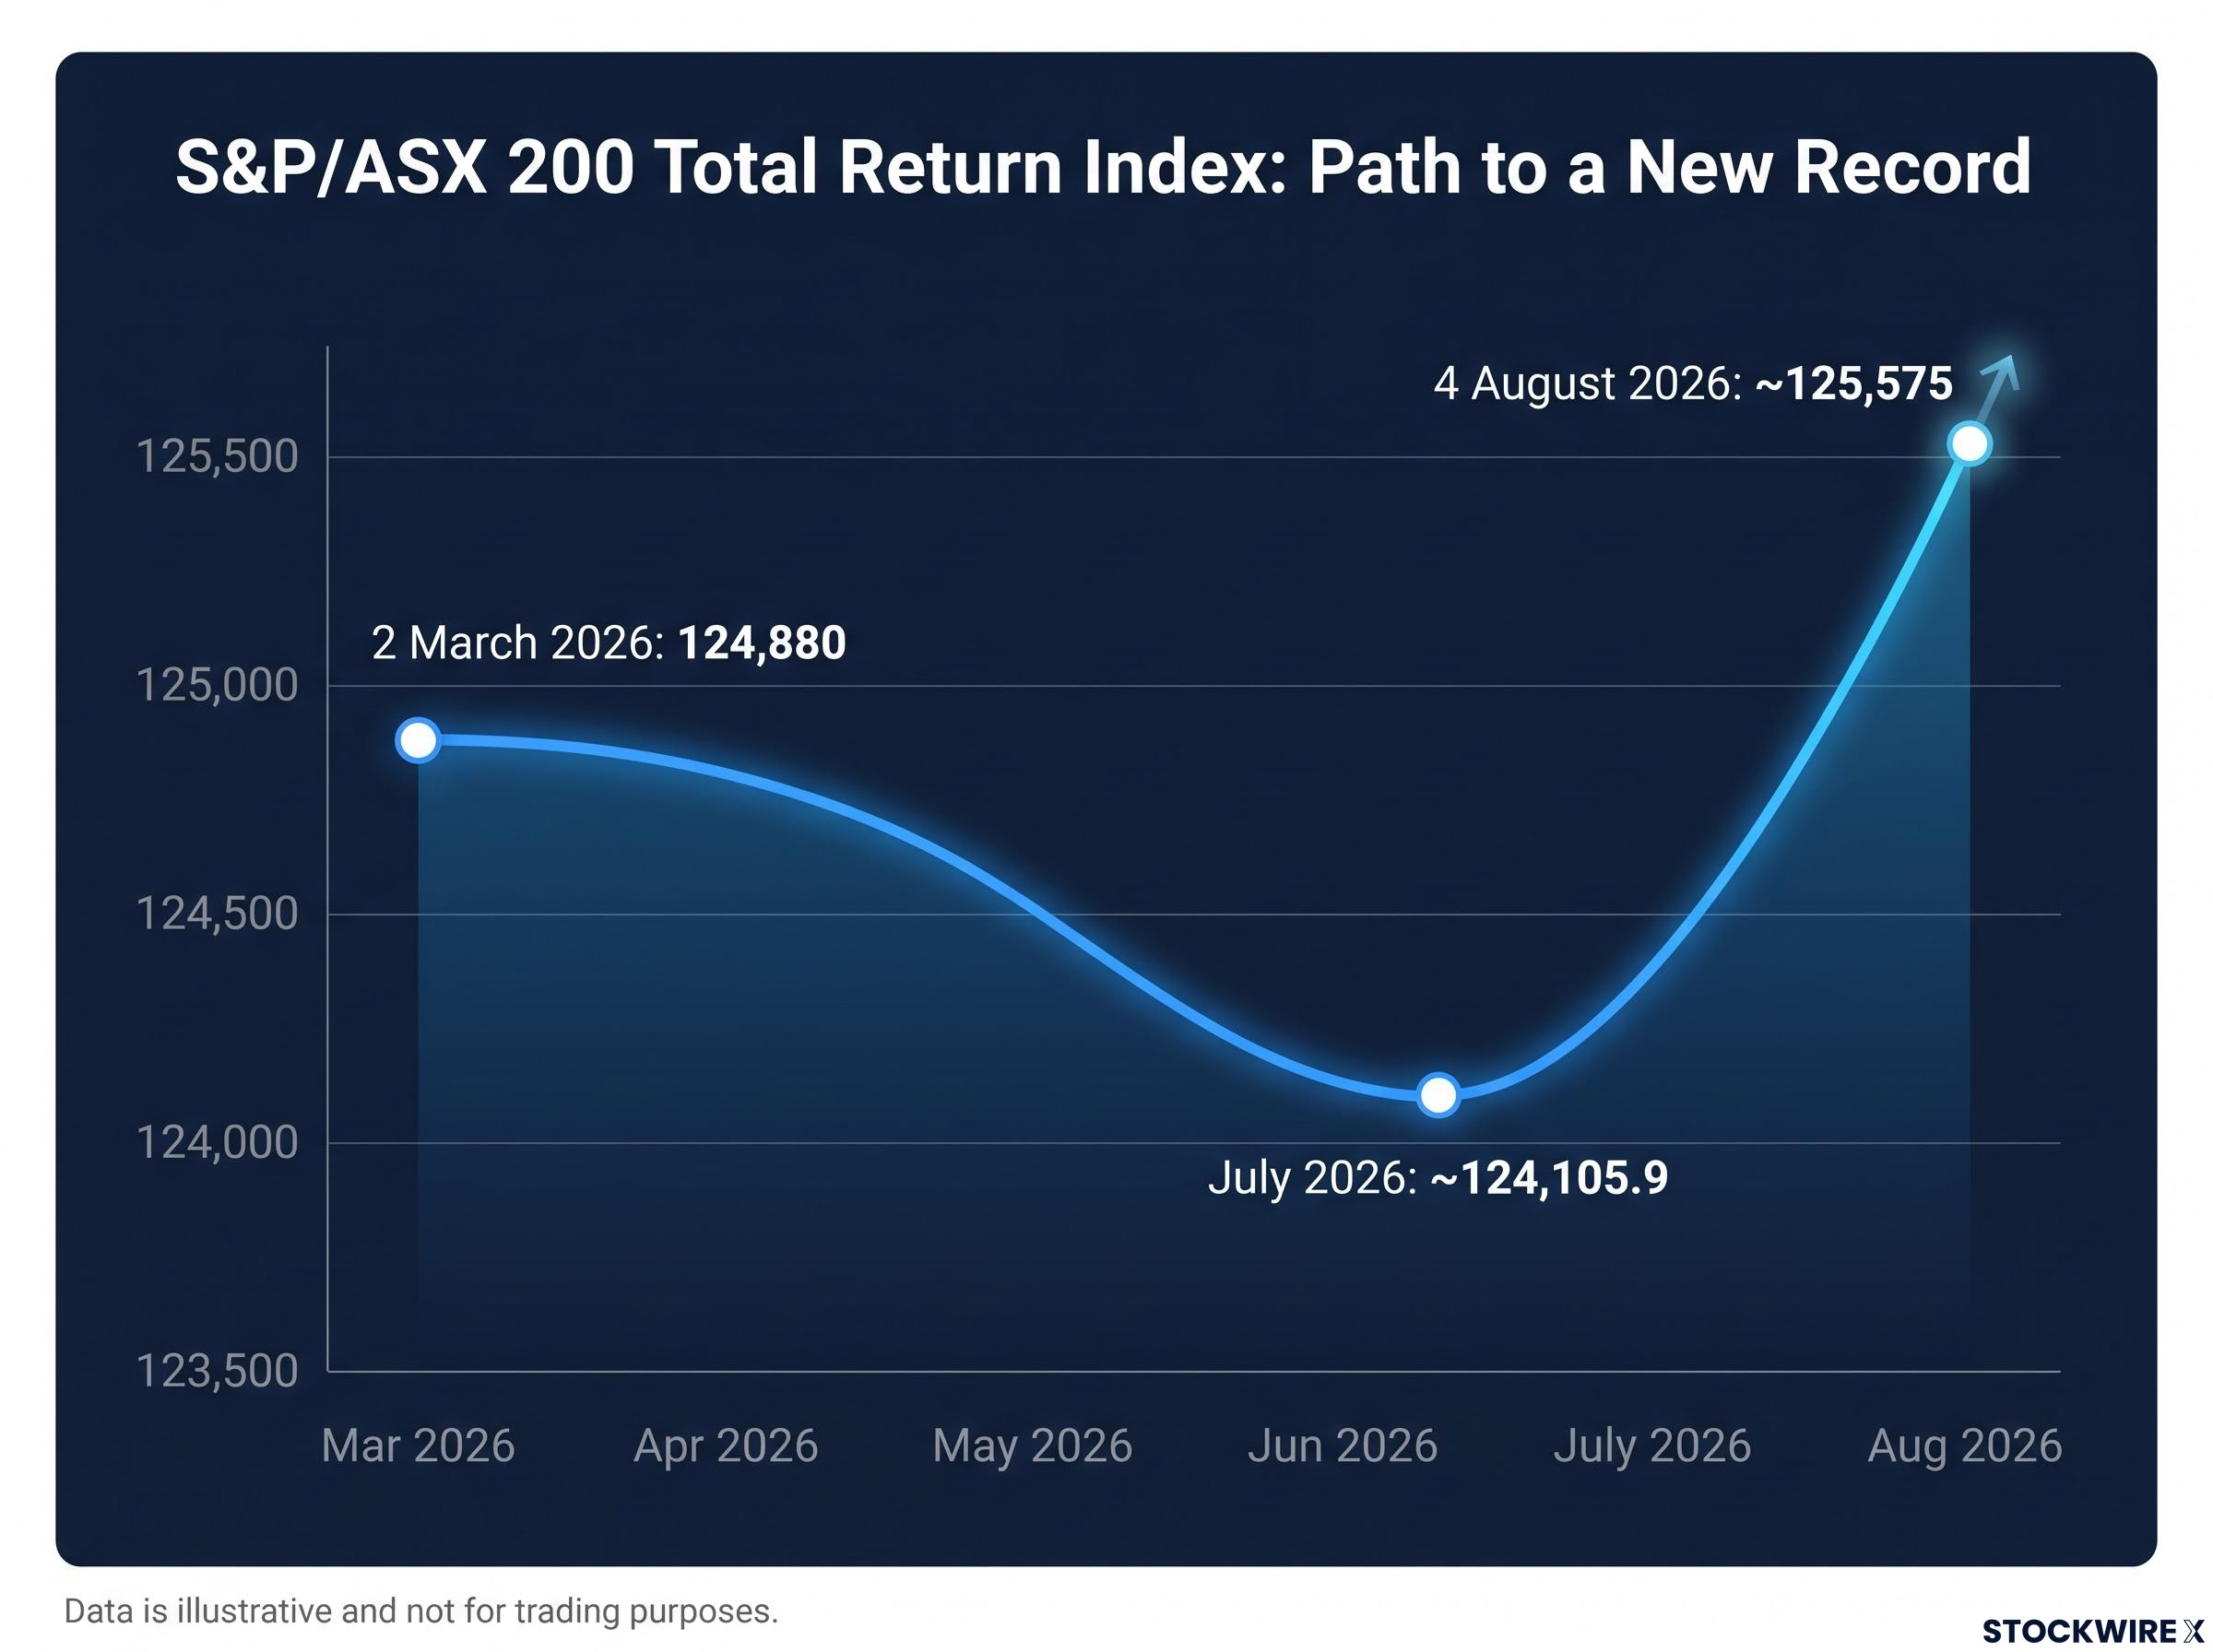
That last point carries real weight. The post-March 2026 drawdown took weeks to work through. As recently as July 2026, the Total Return Index sat at approximately 124,105.9, still below the prior peak.
Total Return Index estimated close: ~125,575 (4 August 2026)
Clearing the old high after a multi-month drawdown is a different signal than a short-term bounce. For investors who held through the volatility, particularly superannuation funds and dividend reinvestors, it confirms that cumulative total returns have now recovered and exceeded the previous peak. That is the measure that most closely mirrors what long-term holders actually experienced.
When big ASX news breaks, our subscribers know first
Five advancers for every decliner: reading the breadth behind the headline
Across the broader S&P/ASX 300, the session saw 238 advancing stocks set against only 47 decliners, producing an advance-decline ratio of just under five to one. That breadth figure is the structural signature of the day.
ASX market breadth data from May 2026 had told a different story entirely, with 84.5% of ASX 200 constituents trading at least 10% below their 52-week highs even as the headline index held near flat, a reminder that the gap between index-level signals and constituent-level reality can be wide and consequential.
| Index | Close | Change |
|---|---|---|
| S&P/ASX 200 | 9,145.8 | +1.40% |
| All Ordinaries | 9,311.9 | +1.46% |
| Small Ordinaries | 3,401.8 | +1.81% |
| Emerging Companies | 2,857.3 | +2.06% |
| All Technology | 3,068.6 | +3.42% |
The ASX 200 ended the day at its session ceiling, indicating that demand was continuous across the trading hours rather than the product of a late-day push.
Small caps and emerging companies join the move
The Small Ordinaries gained +1.81% and the Emerging Companies Index added +2.06%, both outpacing the main benchmark. That matters because small-cap participation signals something different from large-cap leadership alone.
When investors extend risk down the capitalisation spectrum, it suggests genuine confidence rather than defensive repositioning within blue chips. A 5:1 advance-decline ratio paired with small-cap outperformance is more consistent with a broad cyclical risk-on phase than a narrow move distorted by a handful of mega-caps.
The AI infrastructure trade arrives on the ASX
US technology equities surged overnight on renewed enthusiasm for AI infrastructure and semiconductor spending, and the momentum fed through directly into domestic tech names. The ASX 200 Information Technology sub-index (XIJ) gained +3.93% to close at 1,854.7, the strongest sector performance of the session.
XIJ: +3.93%, the session’s top-performing sector
The breadth within tech mirrored the broader market’s pattern. Gains were not confined to one end of the spectrum.
| Stock | Ticker | Gain (%) | Close |
|---|---|---|---|
| Life360 | 360 | +11.4% | $28.47 |
| Digico Infrastructure REIT | DGT | +6.2% | $2.73 |
| Appen | APX | +6.0% | — |
| Catapult Sports | CAT | +6.0% | $3.51 |
| Megaport | MP1 | +5.7% | $18.97 |
| Xero | XRO | +3.5% | — |
| WiseTech Global | WTC | +3.0% | — |
Life360 recorded its largest single-day advance in several months, while speculative names like Appen and Catapult moved alongside established large-caps Xero and WiseTech Global. When both ends of the quality spectrum advance together on a single theme, it tells you the buying is thematic and broad, not stock-specific. That changes how you should read any individual move within the cohort: this was a sector-level impulse, not a series of isolated stories.
Australian technology stocks have historically been viewed as domestically focused plays. This session suggests the market is treating local tech as part of the global AI ecosystem, which shifts both the valuation framework and the correlation with offshore markets.
Why rare earths and critical minerals outran the big miners
The ASX 200 Materials sub-index (XMJ) gained a relatively modest +1.08% to 23,507.0. That headline masked a much more interesting divergence underneath.
| Stock | Ticker | Gain (%) | Close |
|---|---|---|---|
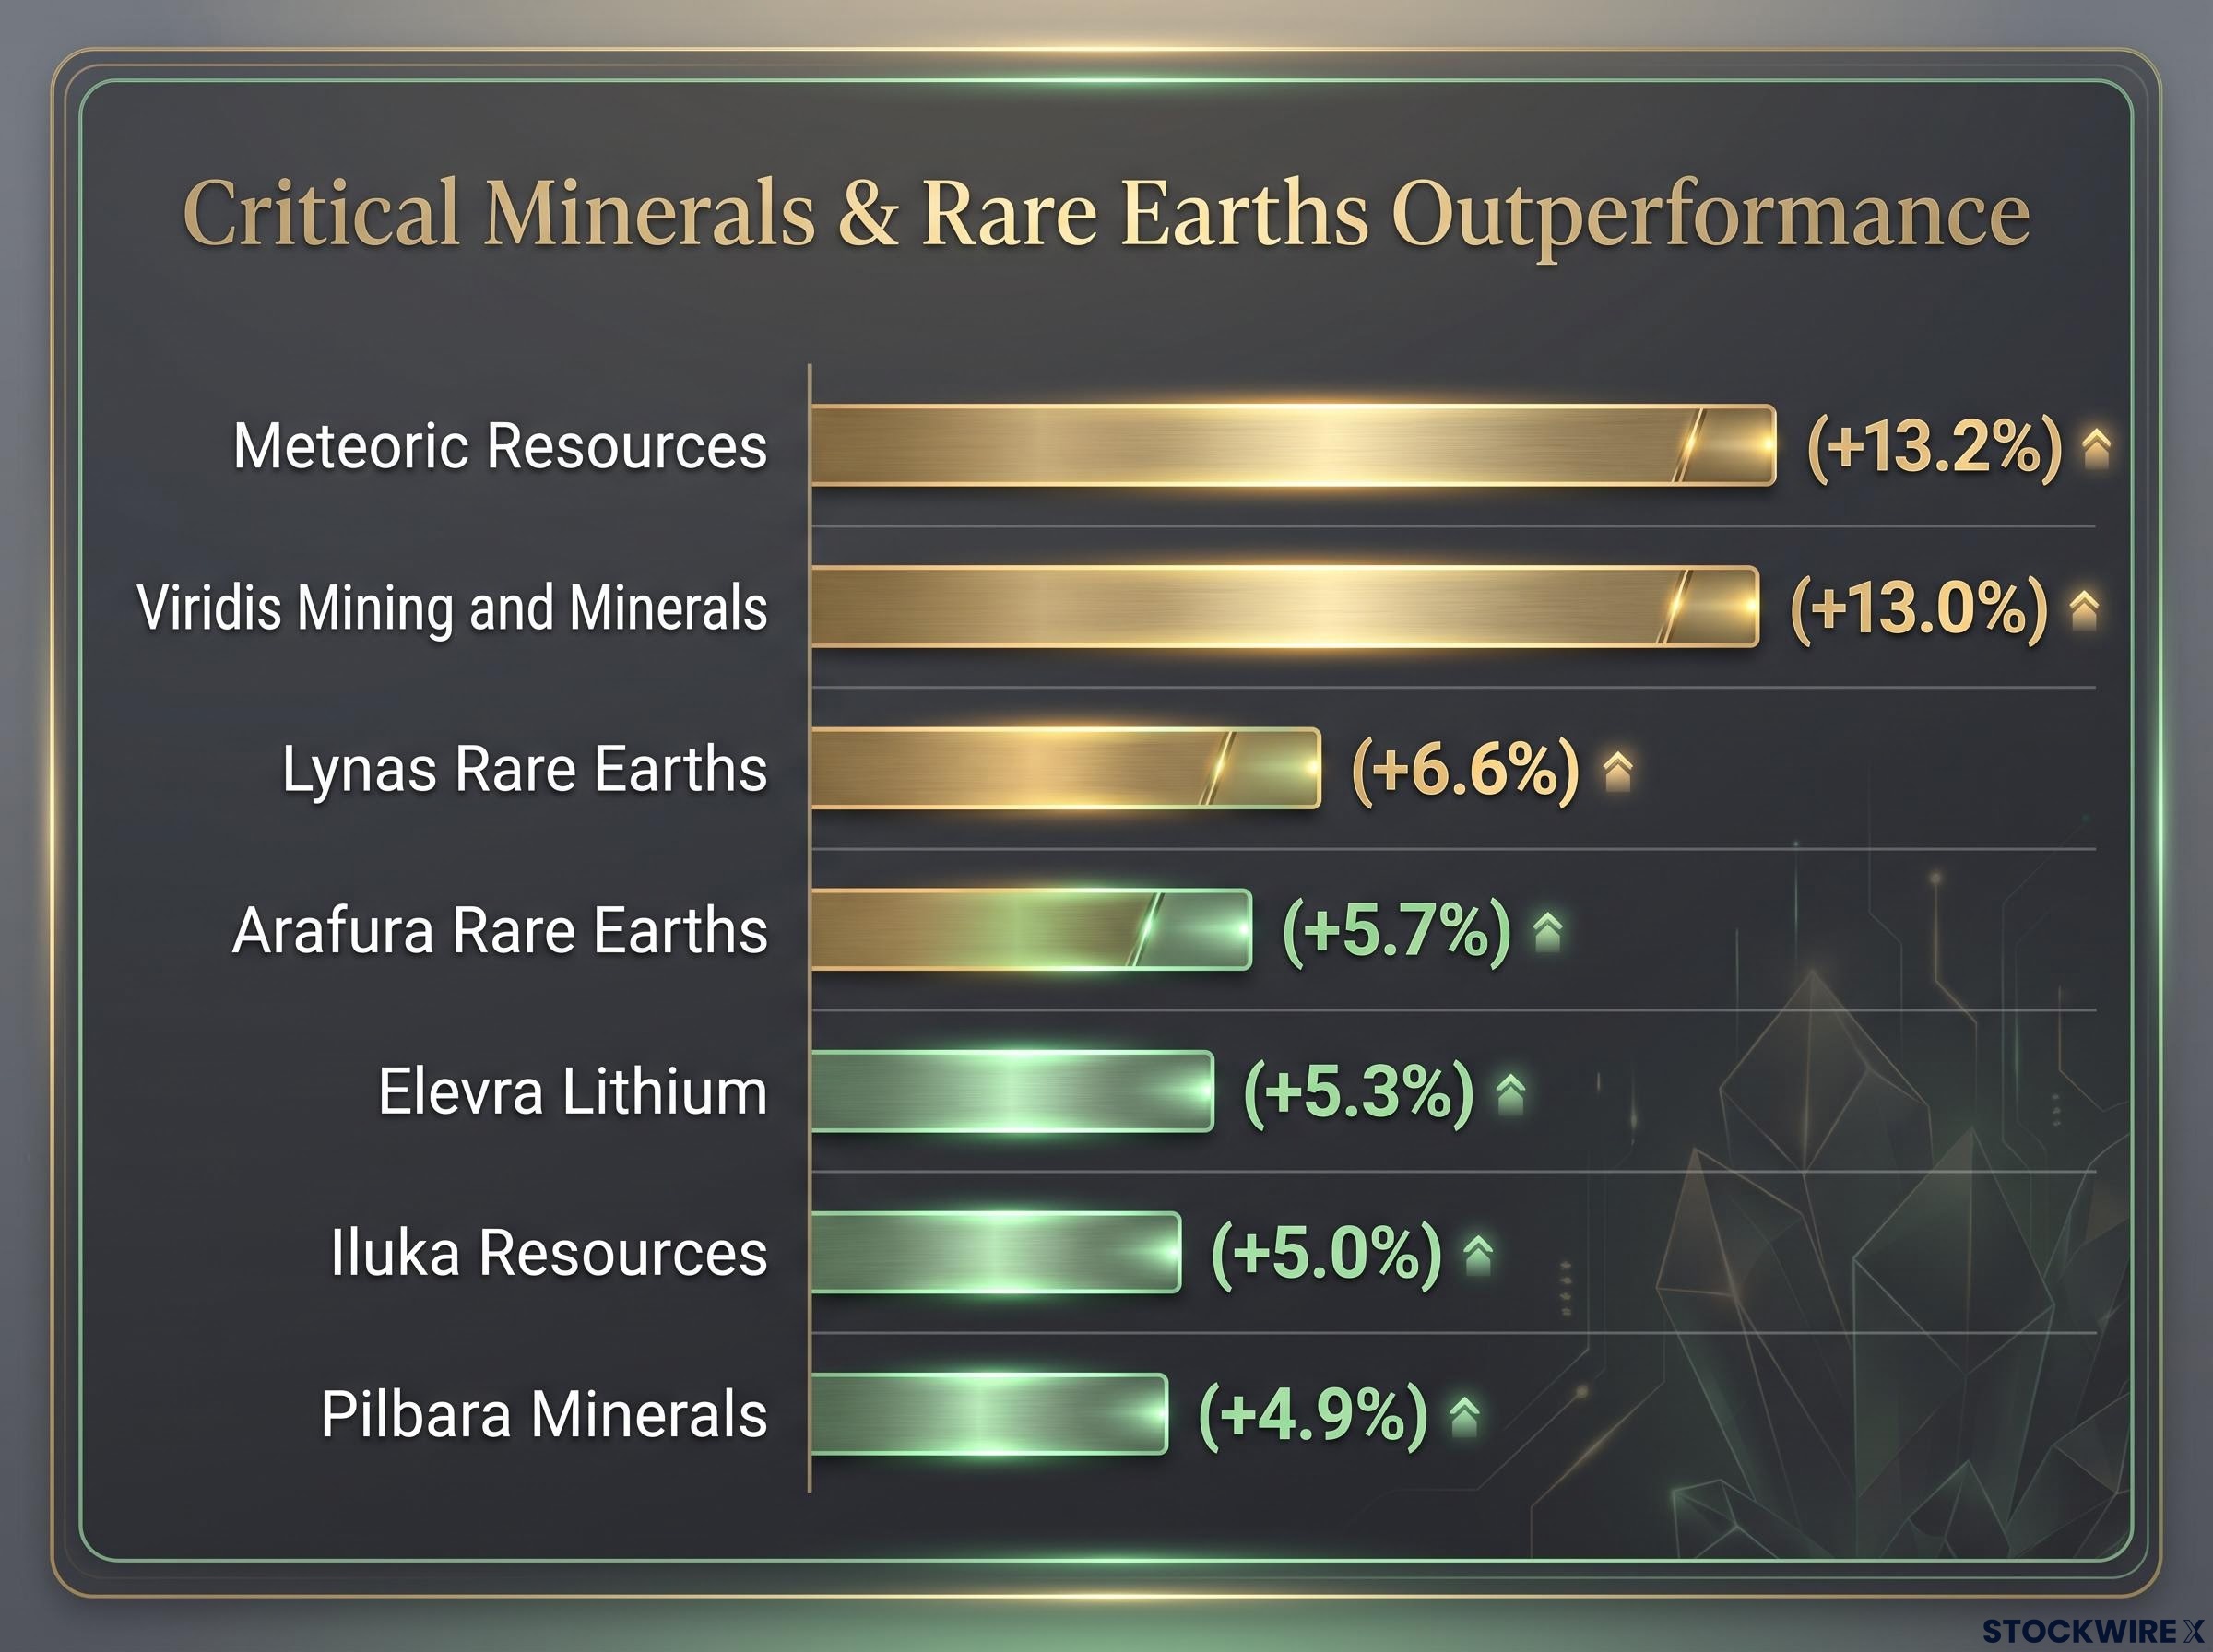
| Meteoric Resources | MEI | +13.2% | $0.22 |
| Viridis Mining and Minerals | VMM | +13.0% | $3.73 |
| Lynas Rare Earths | LYC | +6.6% | $14.96 |
| Arafura Rare Earths | ARU | +5.7% | $0.19 |
| Elevra Lithium | ELV | +5.3% | $7.61 |
| Iluka Resources | ILU | +5.0% | — |
| Pilbara Minerals | PLS | +4.9% | — |
None of these stocks reported company-specific news on the day. When a cohort moves together without individual catalysts, that is sector-level thematic buying, not stock picking.
The thematic connection investors are drawing runs through three demand vectors:
- Data centres and advanced semiconductors: Rare earths are used in high-performance magnets, capacitors, and components that AI hardware requires at scale.
- EVs and battery storage: Lithium and rare earths are upstream inputs to the battery and motor supply chains powering electrification.
- Defence and advanced manufacturing: Secure rare-earth supply chains are increasingly treated as a strategic priority by governments funding AI and defence programmes.
Gains of 5-13% across multiple names without company-specific catalysts tell you that institutional investors are now treating Australian upstream producers as structural beneficiaries of the AI infrastructure buildout. Australia’s resource base is being repriced through the lens of AI and energy transition demand, not just traditional commodity cycles.
The investor logic linking rare earths to AI spending mirrors the repricing thesis already building around copper and battery metals, where AI-optimised hyperscale data centres consume upwards of 15,000 tonnes of copper per facility and battery metals face simultaneous demand from three normally uncorrelated streams: AI infrastructure, electrification, and geopolitical energy security.
Financials and healthcare add weight to the conviction signal
If the session had ended with tech and critical minerals leading, it would be a thematic rally story. The participation of financials and healthcare is what upgrades it to a broad market re-rating.
Banks rally in step with growth stocks
The ASX 200 Financials sub-index (XFJ) gained +1.93% to 10,127.0. In a growth-led risk-on session, financials would ordinarily be expected to sit out the move rather than keep pace. All four major banks advanced:
- Macquarie Group (MQG): +3.1% (closed at a new all-time high)
- National Australia Bank (NAB): +3.0%
- ANZ: +2.4%
- Westpac (WBC): +1.7%
- Commonwealth Bank (CBA): +1.6%
Macquarie Group closed at a new record price, reflecting its structural exposure to capital markets, commodities, and infrastructure, all sectors where AI and energy transition capital is flowing.
When banks rally alongside technology and healthcare growth names, it signals that market participants are confident about both the economic outlook (credit quality, loan growth) and the funding conditions that sustain higher equity valuations. That is a qualitatively different signal than a tech-only move.
Healthcare re-rates, not just rotates
The ASX 200 Health Care sub-index (XHJ) gained +2.36% to 27,540.1, the session’s second-strongest sector.
4DMedical (4DX) rose +8.6% to $4.30. Clarity Pharmaceuticals (CU6) added +6.8% to $2.52. Pro Medicus (PME) gained +4.9%, and CSL advanced +3.6%, building on the gradual comeback it has staged after a tough run earlier in 2026.
The co-movement matters. When high-beta innovation names advance alongside a bellwether like CSL, it points to a broader re-rating of growth healthcare valuations rather than a narrow speculative pop. A defensive rotation would look different: large-cap defensives outperforming while small-caps lag. That is not what happened here.
Domestic data gave the rally a local foundation
Two economic releases on 4 August 2026 both came in above expectations, giving the rally a domestic leg that complemented the global AI impulse.
- ANZ Job Advertisements (July 2026): The monthly reading came in at +0.8%, swinging back into growth after a -0.1% result in June 2026. (Note: an alternate source reported this figure as +2.0% month-on-month. The 0.8% figure is the primary verified reference pending further confirmation.)
- Household Spending (June 2026): Monthly spending growth landed at +0.8%, well ahead of the consensus estimate of +0.2%. The prior month had also delivered a strong +1.3% reading, making it two consecutive months of outperformance.
The household spending result is the one worth pausing on. A reading that runs four times the consensus forecast, in consecutive strong months, is not just a statistical beat. It tells you consumer resilience has outlasted the rate cycle pressure, which has direct implications for bank earnings quality, retail sector valuations, and the near-term recession probability that a number of forecasters had been building into their models.
The household spending beat of +0.8% against a +0.2% consensus estimate carries particular weight when set against the Australia recession risk narrative that had been building through mid-2026, with consumer sentiment collapsing to 80.6, dwelling prices falling, and rate hikes compressing discretionary capacity across the same quarter.
The AUD/USD rose +0.18% to 0.7013, consistent with global investors adding risk exposure and a perception that Australia’s economy and terms of trade remain firm. Investors who tracked only the global AI narrative would have missed half the story.
What today’s record does and does not guarantee
The Total Return Index record at ~125,575 genuinely confirms that cumulative investor wealth, including dividends, is at its highest point on record. For long-term holders who stayed through the post-March 2026 drawdown, that is a real outcome worth acknowledging.
The composition of the leadership that created it, however, deserves equal attention. The session’s sector hierarchy (tech +3.93%, healthcare +2.36%, financials +1.93%, materials +1.08%) reveals the thematic concentration within the breadth.
A record built on thematic leaders carries a specific vulnerability: the same stocks that drove today’s high could reverse faster than diversified-market history would suggest if the underlying expectations shift.
Three variables are worth monitoring from here:
- AI capital expenditure signals from major US technology companies, which set the pace for the global AI infrastructure trade that now directly influences Australian tech and critical minerals stocks.
- Critical minerals pricing, where sustained demand from data centres, EVs, and defence programmes will either validate or challenge the repricing already underway.
- Domestic consumption trajectory, particularly whether the household spending strength seen in consecutive months can persist as rate cycle expectations evolve.
A total return record is worth recognising as a long-term outcome. Understanding what built it is how you position for what comes next.
For investors wanting to place the 4 August record in a longer historical context, our full explainer on August ASX 200 seasonal returns examines 45 years of data, including how earnings-season heavyweight results from banks and miners have repeatedly broken seasonal patterns and what reporting season outcomes mean for momentum into September.
This article is for informational purposes only and should not be considered financial advice. Investors should conduct their own research and consult with financial professionals before making investment decisions. Past performance does not guarantee future results.
—