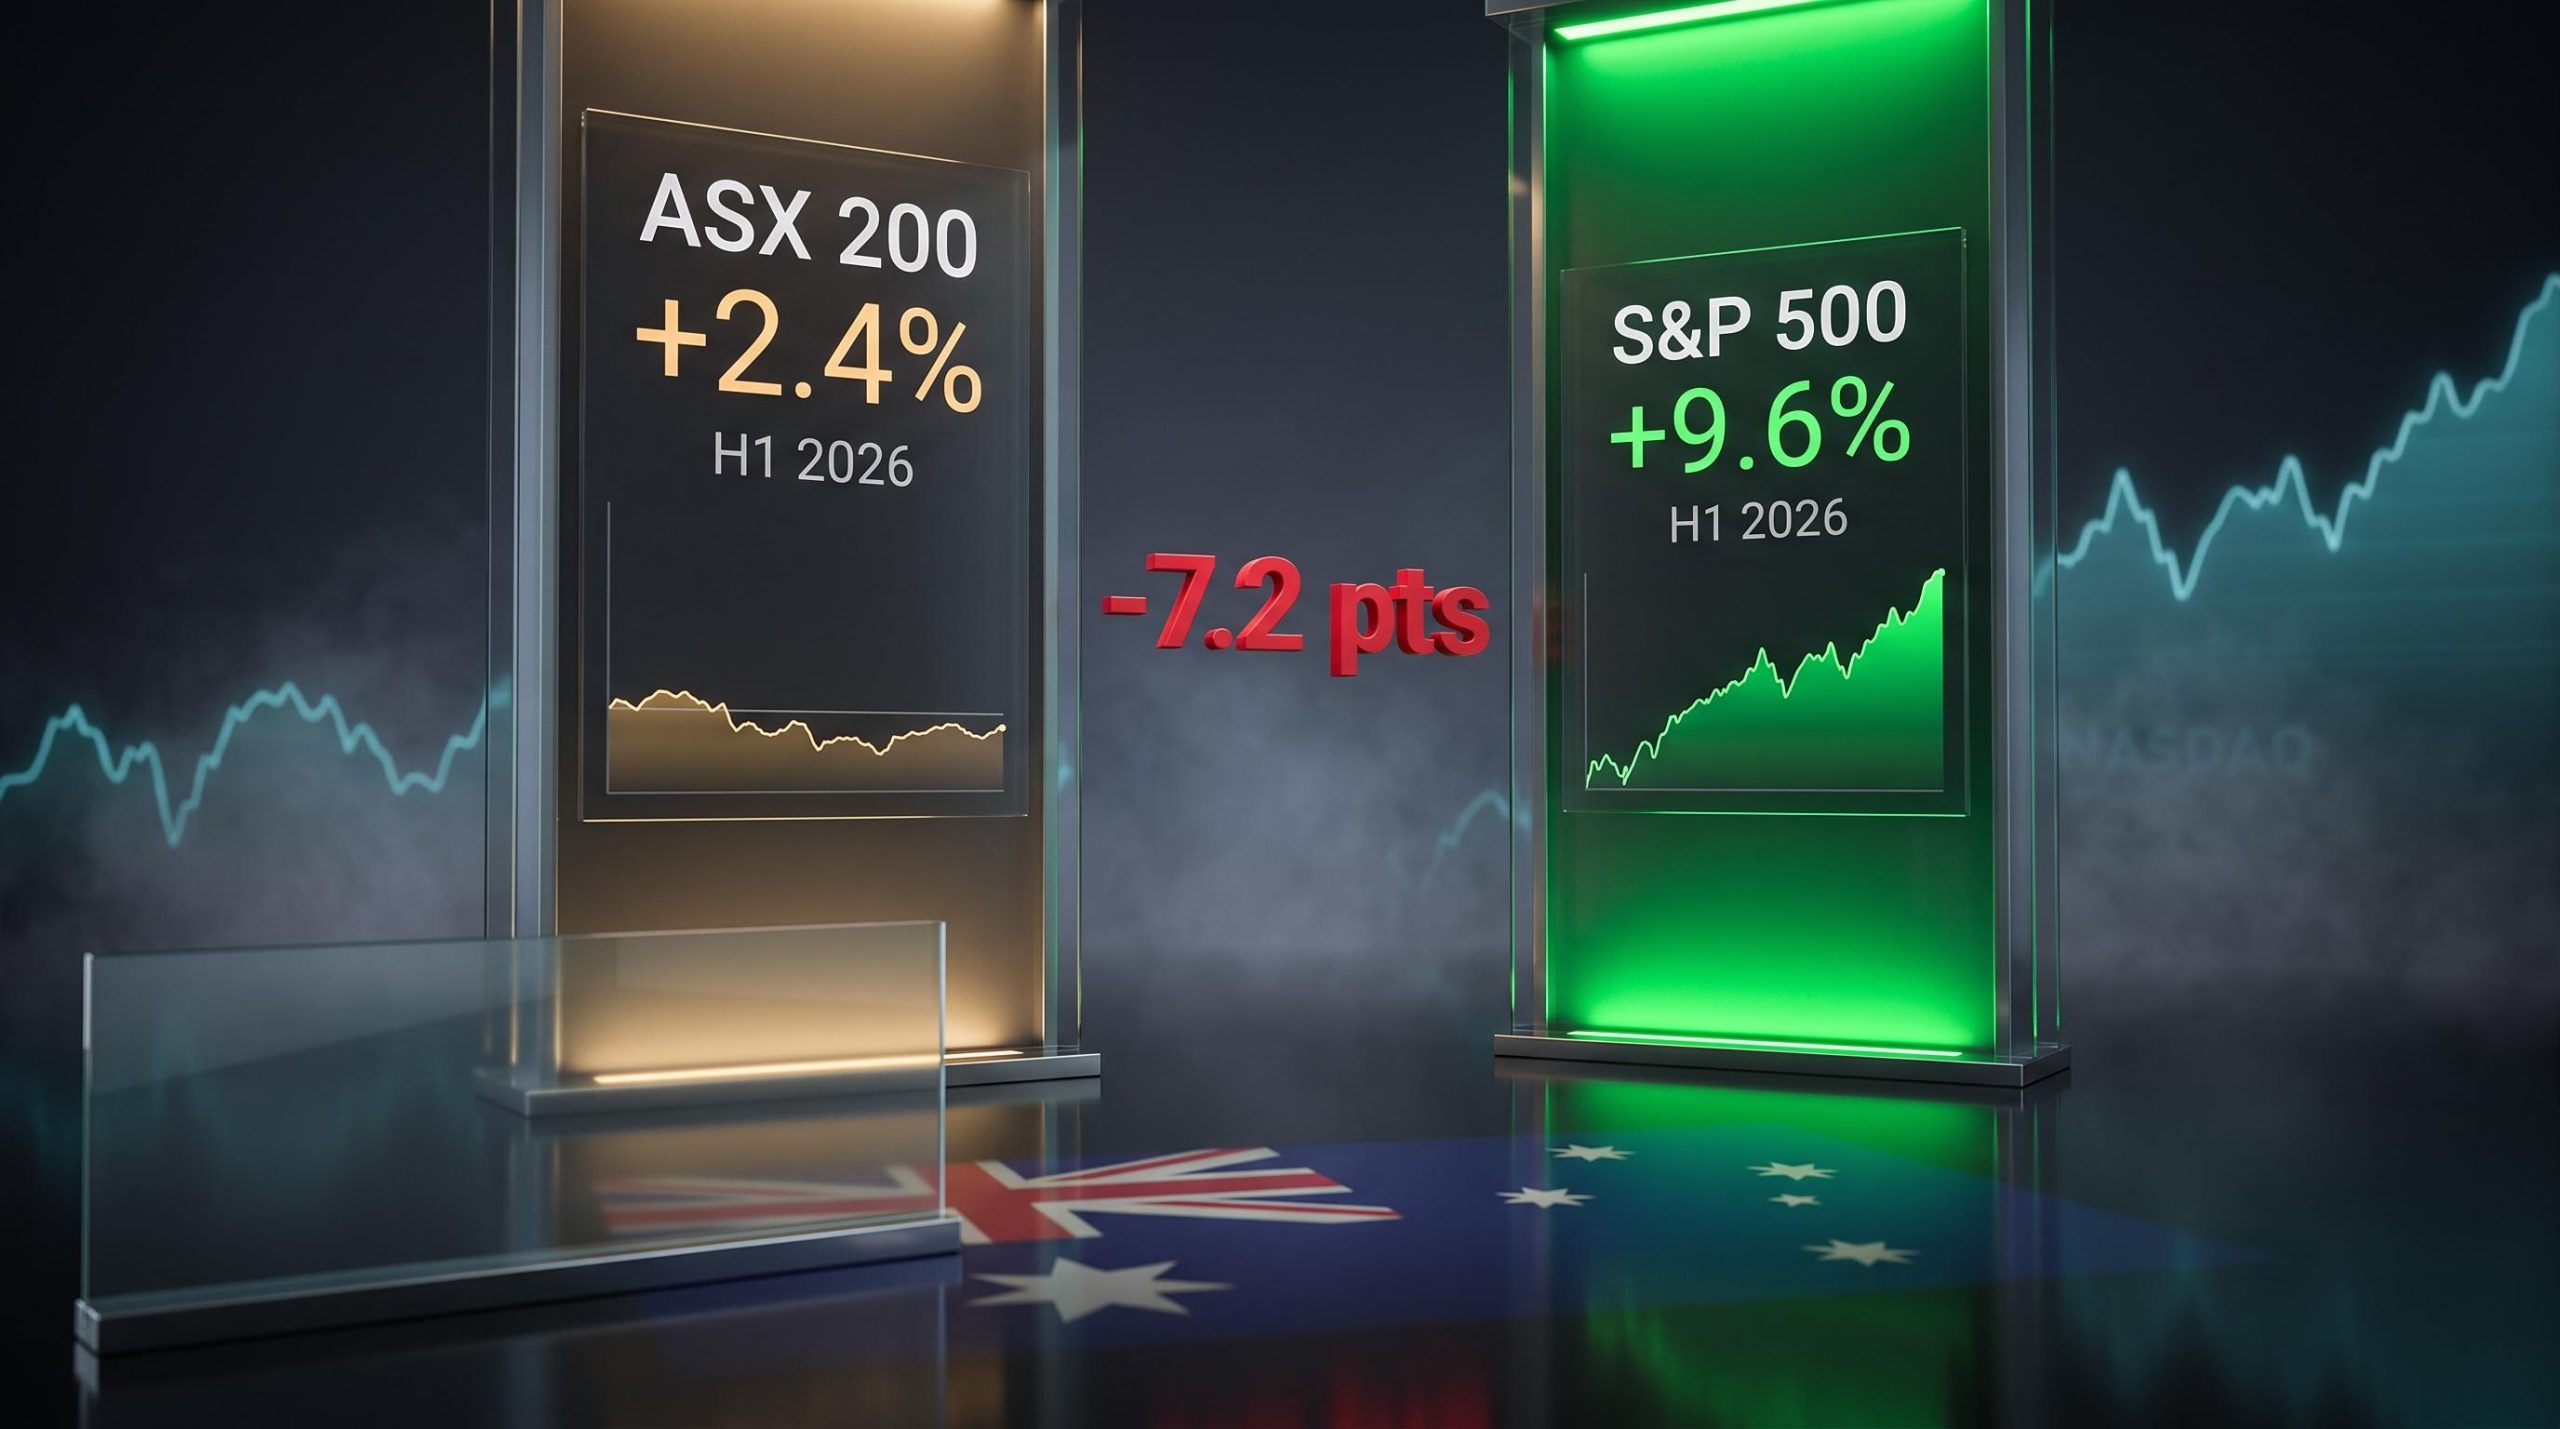
The ASX 200 returned 2.4% in the first half of 2026. Over the same six months, the S&P 500 posted approximately 9.6%. For an Australian investor holding a domestically concentrated portfolio, that is not a rounding error. It is a 7-percentage-point gap that compounds.
Three forces converged to produce that outcome: three consecutive RBA rate hikes, a federal budget that rattled capital gains tax settings, and a global equity rally powered by artificial intelligence stocks that the ASX is structurally unable to participate in. None of these were temporary disruptions. Together, they shaped every domestic portfolio’s first half.
Here is what the data tells you about exactly which forces drove the underperformance, where the ASX found genuine pockets of strength, and what Australian investors should be doing differently with this information heading into H2.
What the numbers actually show: ASX vs. the world in H1 2026
The scoreboard is blunt. The S&P/ASX 200 returned 2.4% over the six months to June 2026, according to the Betashares Australian ETF Review for the half year. The S&P 500 delivered approximately 9.6% in price terms (roughly 10.2% on a total return basis). The Nasdaq recorded high single-digit to low double-digit gains.
Source note: The Betashares Half Year 2026 report attributes the 2.4% figure directly to the S&P/ASX 200 Index (ASX: XJO) and describes it as the lowest gain among major developed market indices for the period.
That last point matters. Among all major developed market indices tracked for H1 2026, the ASX’s return ranked at the bottom of the table.
| Index | H1 2026 return |
|---|---|
| S&P/ASX 200 | 2.4% |
| S&P 500 (price) | ~9.6% |
| Nasdaq Composite | High single-digit to low double-digit |
A 7-8 percentage point gap in a single half is not noise. For Australian investors concentrated in domestic equities, it represents a real, compounding drag, the kind that makes home-country bias visible as a cost rather than a comfort.
When big ASX news breaks, our subscribers know first
Three rate hikes and a tightening vice: how RBA policy hit equities
The RBA hiked the cash rate three times during the half: February, March and May 2026, each by 25 basis points, lifting the cash rate to 4.35%. No further moves followed; the rate held at 4.35% as of June 2026.
That sequence made Australia an outlier. RBA analysis explicitly linked the ASX’s relative weakness to a sharper upward repricing of policy rate expectations in Australia compared with other advanced economies. While many global central banks held steady or signalled easing, the RBA was tightening.
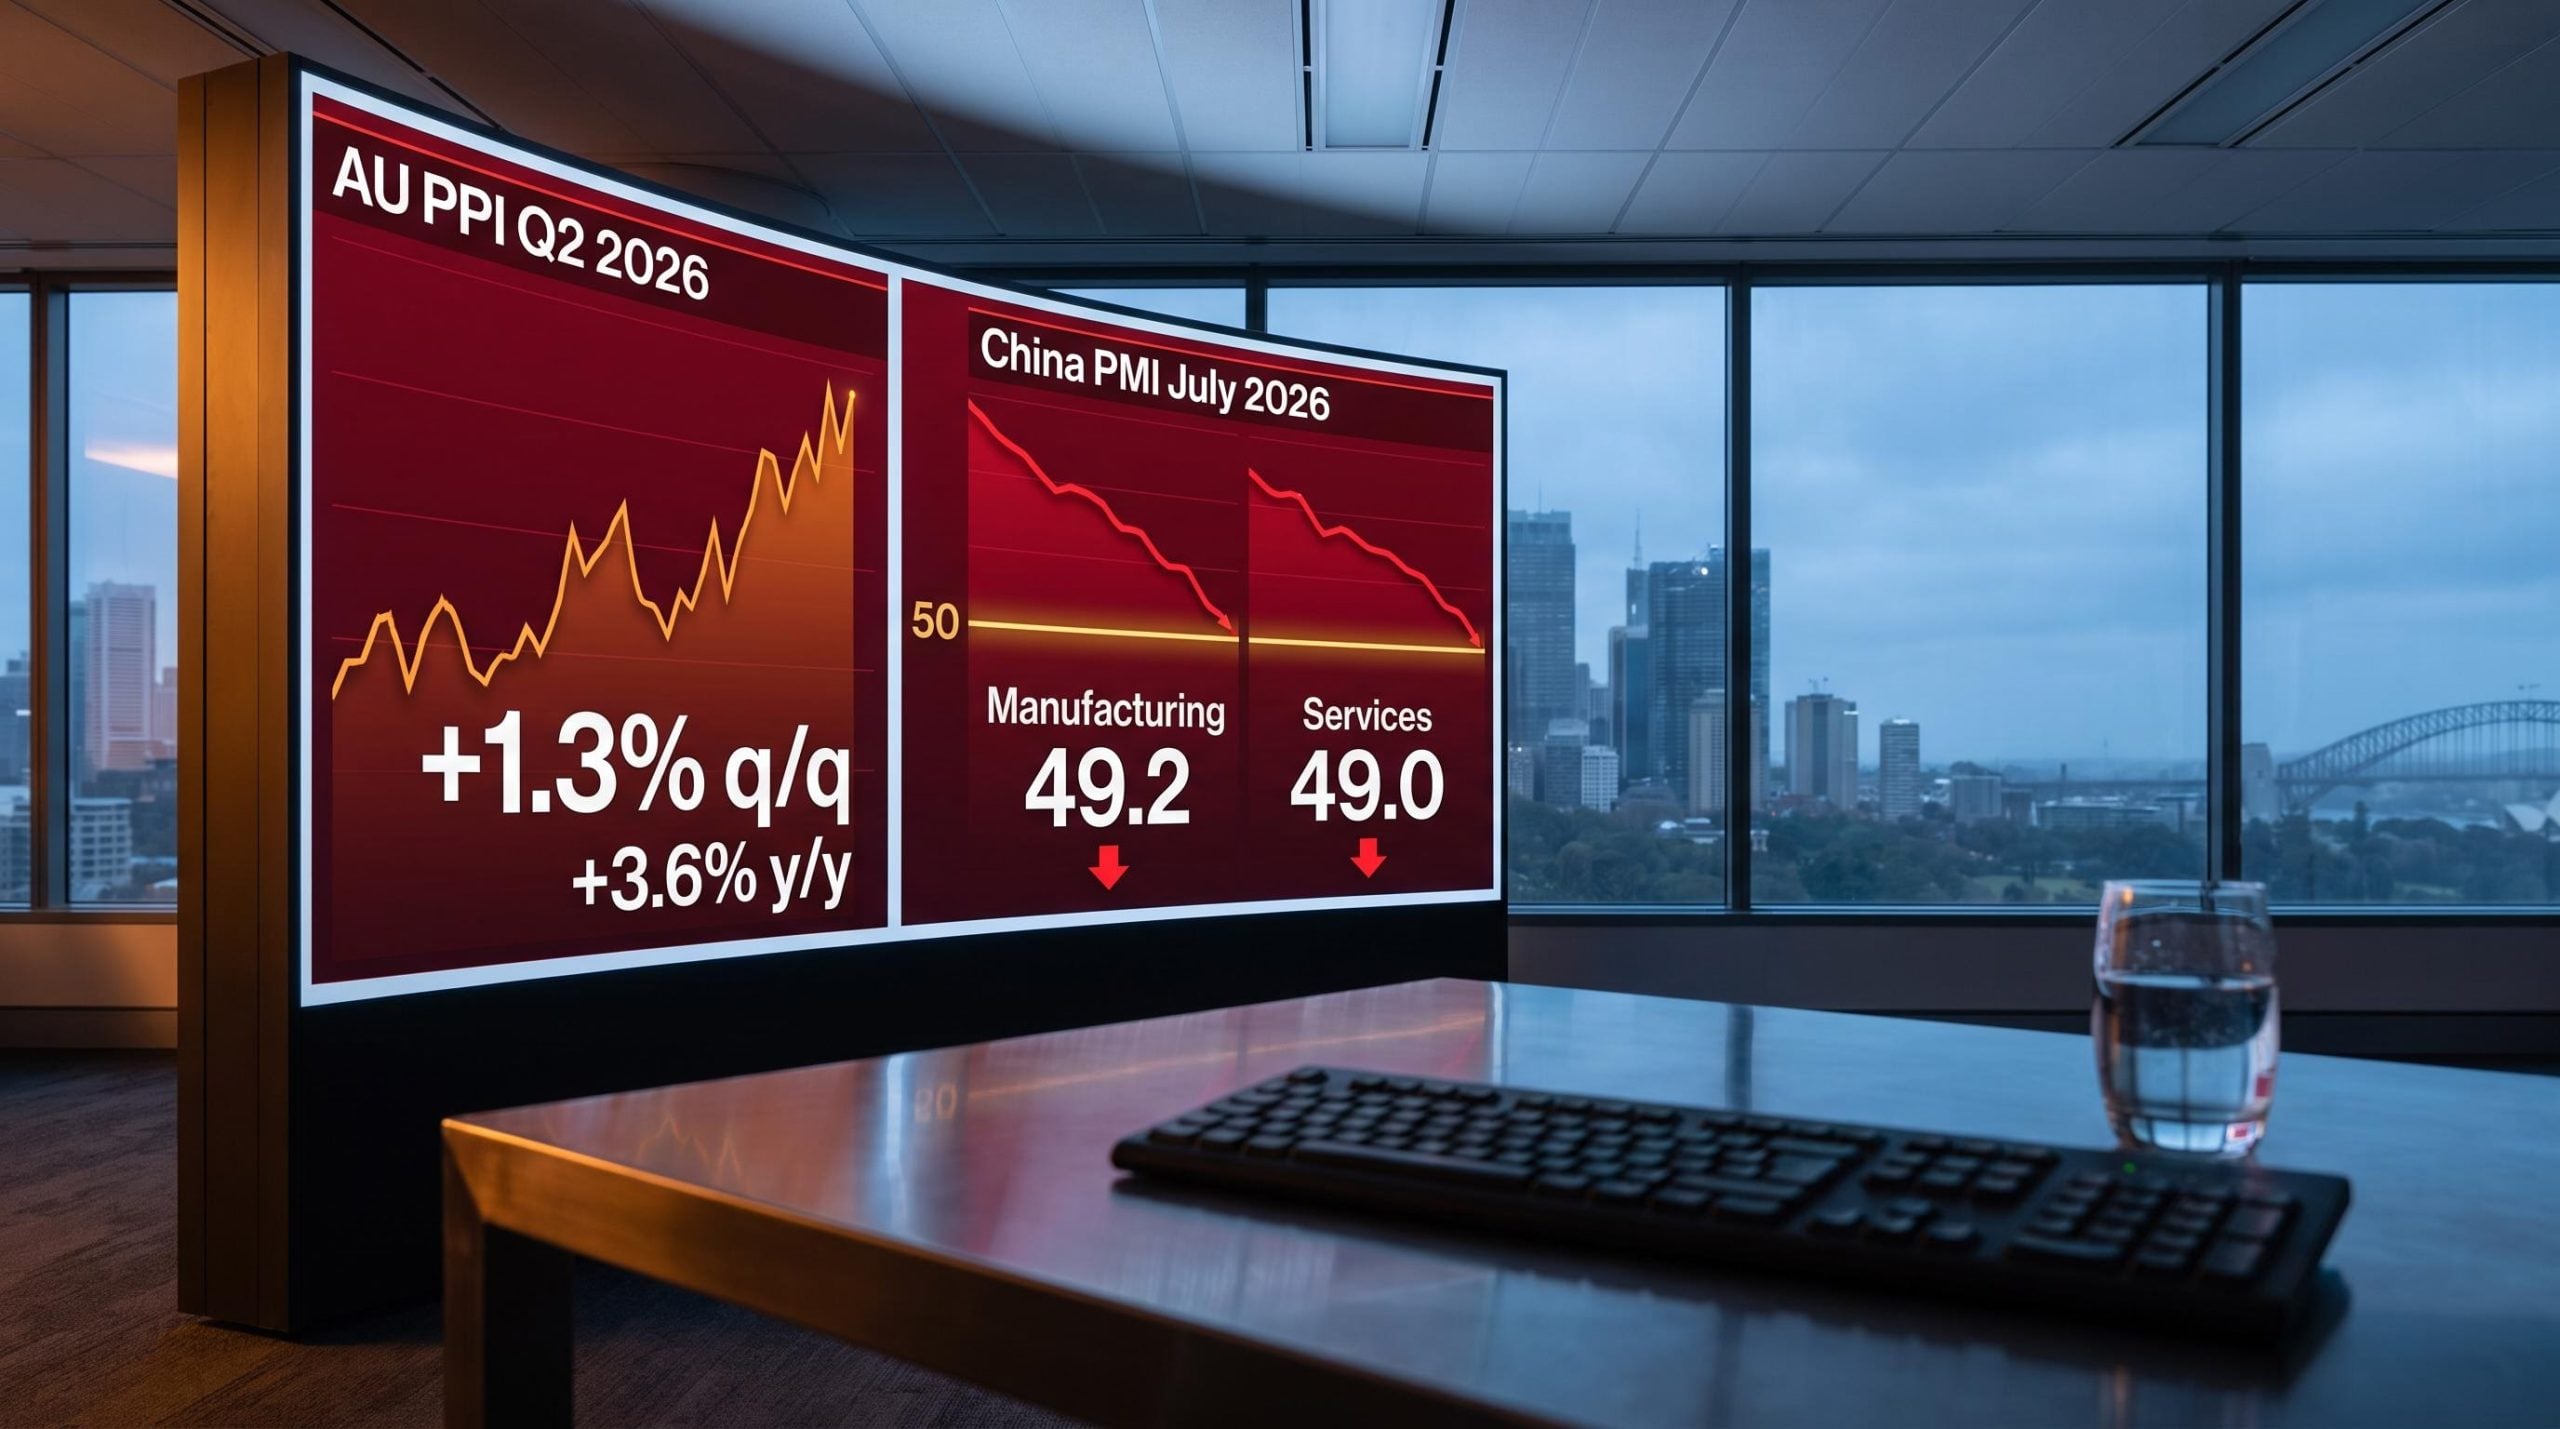
The inflation backdrop driving those decisions was sharper than many investors anticipated: Australia’s headline CPI surged to 4.6% in March 2026, nearly double the top of the RBA’s 2-3% target band, while trimmed mean CPI held at 3.3%, suggesting the headline acceleration reflected volatile energy prices rather than a broad deterioration in underlying inflation.
How rate hikes reach your portfolio: the three channels
The mechanism runs through three distinct channels:
- Valuation compression: Higher discount rates reduce the present value of future earnings. This hits growth stocks and high-multiple industrials hardest, because more of their value sits in earnings years from now.
- Margin and demand pressure: Higher borrowing costs squeeze corporate margins and reduce household disposable income. Retailers, real estate investment trusts (REITs, which are listed property vehicles that distribute rental income to shareholders) and consumer discretionary names feel this most directly.
- Asset class rotation: When the cash rate sits at 4.35%, term deposits and bonds become genuinely competitive with equities for income-seeking investors. Some capital rotates out of shares altogether, a structural shift that had been building since late 2025.
For Australian investors holding leveraged property or growth-oriented equity positions, 75 basis points of tightening in a single half is not a minor adjustment. It is the most direct explanation for why domestic earnings expectations and consumer-facing valuations came under simultaneous pressure.
The budget shock: how May’s tax proposals rattled investor confidence
The 12 May 2026 federal budget introduced two measures that landed squarely on investor sentiment:
- Negative gearing restricted to new builds only, effective 1 July 2027.
- Capital gains tax (CGT) discount replaced by an indexation method and a 30% minimum tax on gains, also effective 1 July 2027. Existing holdings were grandfathered, with the new rules applying only to gains accrued after the effective date.
The changes compounded the rate headwind rather than coinciding harmlessly with it. Market strategists described the combination of RBA hikes, elevated inflation, Middle East conflict and the budget tax proposals as a “toxic backdrop” for the local market.
The CGT overhaul introduced in the 12 May budget was the most significant shift in Australian investment tax settings since 1999, replacing the 50% discount with a cost base indexation model and a 30% minimum tax on net capital gains above $20,000 for individuals, while SMSFs remained fully exempt, widening the structural tax advantage of superannuation by approximately 20 percentage points on exit.
Market commentary characterised the convergence of rate hikes, inflation, geopolitical risk and CGT proposals as a “toxic backdrop” for Australian equities.
The mechanism here is behavioural as much as financial. CGT proposals affect sentiment and capital allocation at the proposal stage, well before legislative certainty. When future tax rules are unclear, the rational response is to delay realising gains or committing new capital. That collective pause shows up as subdued risk appetite and lower trading volumes, even among investors whose existing holdings were fully grandfathered.
This gives you a framework that applies beyond this specific budget: fiscal policy proposals, not just enacted law, create real portfolio effects through sentiment and decision-making channels.
Why the ASX missed the AI rally: a structural composition problem
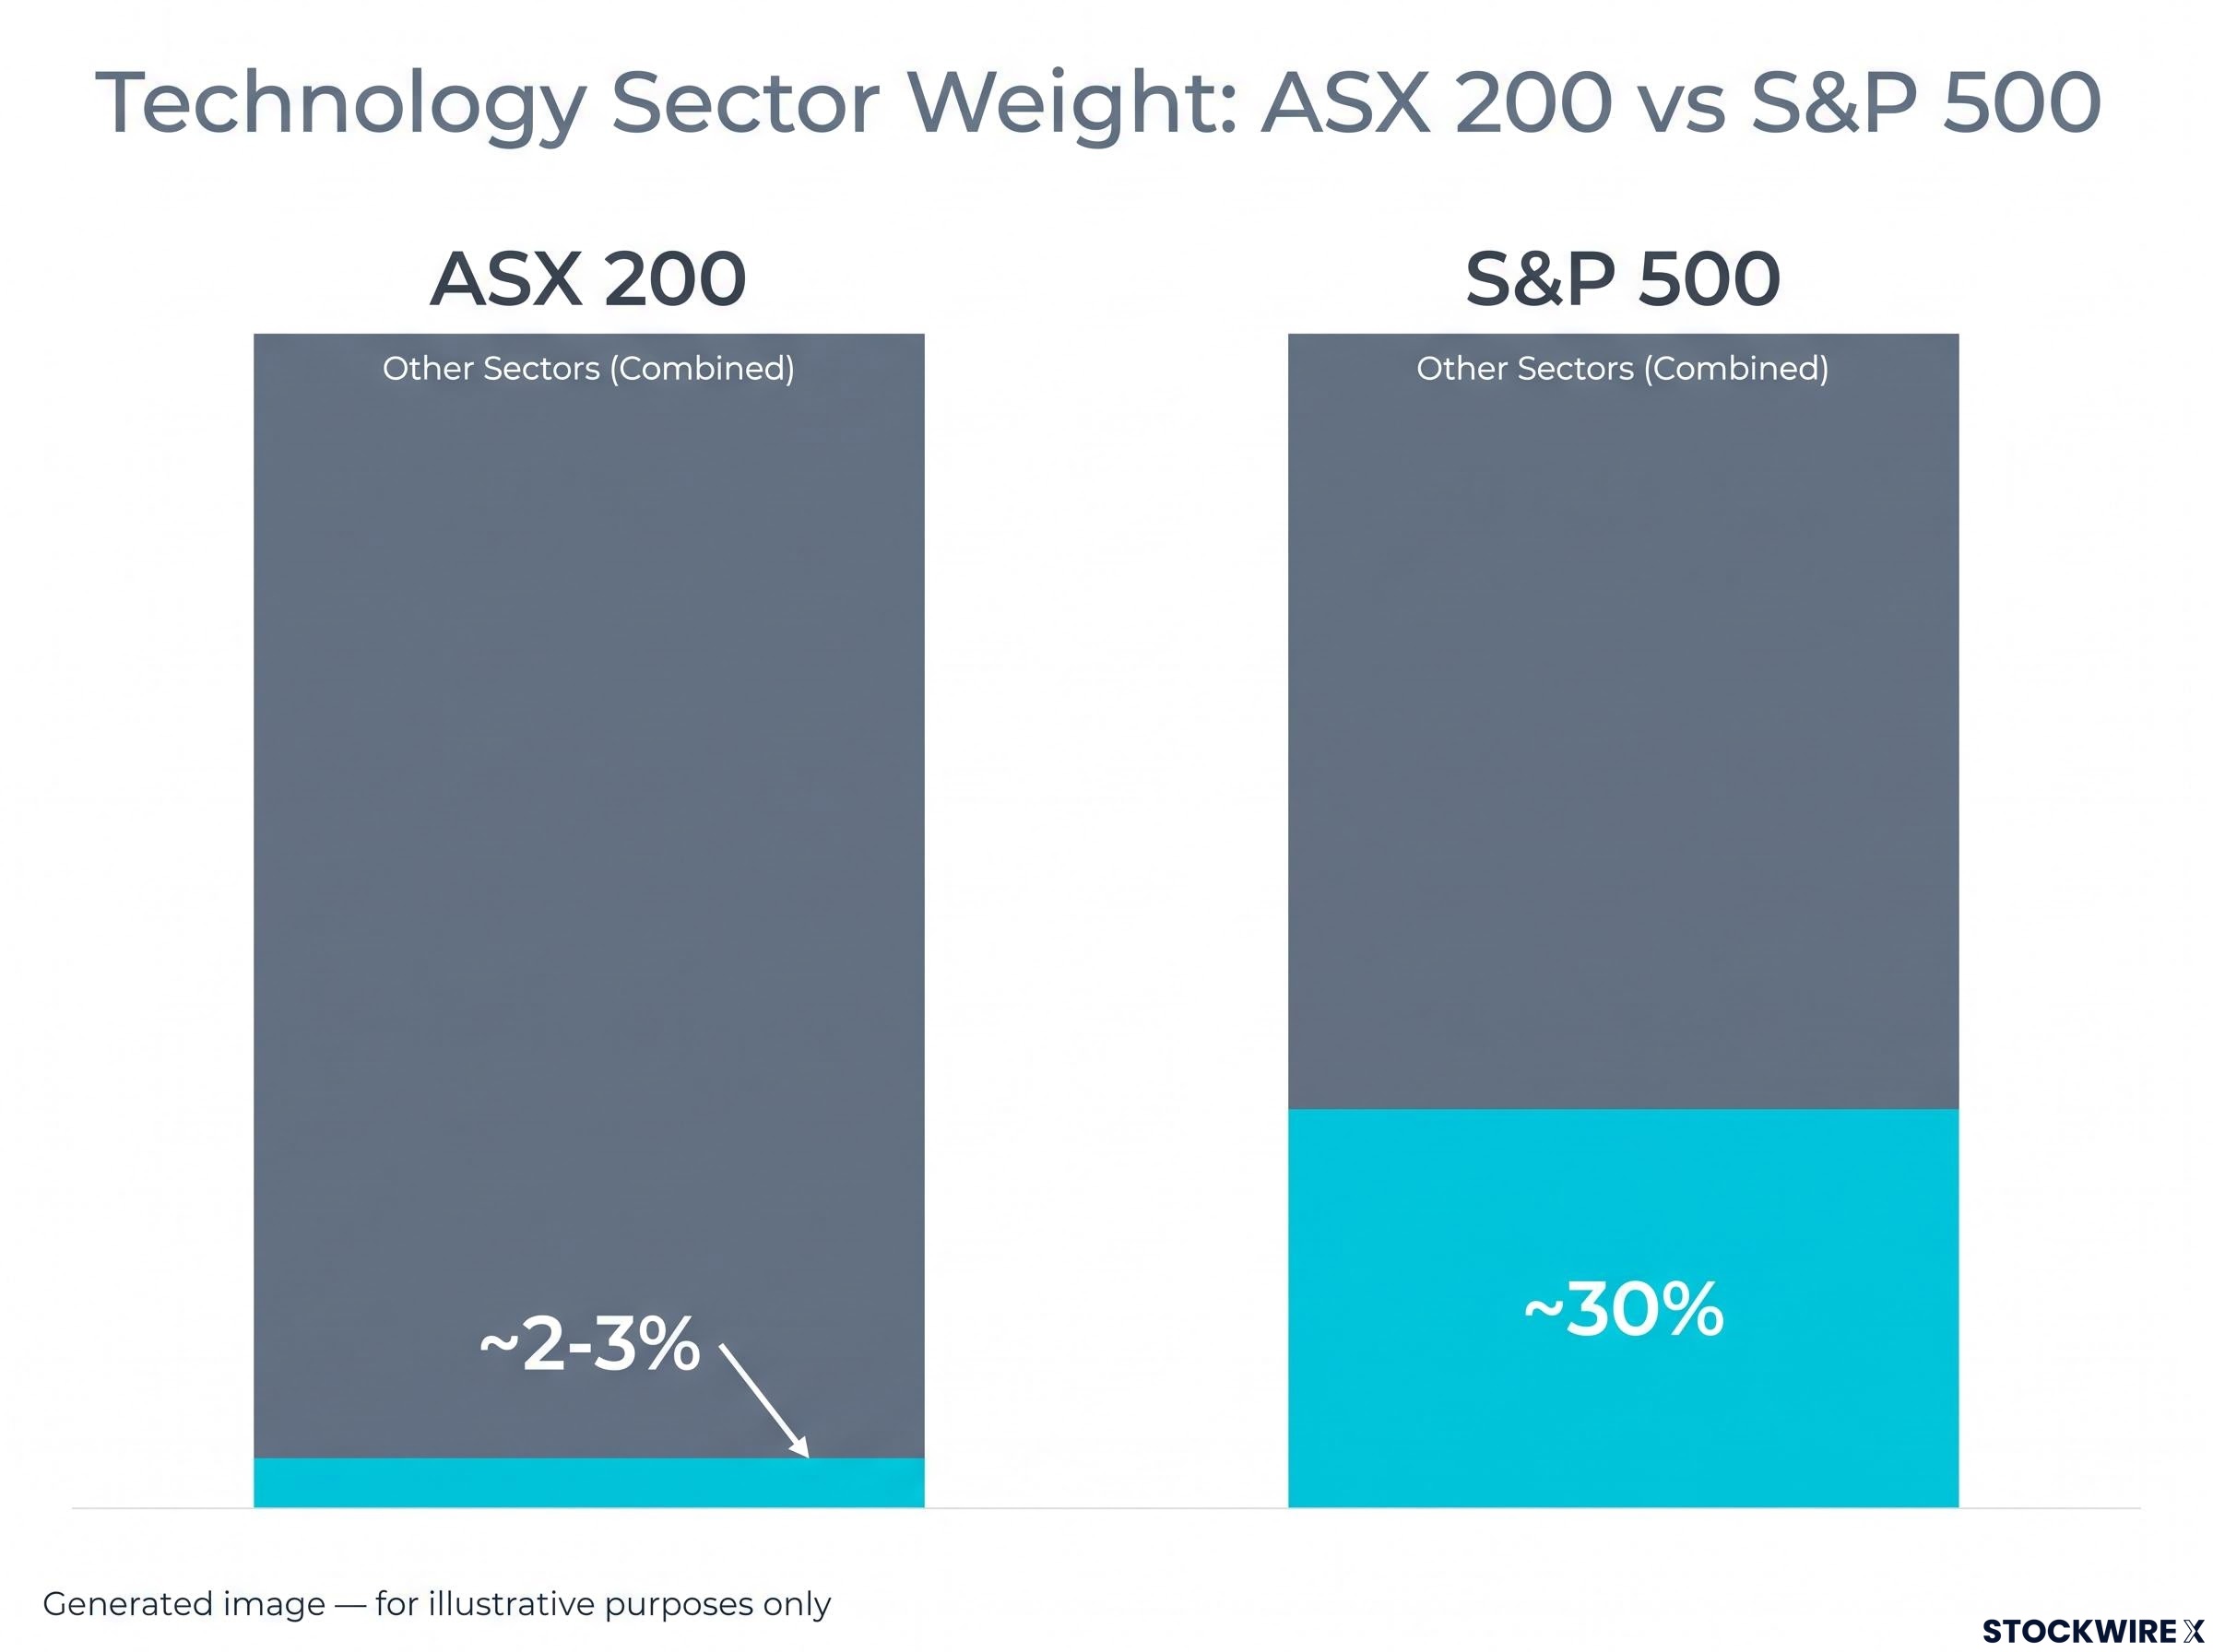
Even without rate hikes or budget uncertainty, the ASX was poorly positioned to capture the dominant return theme of the half. Technology represents roughly 2-3% of the ASX 200. It accounts for approximately 30% of the S&P 500.
| Sector | ASX 200 weight | S&P 500 weight |
|---|---|---|
| Technology | ~2-3% | ~30% |
| Financials | Heavy | Moderate |
| Materials / Energy | Heavy | Moderate |
The AI-infrastructure and semiconductor-driven rally that powered US and Asian equity outperformance simply had no meaningful channel into the ASX. The stocks leading global gains, AI-related semiconductors, memory chipmakers, cloud infrastructure providers, have no equivalent-weight representation on the local index. The ASX’s heavyweights are banks, miners and consumer-facing companies.
To appreciate how large the technology capital flows were, consider that a US$1.5 trillion episode of global software sector selling unfolded within H1 2026 alone, and even that significant drawdown represented just one volatile stretch within a broader technology-driven cycle. The ASX was structurally sidelined from those flows in both directions.
This is not something RBA rate cuts or budget policy reversals can fix. The composition gap is a structural feature of the Australian market that will continue to limit ASX participation in technology-led global cycles. For your portfolio, that means international diversification is a structural need, not a tactical response to one difficult half.
The forces driving market leadership rotation away from US technology are not purely cyclical: valuation spreads between US Tech and international developed markets including Europe and Japan are near multi-decade extremes, with MSCI EAFE trading at roughly a 50-55% forward price-to-earnings discount to the S&P 500 information technology sector as of mid-2026.
Where the ASX held its ground: the materials sector exception
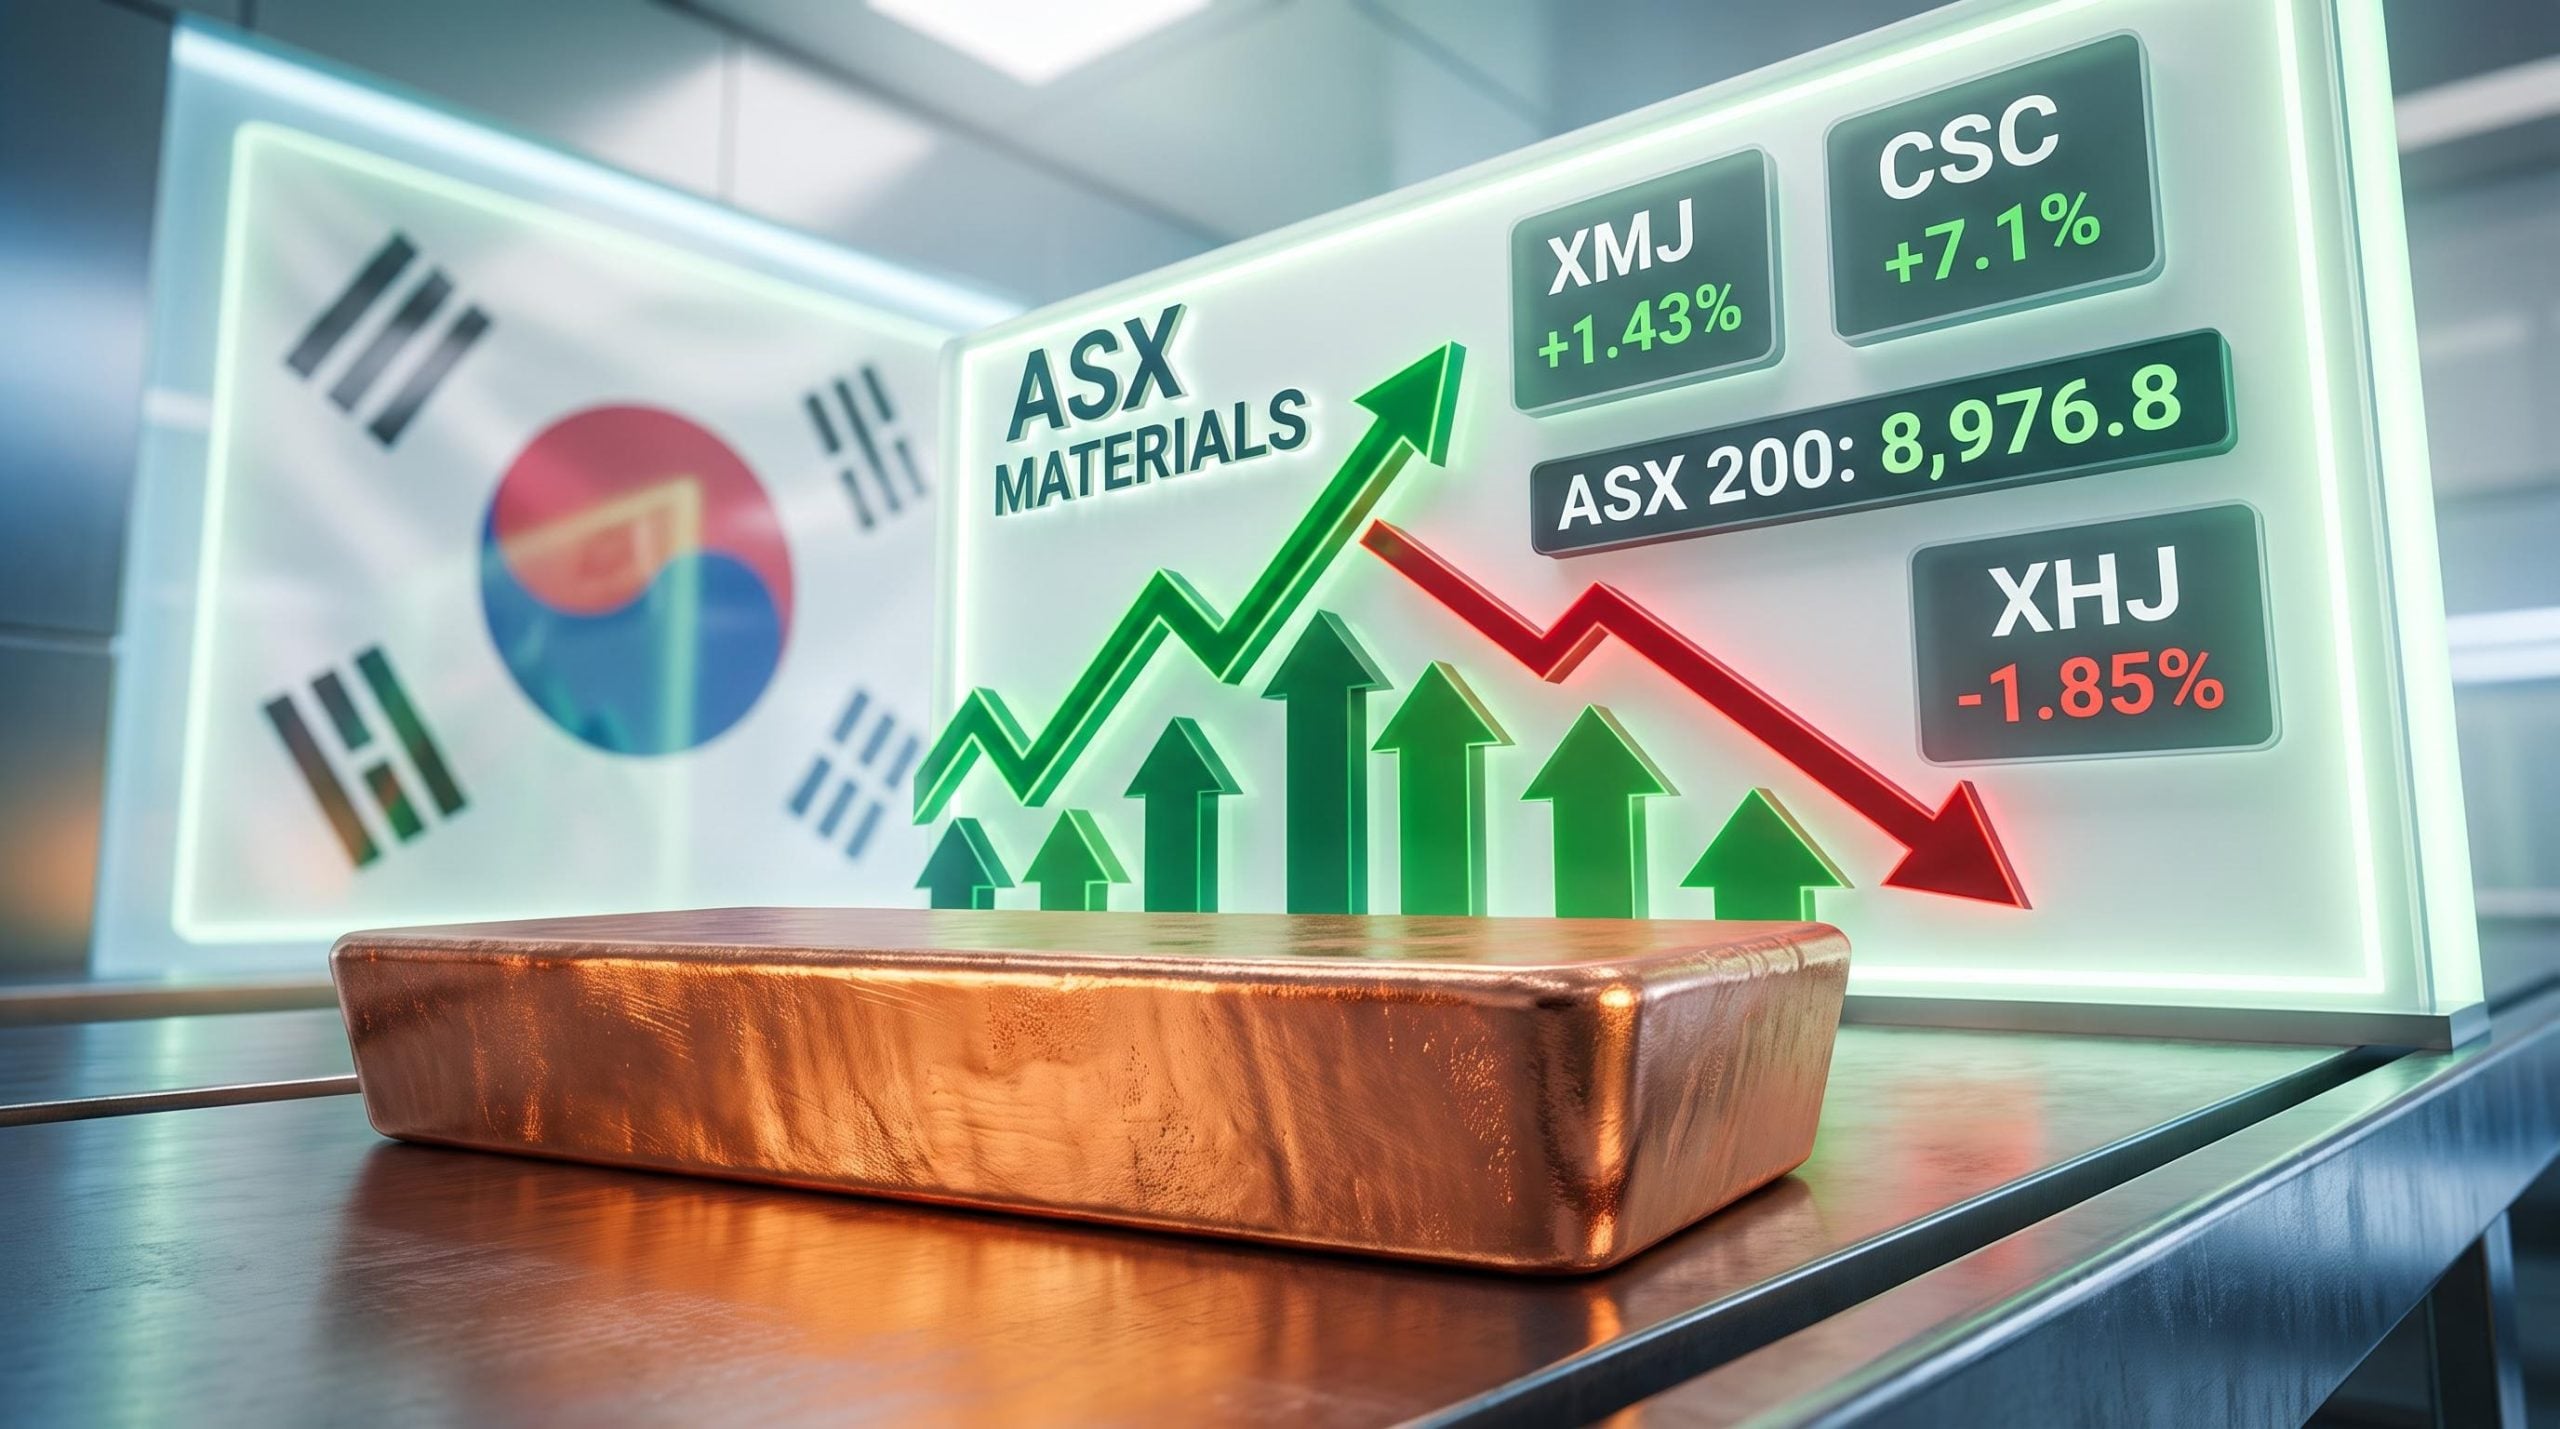
Among domestic sectors, materials delivered the strongest results in H1 2026 and contributed more to overall earnings growth than any other part of the index. Iron ore and gold prices remained elevated throughout the period, lifting returns for the major producers, and broader global investment in infrastructure and data-centre construction added indirect support to demand for steel inputs.
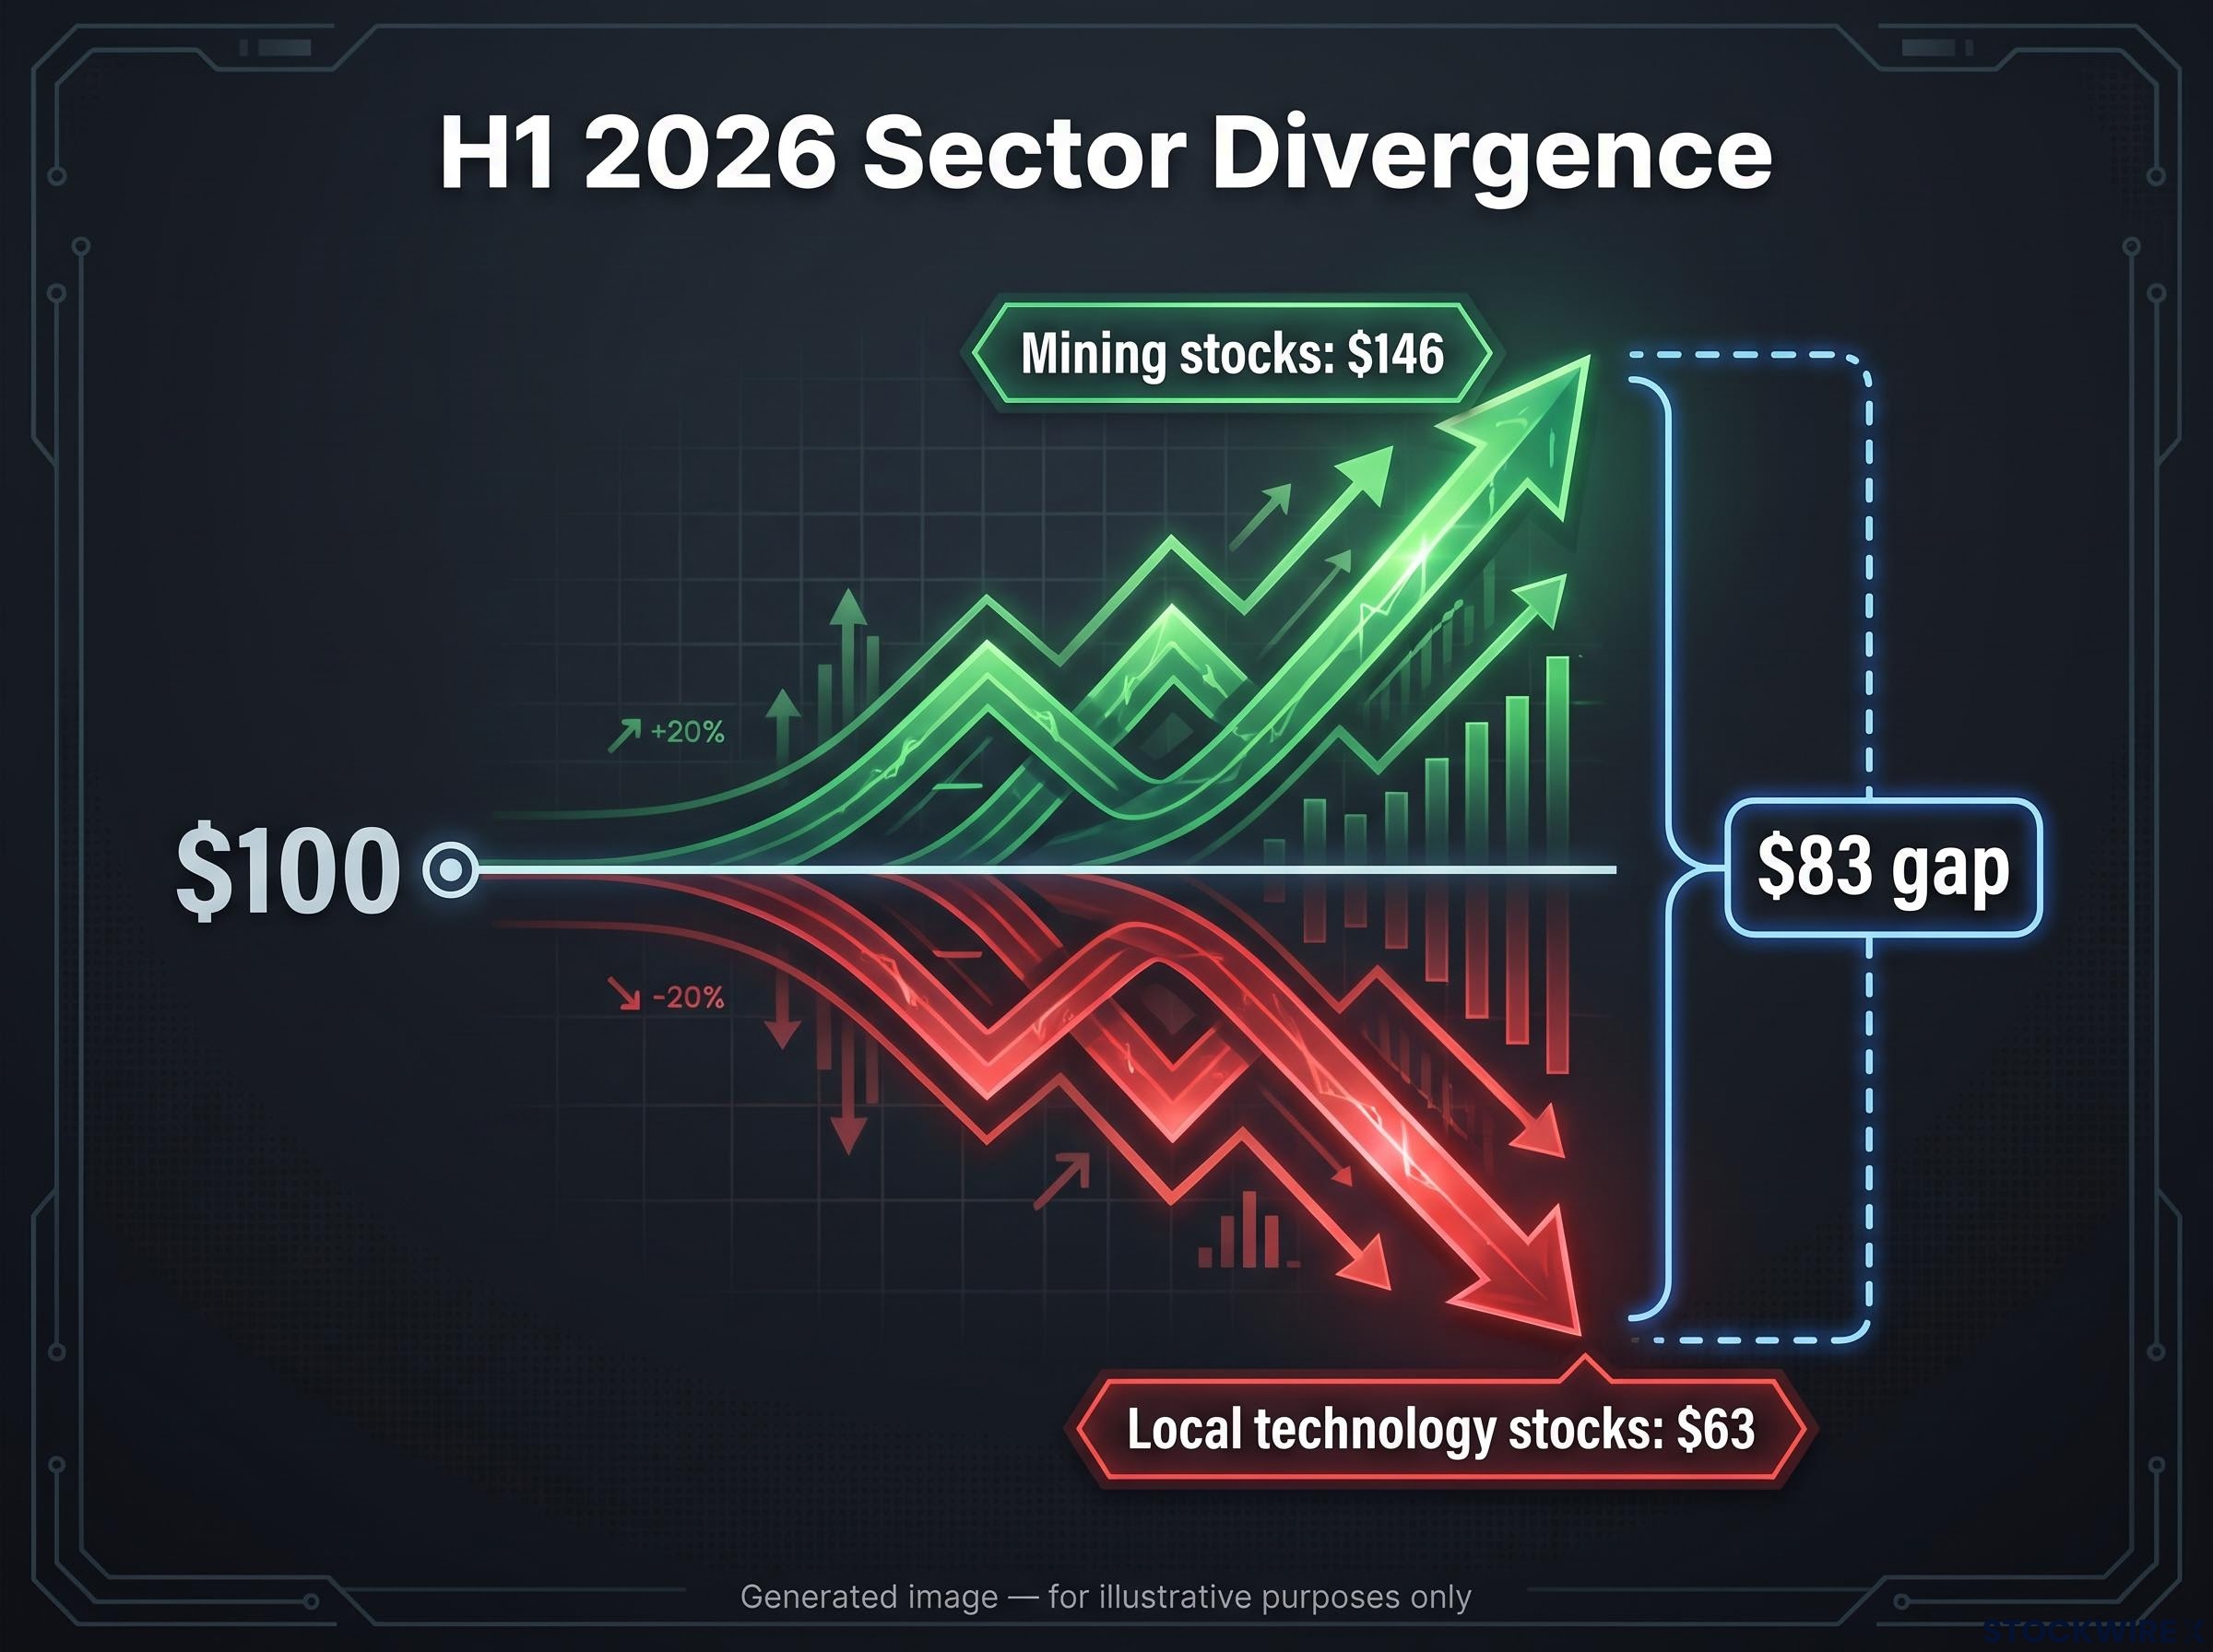
The sector divergence was stark. The Australian Financial Review illustrated it with a hypothetical that makes the swing from physical to virtual assets visceral:
$100 invested in mining stocks at the start of 2026 was worth approximately $146 by mid-year. The same $100 in local technology stocks fell to roughly $63.
That is a $83 gap on a $100 starting point, within the same domestic market and the same six-month window.
The specific drivers of materials strength were layered:
- Elevated iron ore prices throughout the half
- Gold prices remaining at high levels, supporting gold producers
- Global infrastructure investment sustaining demand for steel inputs
- Data-centre construction providing indirect commodity demand
Without the materials sector’s contribution, ASX returns would have looked significantly weaker relative to global peers. For investors who held major diversified miners or gold producers, the outperformance was not luck. It reflected a deliberate exposure to hard assets that served as a natural hedge against the policy and fiscal headwinds hitting the rest of the index.
The structural demand case for commodities allocation extends well beyond H1 2026 price levels: Societe Generale lifted its model portfolio weighting from 5% to 20% in a single step on 18 June 2026, citing five overlapping drivers including AI infrastructure spending, electrification, and defence budgets that the bank treats as policy-locked multi-year consumption.
The lesson is that “the ASX had a bad half” is an incomplete summary. The outcome depended heavily on what you held within the index.
Five practical adjustments for Australian investors after a bruising half
Each of the following adjustments responds directly to a specific force that shaped H1 2026 returns. They are grounded in what actually happened, which is what makes them worth reviewing against your current allocation.
- Tilt toward value and income in tightening cycles. When the RBA is hiking, lower-leverage businesses and income-generating equities tend to hold up better than high-growth, high-multiple names. That rotation was already building from late 2025.
- Monitor fiscal proposals before they become law. The 2026 budget demonstrated that CGT and housing-related reforms affect sentiment and capital allocation at the proposal stage. Staying ahead of budget developments is part of managing after-tax returns.
- Treat geographic diversification as structural, not tactical. The 2.4% vs. 9.6% gap in a single half is the cost of home-country bias made visible. With technology structurally underrepresented on the ASX, international exposure addresses a permanent composition gap, not a temporary performance difference.
- Maintain materials exposure. The sector’s outsized contribution to domestic earnings in H1 2026 confirms its role as a structural pillar of the ASX. A zero-materials allocation effectively underweights one of Australia’s core comparative strengths.
- Hold the long-run view. Episodes driven by rate cycles and budget uncertainty are cyclical. The combination of franked dividends (tax credits attached to dividends that reduce double taxation for Australian shareholders), commodity exposure and a stable institutional framework continues to underpin the long-term investment case for Australian equities.
This article is for informational purposes only and should not be considered financial advice. Investors should conduct their own research and consult with financial professionals before making investment decisions.
The half that tested home-country conviction: what changes from here
H1 2026 delivered a three-layer challenge to Australian equity investors: cyclical headwinds from 75 basis points of RBA tightening, fiscal uncertainty from budget proposals that froze capital allocation decisions, and a structural composition gap that locked the ASX out of the AI-driven rally powering global peers.
The distinction that matters is between what is cyclical and what is structural. Rate hikes will eventually normalise. Budget proposals will move toward legislative clarity, with the key measures effective from 1 July 2027, giving investors a defined planning timeline. Some of the cyclical headwinds that compressed returns in H1 will ease.
The structural case is different. The ASX’s underrepresentation in technology is not waiting on a policy decision. It is a feature of the index that will persist through future global growth cycles. The diversification case stands independently of what the RBA does next.
Neither conclusion supports an extreme response. Abandoning ASX exposure ignores the long-run return case built on franked dividends, commodity exposure and institutional stability. Dismissing the underperformance as a temporary blip ignores the structural lessons the half made visible. The data from H1 2026 points to something more measured: an honest assessment of where domestic equities serve you well, and where they leave gaps that only deliberate international allocation can fill.
Past performance does not guarantee future results. Financial projections are subject to market conditions and various risk factors.