Two Index Changes on 29 June, Two Very Different Flow Stories
2 hrs ago

The stocks that rallied hardest when the Iran conflict began are now falling hardest as it ends. ASX gold and energy names that spent 15 weeks building a geopolitical risk premium are watching it evaporate in a matter of sessions, and the speed of the reversal is catching investors off guard.
The S&P/ASX All Ordinaries Gold Index (XGD) has now recorded a fifth straight session in the red. ICE Brent crude has retreated to its weakest point since hostilities commenced in early March 2026. These are not two unrelated sell-offs. They are a single phenomenon: 15 weeks of accumulated “war insurance” being stripped out of both commodities simultaneously as resolution signals land.
Here is a framework for reading this sell-off clearly, so you can distinguish positions worth holding from positions that were always more fragile than the conflict obscured.
Two resolution signals are driving the unwind, and both are supply-side:
The OFAC General Licence for Iranian oil issued in mid-June 2026 authorises transactions covering Iranian-origin crude, petrochemical products, and petroleum, establishing the formal sanctions relief framework that markets are now pricing into Brent futures ahead of any physical supply increase.
ICE Brent crude futures fell 1.6% to US$75.83 per barrel on 24 June 2026, their lowest level since the Iran conflict began.
The market is not waiting for Iranian barrels to physically arrive before repricing. It is pricing the removal of the tail risk. That front-running behaviour, where every holder of the premium moves to exit simultaneously once certainty returns, is what makes the reversal feel faster and sharper than the 15-week build-up that preceded it.
The sell-off now unwinding is the mirror image of the ceasefire rally in late May, when the ASX 200 surged 138.8 points in a single session as tentative resolution signals sent crude lower and lifted gold and materials stocks simultaneously across the board.
Understanding this distinction matters. The sell-off is sentiment-driven repricing of worst-case scenarios, not a response to an actual supply glut. How much further prices fall depends on how much premium remains to extract, not on whether tankers are loading today.
A geopolitical risk premium is the extra price markets attach to a commodity when conflict threatens supply. It reflects uncertainty, not fundamentals. The Iran conflict episode follows a four-phase pattern that repeats across geopolitical crises, and the current sell-off becomes far less surprising once you see where it sits in the cycle.
| Phase | What is happening | Commodity price behaviour | Investor implication |
|---|---|---|---|
| 1. Build-up | Conflict escalation drives safe-haven and supply-disruption pricing | Prices rise gradually as risk accumulates over weeks | Momentum favours commodity-exposed positions |
| 2. Plateau | Premium stabilises as the conflict persists without further escalation | Prices hold at elevated levels; volatility compresses | Complacency risk builds; the premium feels permanent |
| 3. Rapid unwind | Resolution signals trigger simultaneous position unwinding | Prices fall faster than they rose; overshoots to the downside are common | Selling into a full unwind risks locking in losses at the worst point |
| 4. Fundamental re-rating | Premium fully extracted; stocks reprice on costs, cash flow, balance sheets | Prices stabilise at levels justified by supply-demand fundamentals | Opportunity to identify what the premium was masking |
The asymmetry between phases 1 and 3 is the single most useful thing to take from this framework. Uncertainty accumulates gradually, one headline at a time, over 15 weeks. But resolution signals land discretely, and when they do, every holder of the premium moves to exit at once. That is why a premium that took months to build can collapse in days.
The simultaneous sell-off in both oil and gold confirms this is premium extraction, not individual commodity weakness. June 2026 marks the transition from phase 3 into phase 4, and the investor opportunity in phase 4 lies in identifying what the premium had been masking.
On 24 June 2026, the XGD shed 2.7% to mark its fifth consecutive losing session, extending a run that included a 2.90% decline the prior day to approximately 16,553. COMEX gold futures retreated 1.1% to US$4,105 per ounce, building on a 1.3% overnight loss. COMEX silver futures slipped 0.2% to US$61.90 per ounce, after a sharp 5.3% fall in the preceding overnight session.
The individual gold producer moves on the day reinforce the sector-wide picture:
That uniform 2.2-2.4% range is the tell. This is sector-level de-risking driven by a common set of forces, not company-specific news. Gold stocks are leveraged proxies for the gold price, meaning they amplify the metal’s moves in both directions. When gold falls, the producers tend to fall harder.
But the geopolitical unwind is only one of two headwinds bearing down on the sector.
Gold pays no yield. When real yields rise (the return on bonds after inflation), the opportunity cost of holding gold increases, making it less attractive relative to interest-bearing assets. The June 2026 Federal Open Market Committee (FOMC) meeting under Chair Kevin Warsh delivered a hawkish pivot, with the market now pricing at least one rate hike by year-end. That shift is pushing real yields higher and removing a key non-geopolitical support for gold that had been operating independently of the Iran conflict.
The convergence of these two headwinds, geopolitical premium removal and rising real yields, makes the re-entry case for gold stocks conditional on the Fed outlook, not just conflict resolution. Until the rate trajectory is clearer, the selling pressure has two independent sources to draw from.
The convergence is not coincidental: hawkish Fed repricing pushed Treasury yields roughly 60 basis points higher from the conflict’s onset, meaning gold had been fighting an interest rate headwind throughout a period when most observers assumed the war premium was doing all the work.
The S&P/ASX 200 Energy Index (XEJ) fell 1.04% to 9,580.7 on 24 June 2026. A modest headline number, but beneath it, the individual stock moves tell a dispersed story that is analytically distinct from the correlated gold drawdown.
| Company | ASX code | Session move (%) | Context |
|---|---|---|---|
| Beach Energy | BPT | -8.5% | Morgans downgrade to Sell; operational and balance-sheet concerns |
| Karoon Energy | KAR | -2.8% | Broad sector weakness |
| Woodside Energy | WDS | -1.4% | Tracking Brent decline |
| Santos | STO | -1.0% | Tracking Brent decline |
The gap between Beach Energy’s 8.5% decline and the sector’s 1.04% move is the critical signal. When a stock falls eight times the index during a broad sell-off, the sell-off is not the cause; it is the occasion.
Morgans downgraded Beach Energy to Sell from Hold on 24 June 2026, cutting its price target to $0.81 from $1.10.
Morgans pointed to a range of company-specific concerns spanning capital expenditure pressures, deteriorating cash flow, and reserve life issues. Beach Energy has lost 23.9% of its value over the past month and 35.3% over the past year. These are pre-existing issues. The elevated oil price during the conflict had been masking them. The premium removal did not create the deterioration; it exposed it.
Two types of price damage are occurring simultaneously across ASX gold and energy stocks, and misidentifying one as the other leads to the wrong portfolio decision.
The diagnostic is a two-step process:
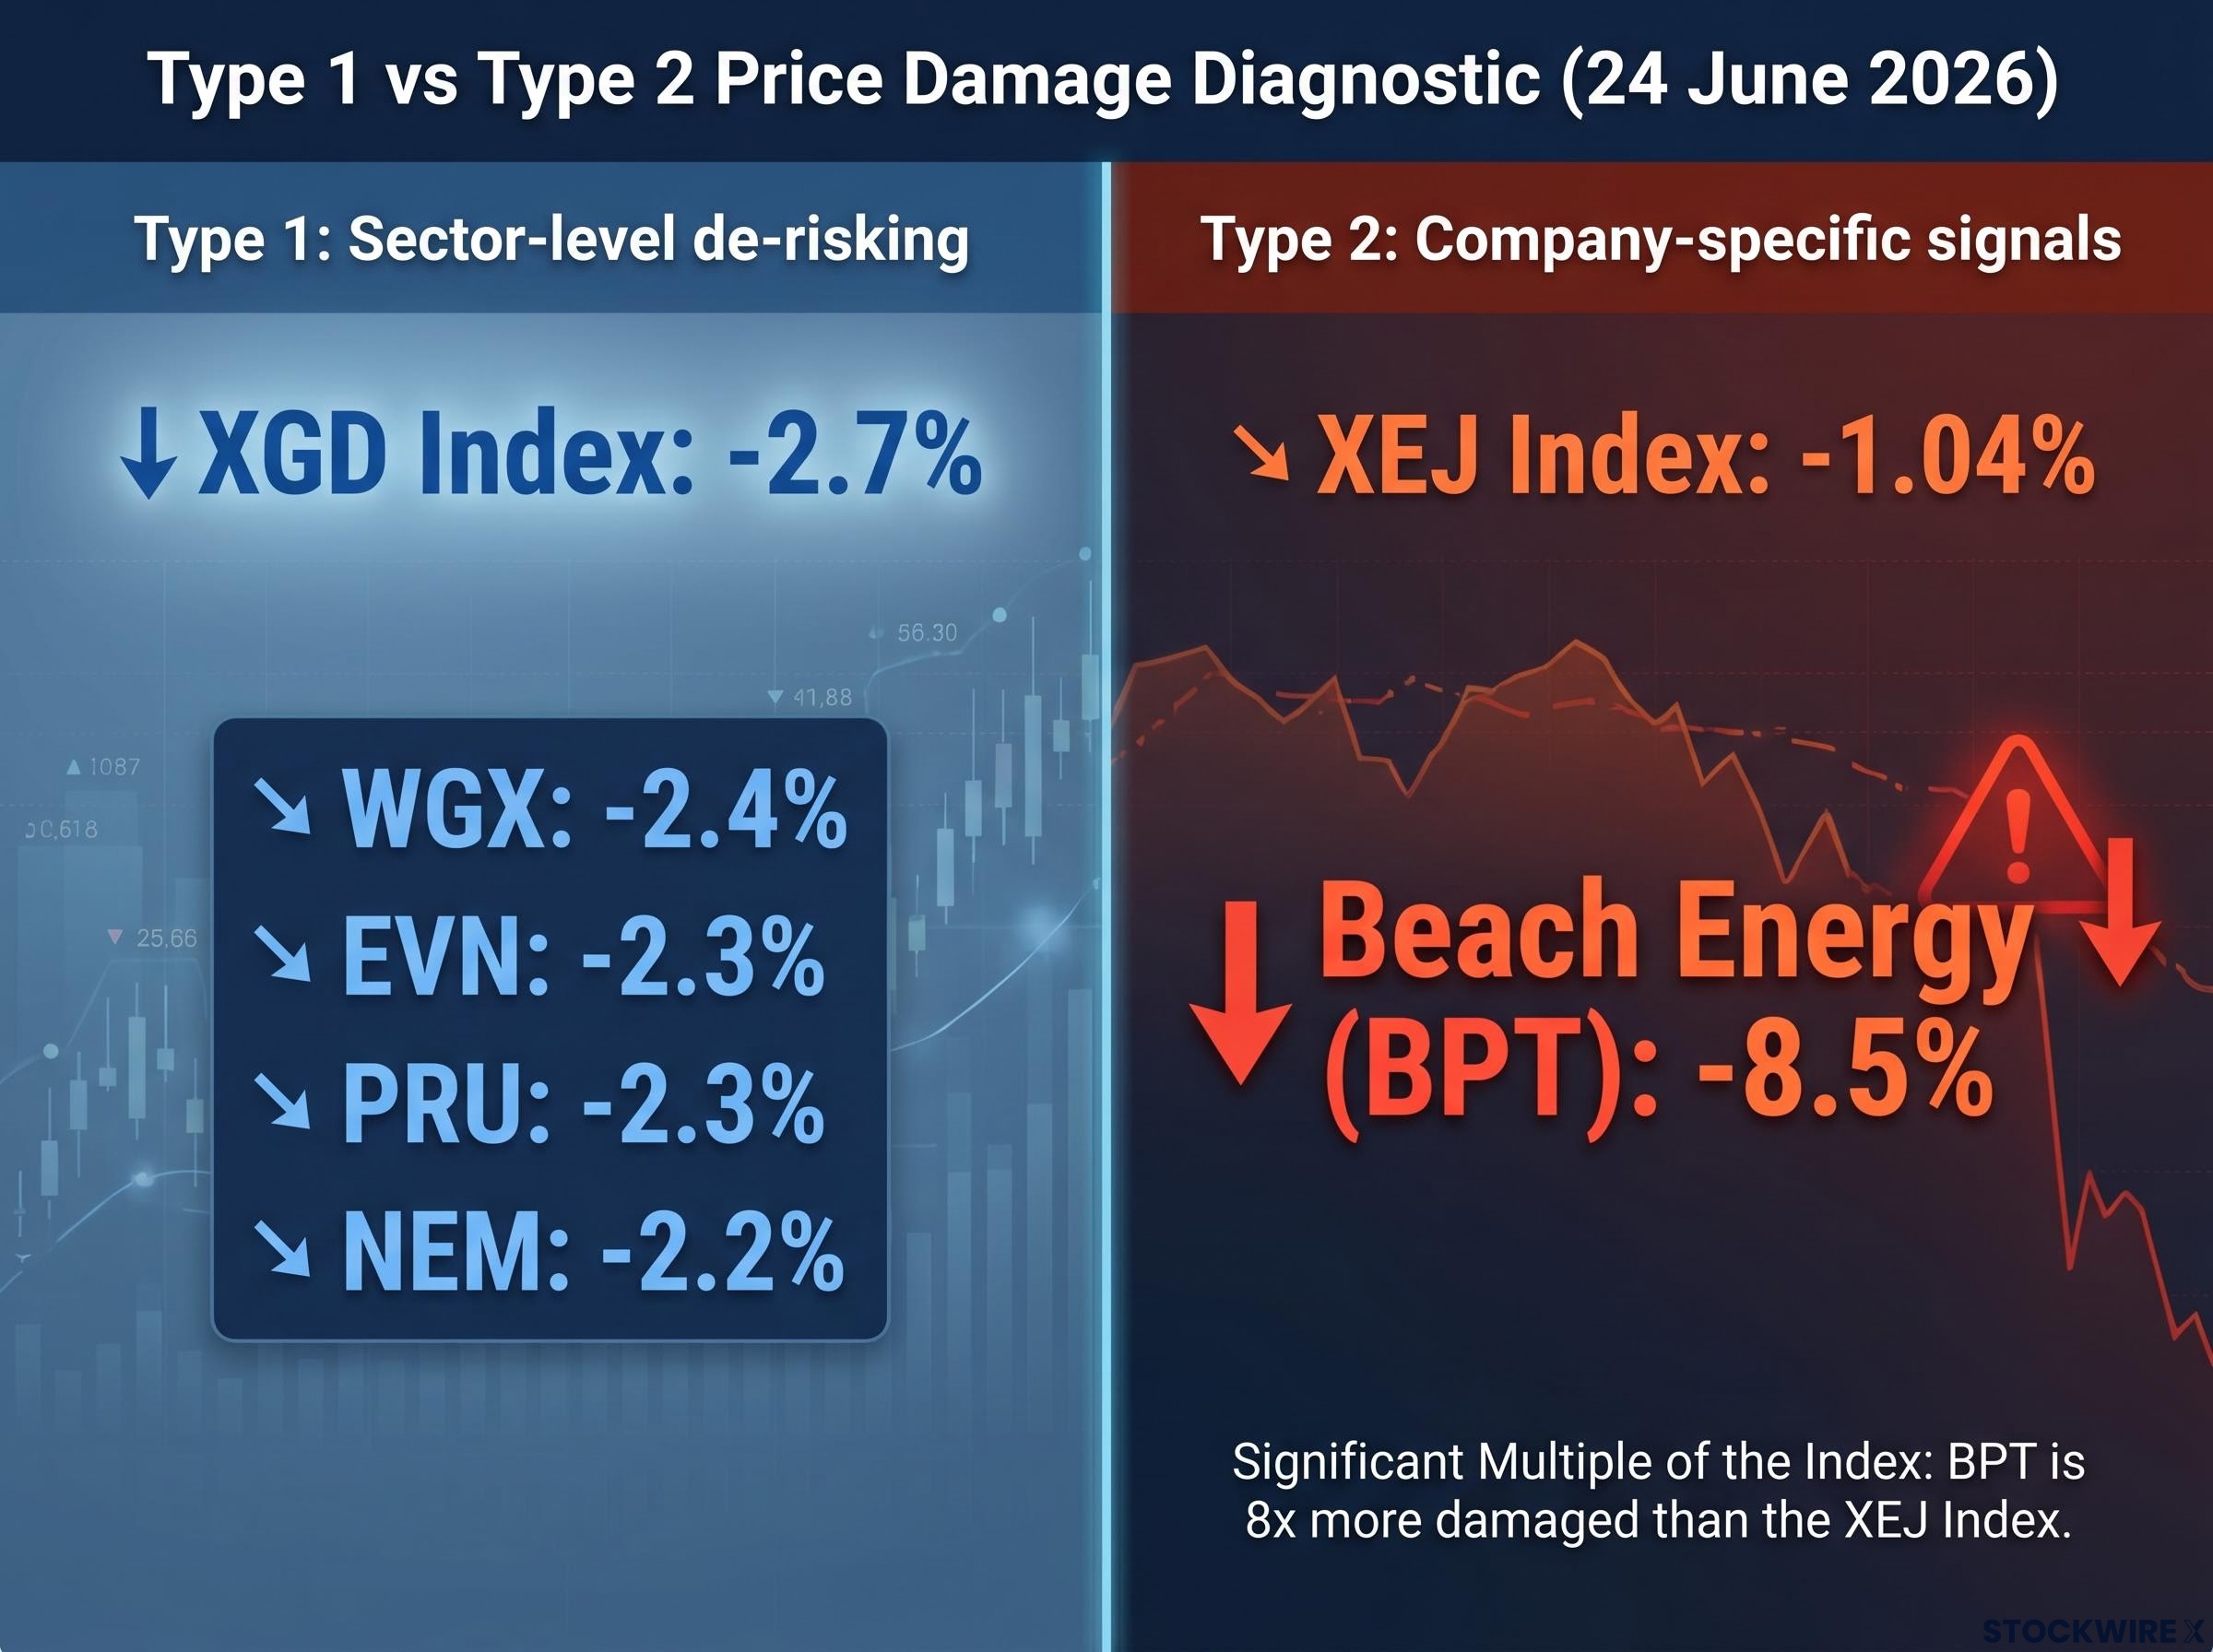
The gold sector illustrates Type 1 cleanly: WGX, EVN, PRU, and NEM all declined 2.2-2.4%, broadly in line with the XGD’s 2.7%. The energy sector illustrates Type 2: Beach Energy fell 8.5% versus the XEJ’s 1.04%, with Morgans flagging capex, cash flow, and reserve life concerns that pre-date the sell-off.
The fundamental re-rating phase rewards producers with low all-in sustaining costs, strong cash flow generation, manageable debt, and long reserve life. For gold, the uniform producer declines suggest these names are tracking the metal rather than deteriorating independently, meaning their re-rating depends on gold finding a new floor once the Fed direction is clearer. For energy, the re-rating will separate operationally sound producers from those whose weaknesses the premium had been obscuring, and the Beach Energy case is the current example of what that separation looks like.
Institutional positioning ahead of phase 4 is already visible: Societe Generale’s decision to lift commodities to 20% of its model portfolio on 18 June 2026 was explicitly framed around structural commodity demand drivers, including electrification, AI infrastructure, and energy independence, rather than the geopolitical premium that is now unwinding.
Three variables will determine how much further the unwind runs and where prices stabilise:
The Hormuz reopening timeline has consistently been the single variable with the most binary price impact: when Saudi output was running at a 36-year low of 6.316 million barrels per day and global inventories were drawing at more than double their record pace, even the prospect of normalised tanker traffic was enough to move Brent by multiples of any OPEC+ production adjustment.
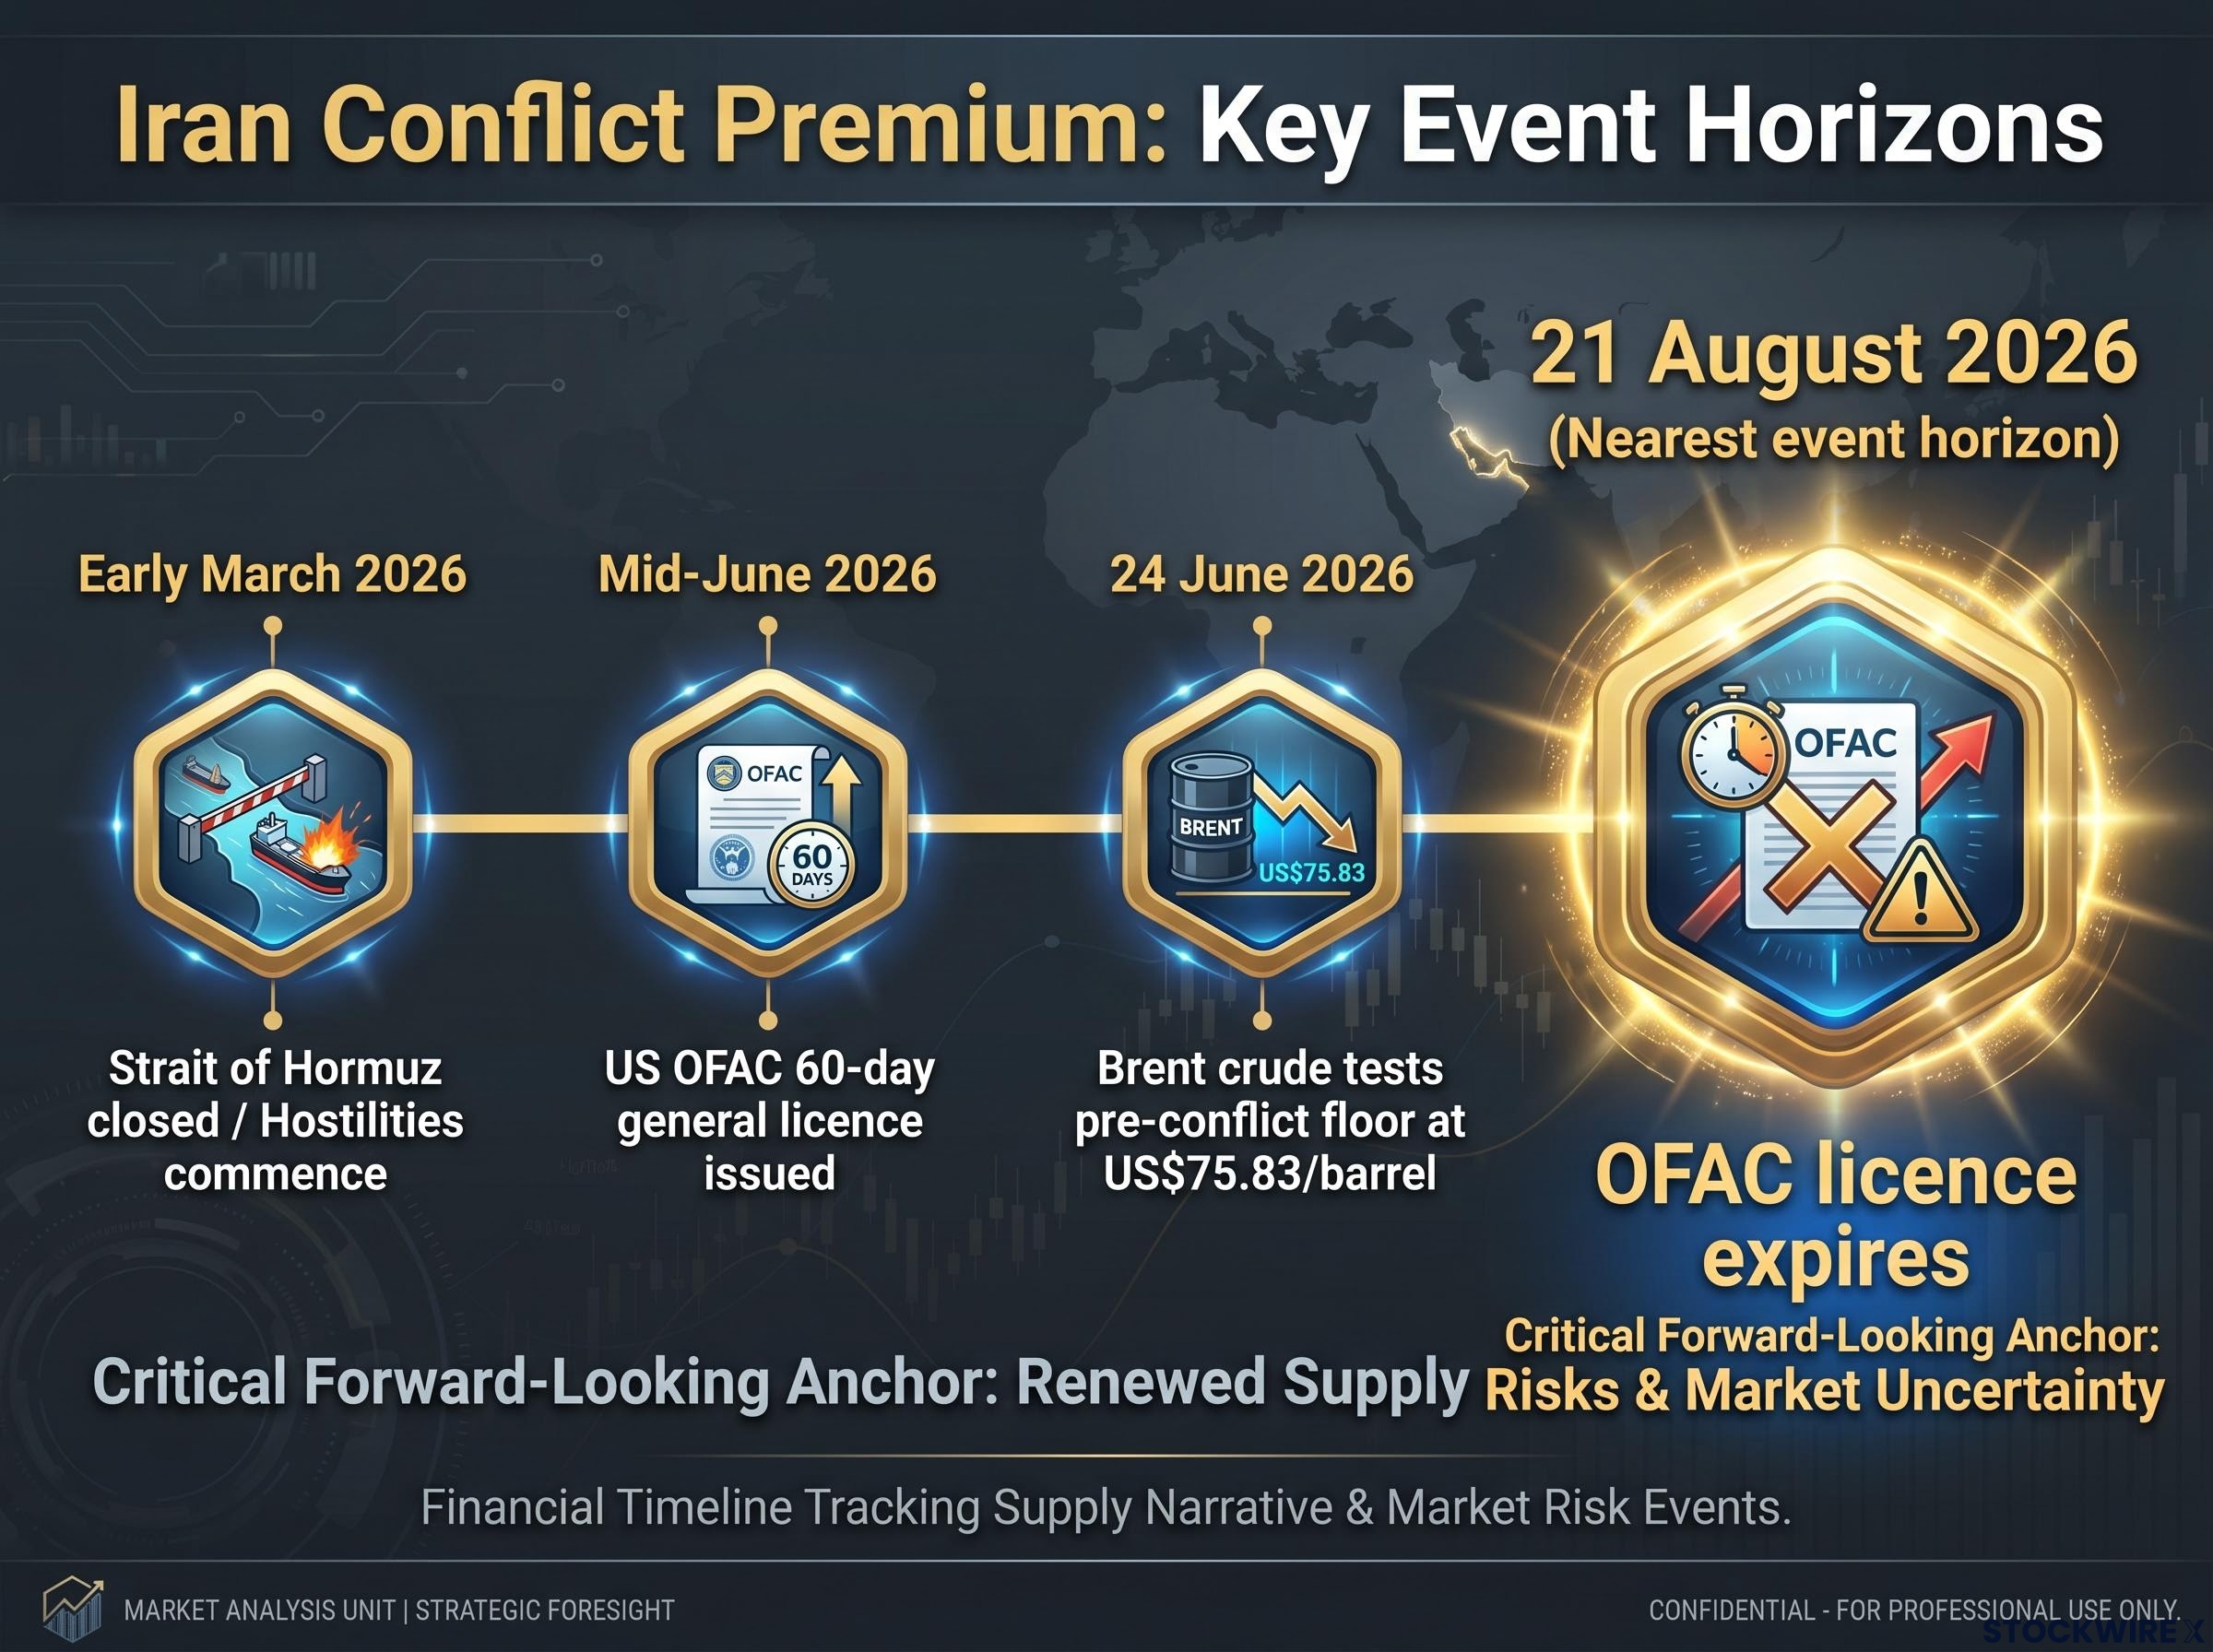
The 21 August 2026 licence expiry is the nearest discrete event horizon for the energy supply narrative.
Brent at US$75.83 is testing its pre-conflict floor. Overshoots to the downside are characteristic of phase 3 unwinds, meaning prices may temporarily fall below levels that fundamentals alone would justify before stabilising. That creates the possibility of entry points, but also the risk of catching a falling knife if you act before the premium is fully extracted.
The 21 August date is not a prediction of a price reversal. It is a structural event that will force the market to reassess its supply assumptions, and it is the most concrete near-term anchor in an otherwise uncertain outlook.
This article is for informational purposes only and should not be considered financial advice. Investors should conduct their own research and consult with financial professionals before making investment decisions. Past performance does not guarantee future results. Forward-looking statements regarding Federal Reserve policy and commodity price trajectories are subject to change based on market developments.
The current sell-off across ASX gold and energy stocks is a phase 3 geopolitical premium unwind, accelerated by a hawkish Federal Reserve. The right response is triage, not panic and not blind buying.
The diagnostic is straightforward. Uniform sector declines that track the commodity are premium-unwind damage, expected and recoverable when fundamentals re-assert. Outsized individual declines flag pre-existing issues now visible without the premium buffer. Beach Energy is the live example; the major gold producers are the counter-example.
The phase 4 opportunity belongs to investors who have done this triage now, classified which positions are commodity-tracking versus structurally impaired, and are monitoring the three variables, Iranian supply, OPEC+ decisions, and the Fed rate trajectory, that will set the new floor.
A geopolitical risk premium is the extra price markets attach to a commodity when conflict threatens supply; it reflects uncertainty rather than fundamentals, and it typically collapses faster than it built because resolution signals cause every holder to exit simultaneously.
The Strait of Hormuz has reopened and a US OFAC 60-day general licence for Iranian oil sales was issued in mid-June 2026, removing the worst-case supply disruption scenario and triggering a simultaneous unwind of the risk premium that had been priced into both crude oil and gold over 15 weeks.
Morgans downgraded Beach Energy to Sell and cut its price target to $0.81 from $1.10, citing capex pressures, deteriorating cash flow, and reserve life concerns; the elevated oil price during the conflict had been masking these pre-existing issues, and the premium removal exposed them.
Compare the stock's move to its sector index: if it tracks the XGD or XEJ closely, the damage is sentiment-driven and broadly recoverable; if it falls at a significant multiple of the index, that signals company-specific issues such as operational deterioration, broker downgrades, or balance-sheet stress that the elevated commodity price had been obscuring.
The OFAC general licence for Iranian oil sales expires on 21 August 2026; whether it is renewed, expanded, or allowed to lapse will force the market to reassess its supply assumptions and represents the most concrete near-term anchor for the energy price narrative.