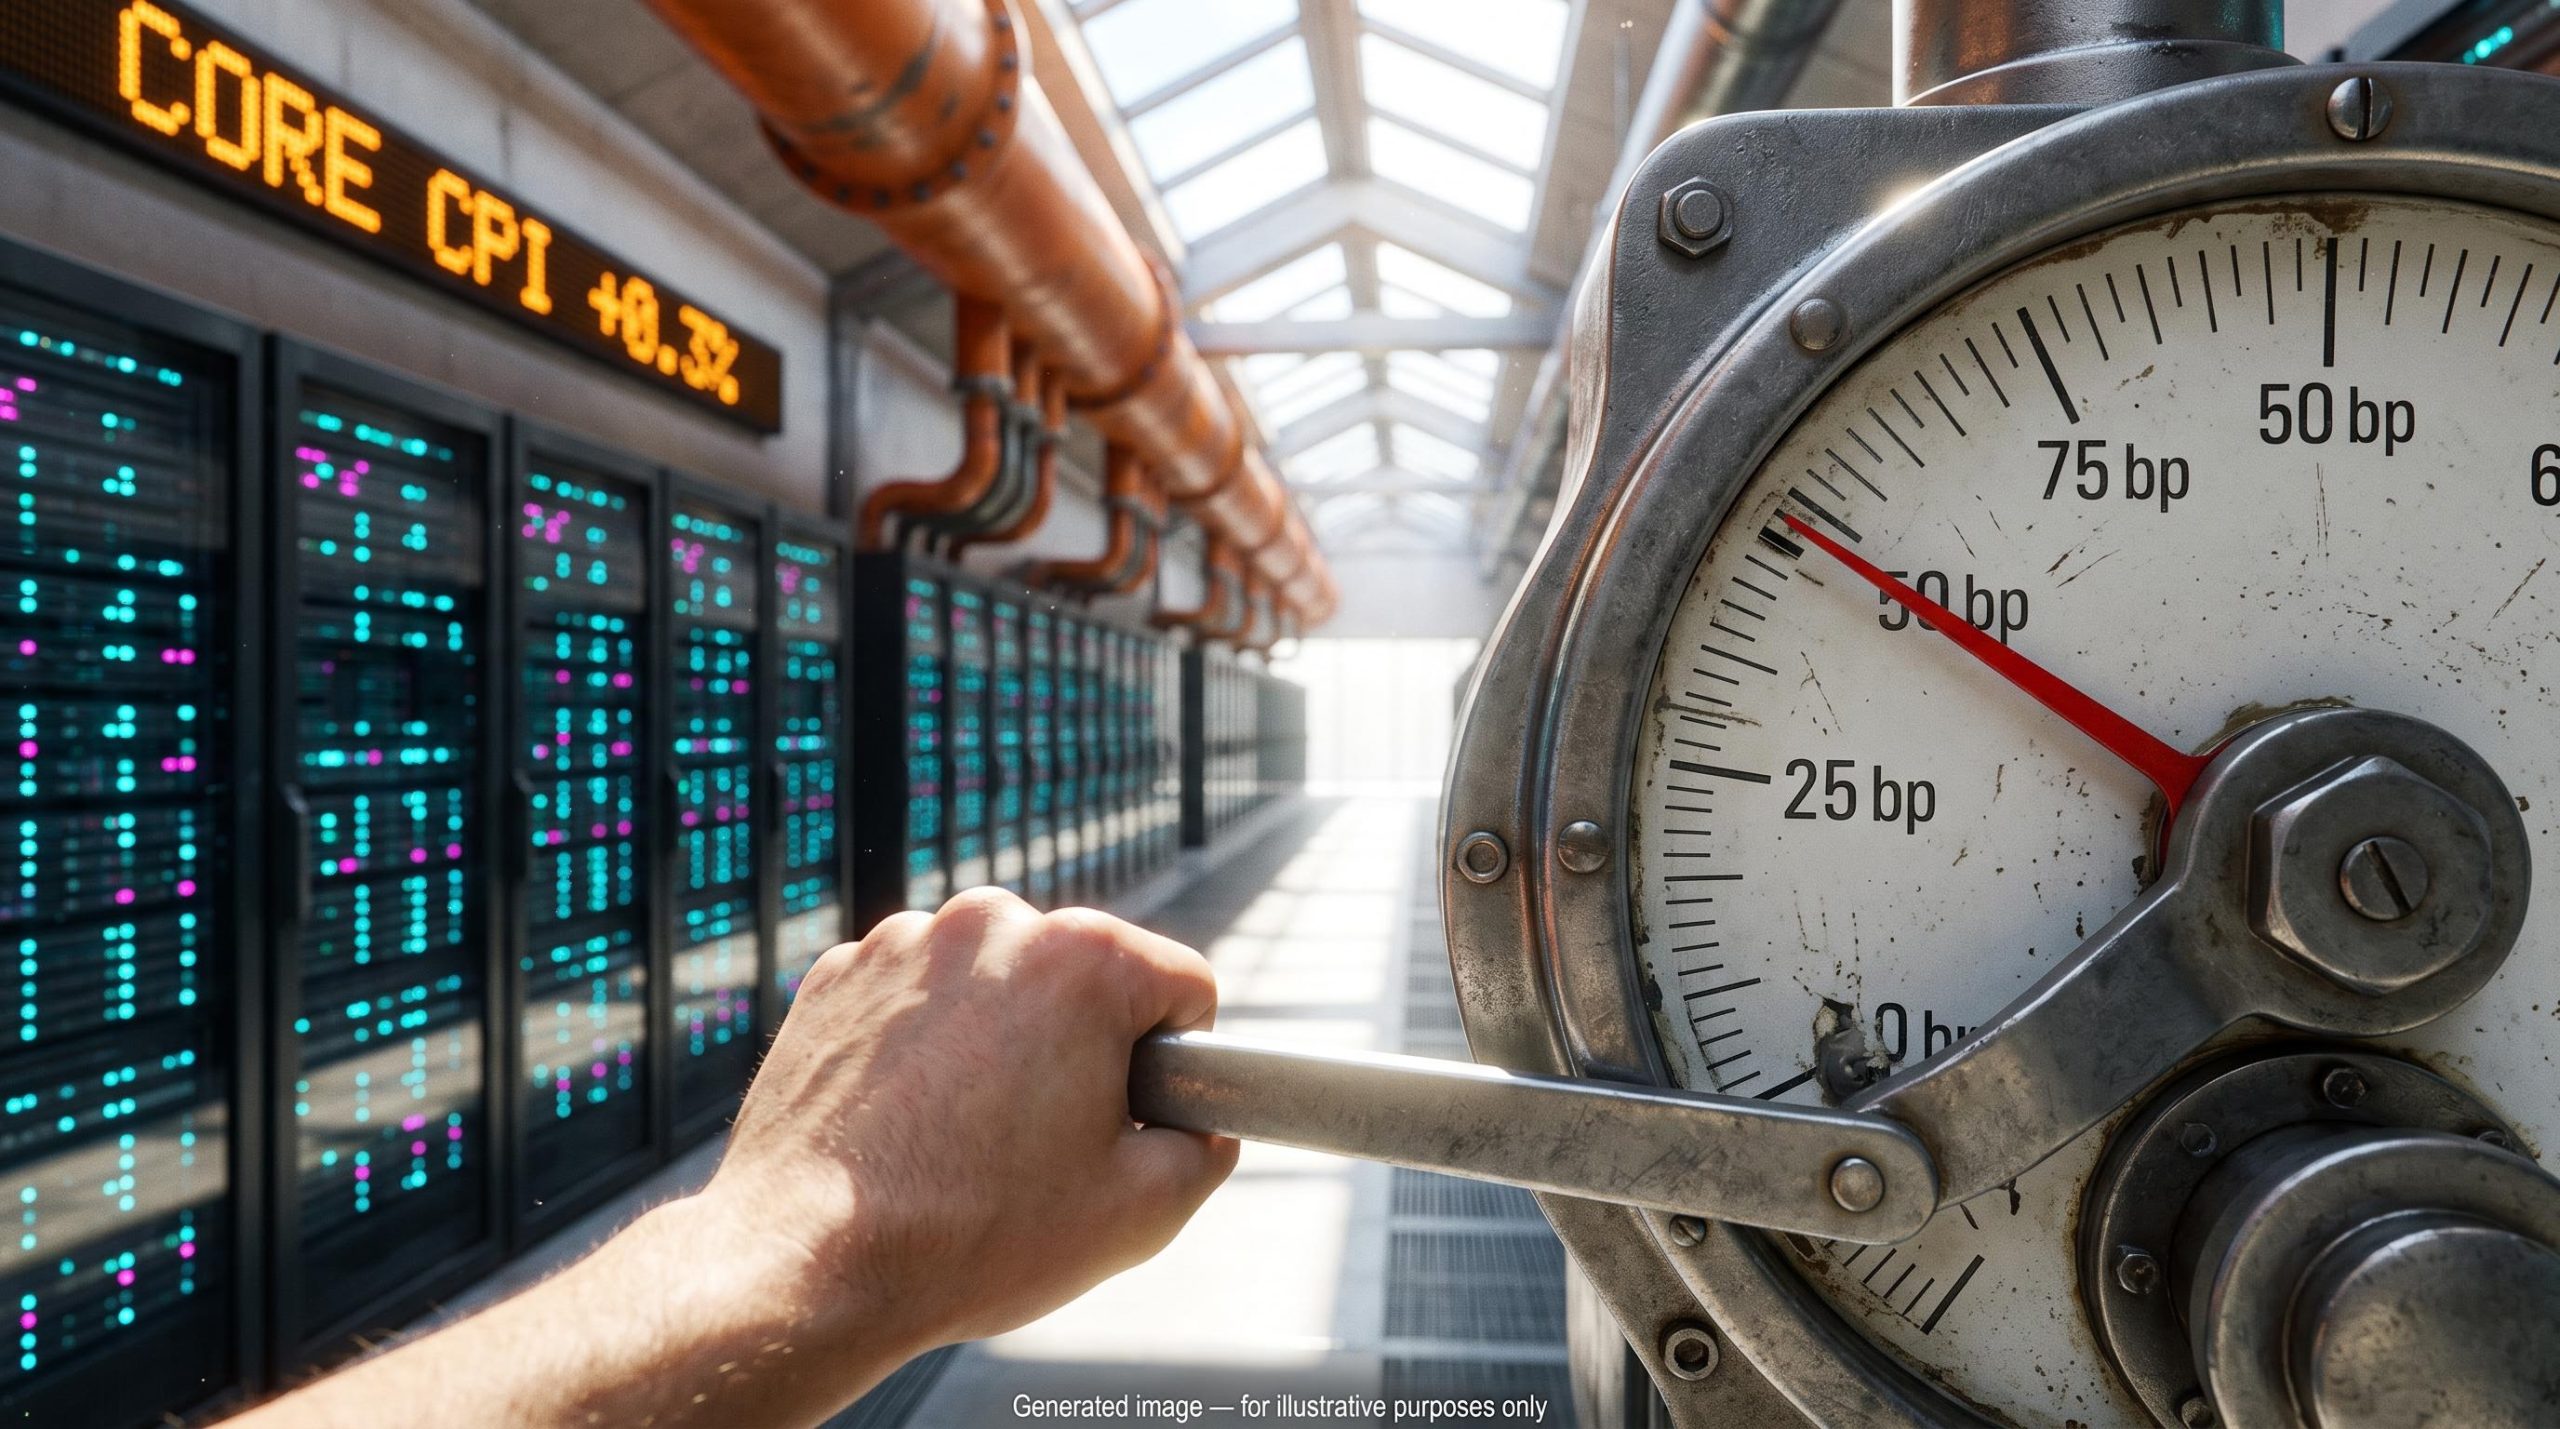
Most people treat an oil shock as an energy story: petrol prices jump, then fade. The October numbers suggest a different reading. Core inflation, which strips out food and energy, has now printed 0.3% for a third straight month, while the US economy grew at a 3.4% annualised pace in Q3, with data centre investment doing much of the lifting.
Those two forces are pulling in the same direction, and that shapes the Fed rate hike outlook more than any single petrol price reading.
The Consumer Price Index (CPI), the main gauge of what households pay for goods and services, landed on 10 November 2026. The Producer Price Index (PPI), which tracks prices businesses receive, is due Friday, 13 November. Futures markets price roughly an 88% chance of a 25 basis point December hike, while the Federal Reserve’s own September projections point to a hold through 2027. If you follow only the headline figure, you can misread which way that gap is likely to close.
Here you will see how the shock travelled from energy to goods to services, why growth now leans on AI spending, and what the split between markets and the Fed implies for you.
How did an oil shock reach services inflation?
If this still looks like a petrol problem to you, the mechanism explains why it has outgrown that label. Price shocks move in stages, and each stage is slower and harder to reverse than the one before.
- Energy shock: Higher crude, gas and electricity prices lift petrol, utility, transport and production costs.
- Goods pass-through: Firms paying more for freight, power, materials and imported inputs reprice their goods, and may widen margins if demand holds up.
- Services persistence: With a lag, services absorb those higher energy, building, transport and labour costs through rents, wages, medical prices and hospitality.
The current episode followed that path closely. According to the original source, the Iran war began as an oil shock, reached goods around June-July and showed up in services by October.
Earlier in the year, analysts estimated that 40-60% of oil price inflation feeds into core CPI over 3-6 months, which is why the summer and autumn prints carried more policy weight than the first readings after the shock.
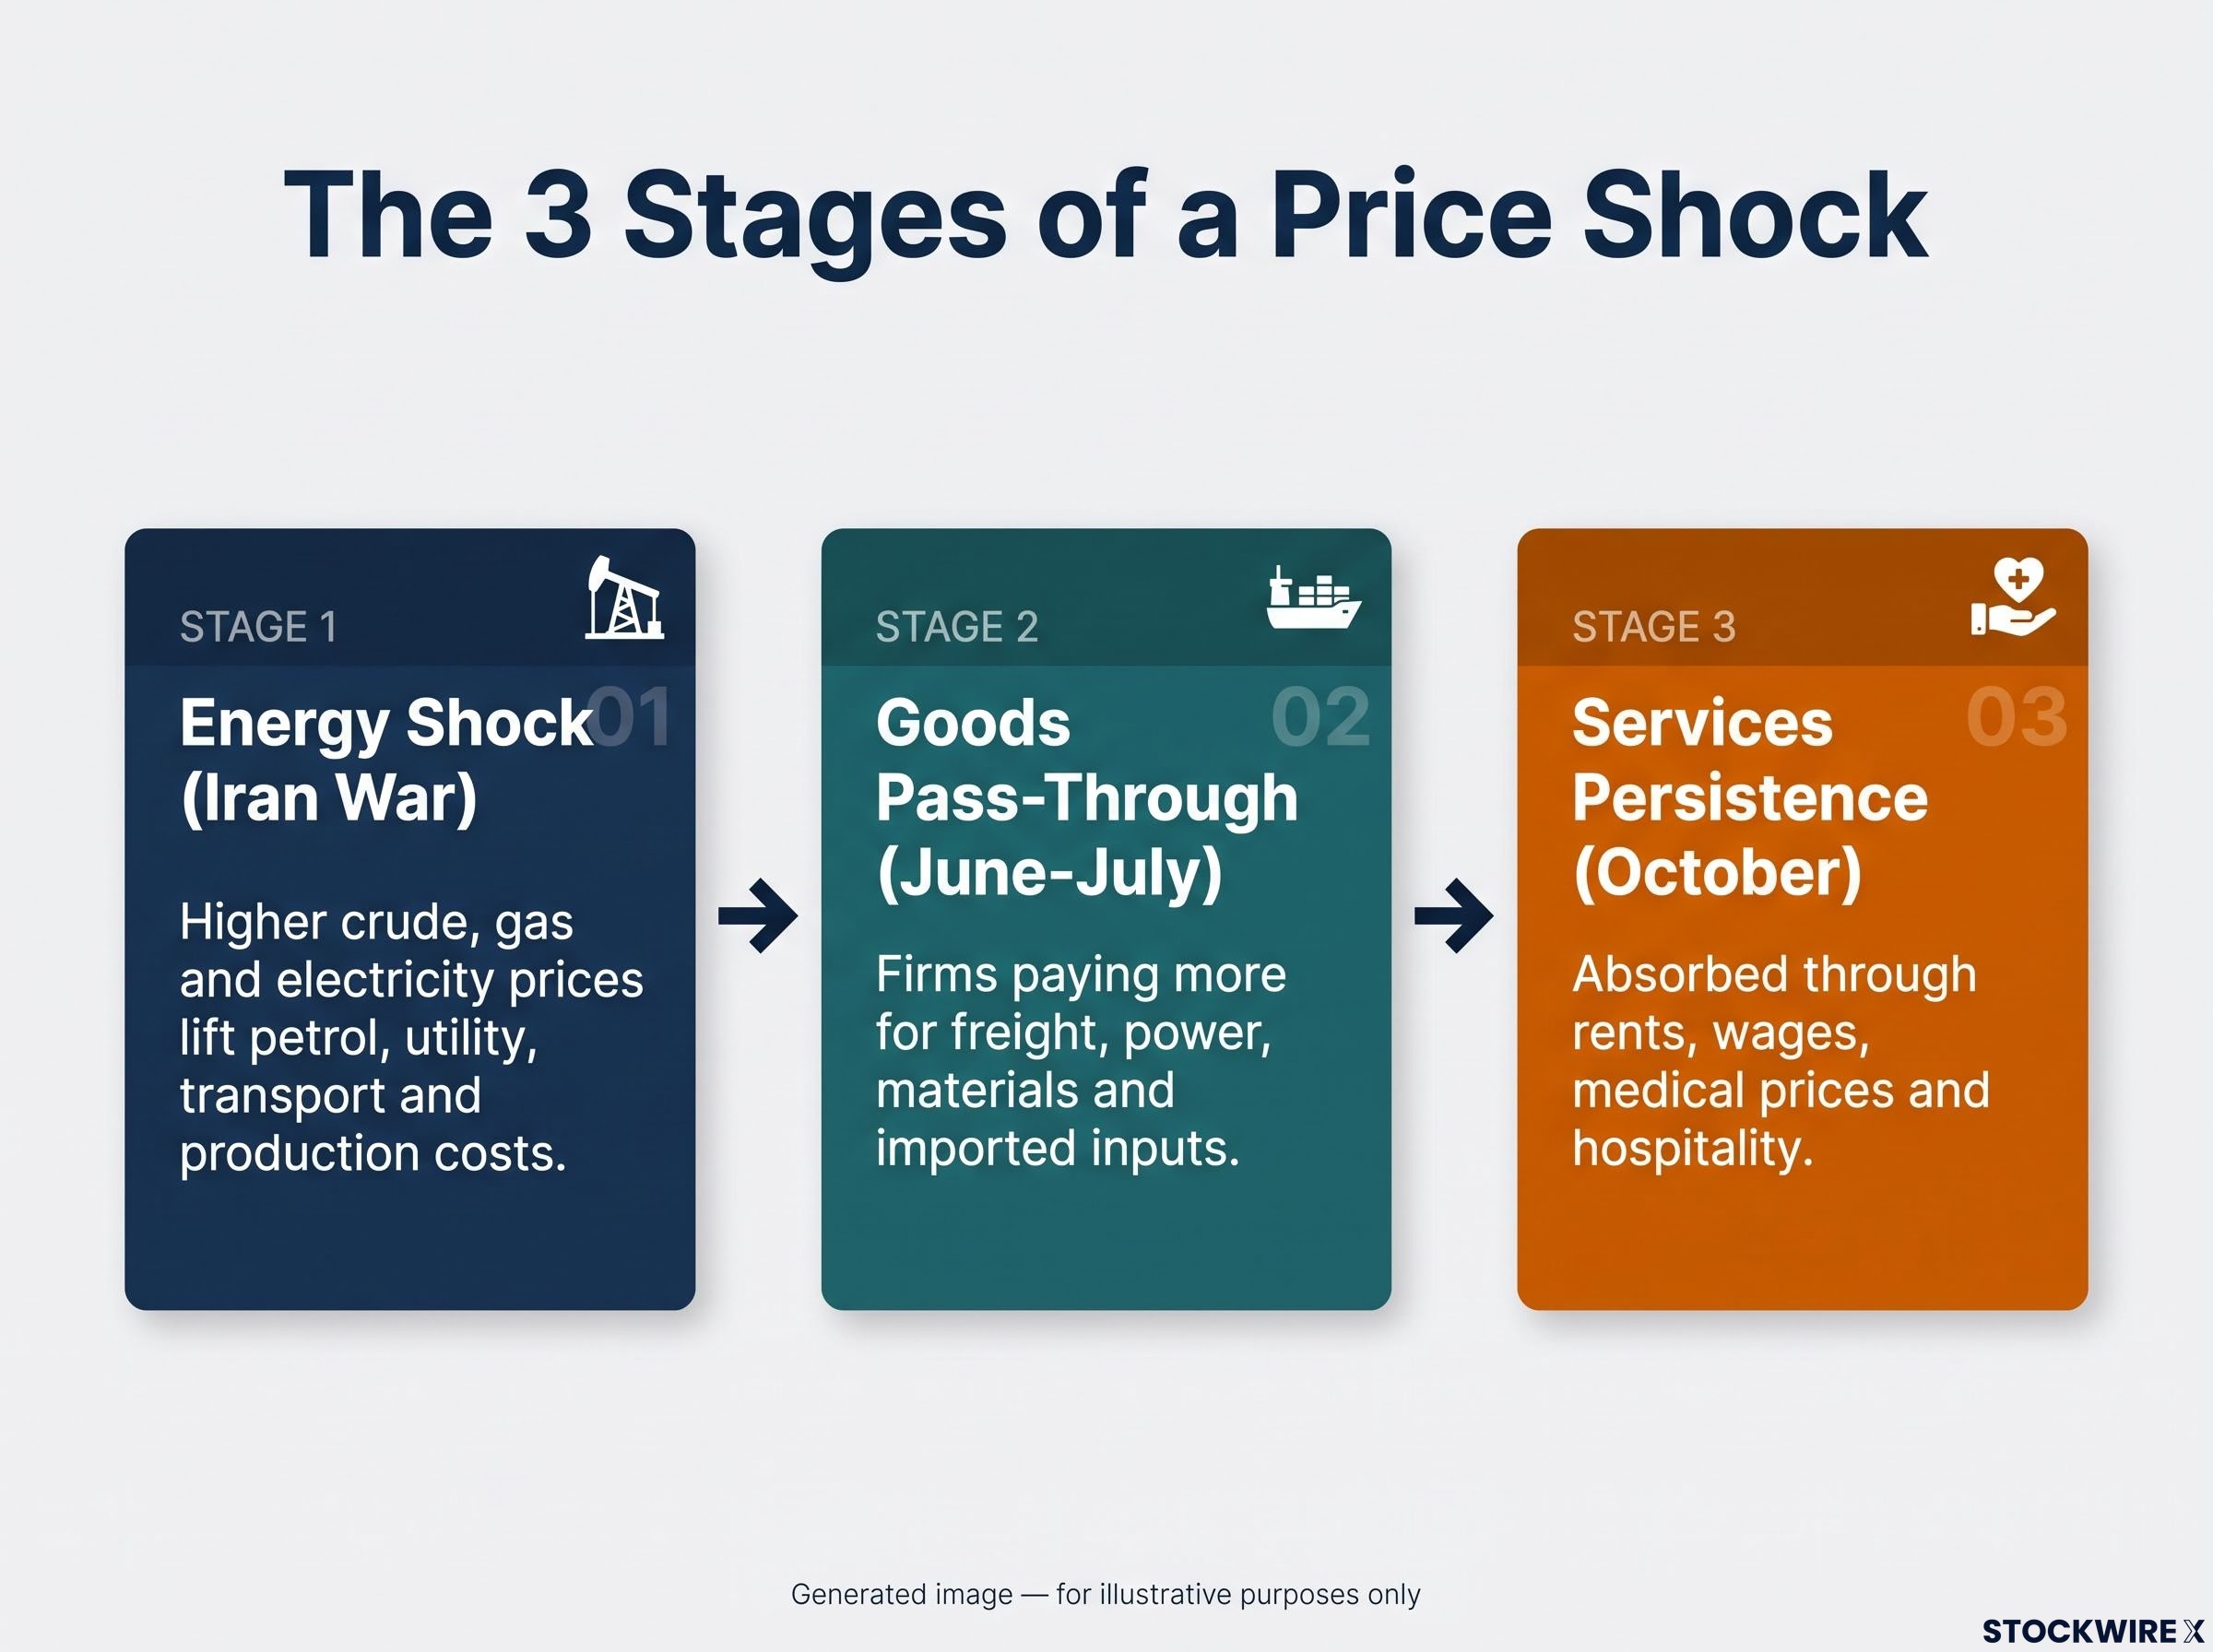
A price shock moves across 3 stages, beginning with the Iran war energy shock, reaching goods in June-July, and showing up in services by October.
That last stage matters most. Services dominate US employment and consumer spending, and their prices tend to stick once they rise.
| CPI measure | September 2026 | October 2026 |
|---|---|---|
| Headline CPI m/m | +0.6% | +0.4% |
| Core CPI m/m | +0.3% | +0.3% |
| Services ex-energy m/m | +0.4% | +0.3% |
| Three-month annualised core CPI | 3.4% | About 3.7% |
Headline inflation cooled, but the core trend climbed. Three-month annualised core CPI, which takes the last three months of price changes and scales them to a yearly rate, rose to about 3.7%. The original source put a three-month annualised figure above 5%, though that may measure a different aggregate; 3.7% is the core reading.
Treat the October services number as a signal about persistence, not about oil. Services prices are the part that does not unwind quickly when crude falls.
Why the missing year-on-year figure matters
The usual annual inflation rate was not officially published for October. The federal shutdown last year meant there was no October 2025 observation, which removed the comparison base.
Private economists estimate headline inflation at around 3.9%-4.0% and core at about 2.8%. Those figures are reasonable estimates, not official data, so weigh the monthly readings more heavily for now.
When big ASX news breaks, our subscribers know first
Why is growth leaning on data centres instead of consumers?
A 3.4% growth rate sounds like a confident economy. The detail underneath tells a narrower story.
The Bureau of Economic Analysis released advance Q3 GDP on 29 October 2026. Final sales to private domestic purchasers, a measure of underlying US demand, rose 4.9%.
To read GDP contributions, you need the weights. According to the original source, consumption makes up about 68% of the economy and investment about 15%, so a small slice is carrying an outsized load when investment drives the headline.
The import drag According to the original source, consumer spending added 2.5 percentage points to Q3 growth, while rising import costs for oil, fertiliser and plastics subtracted 2.64 points.
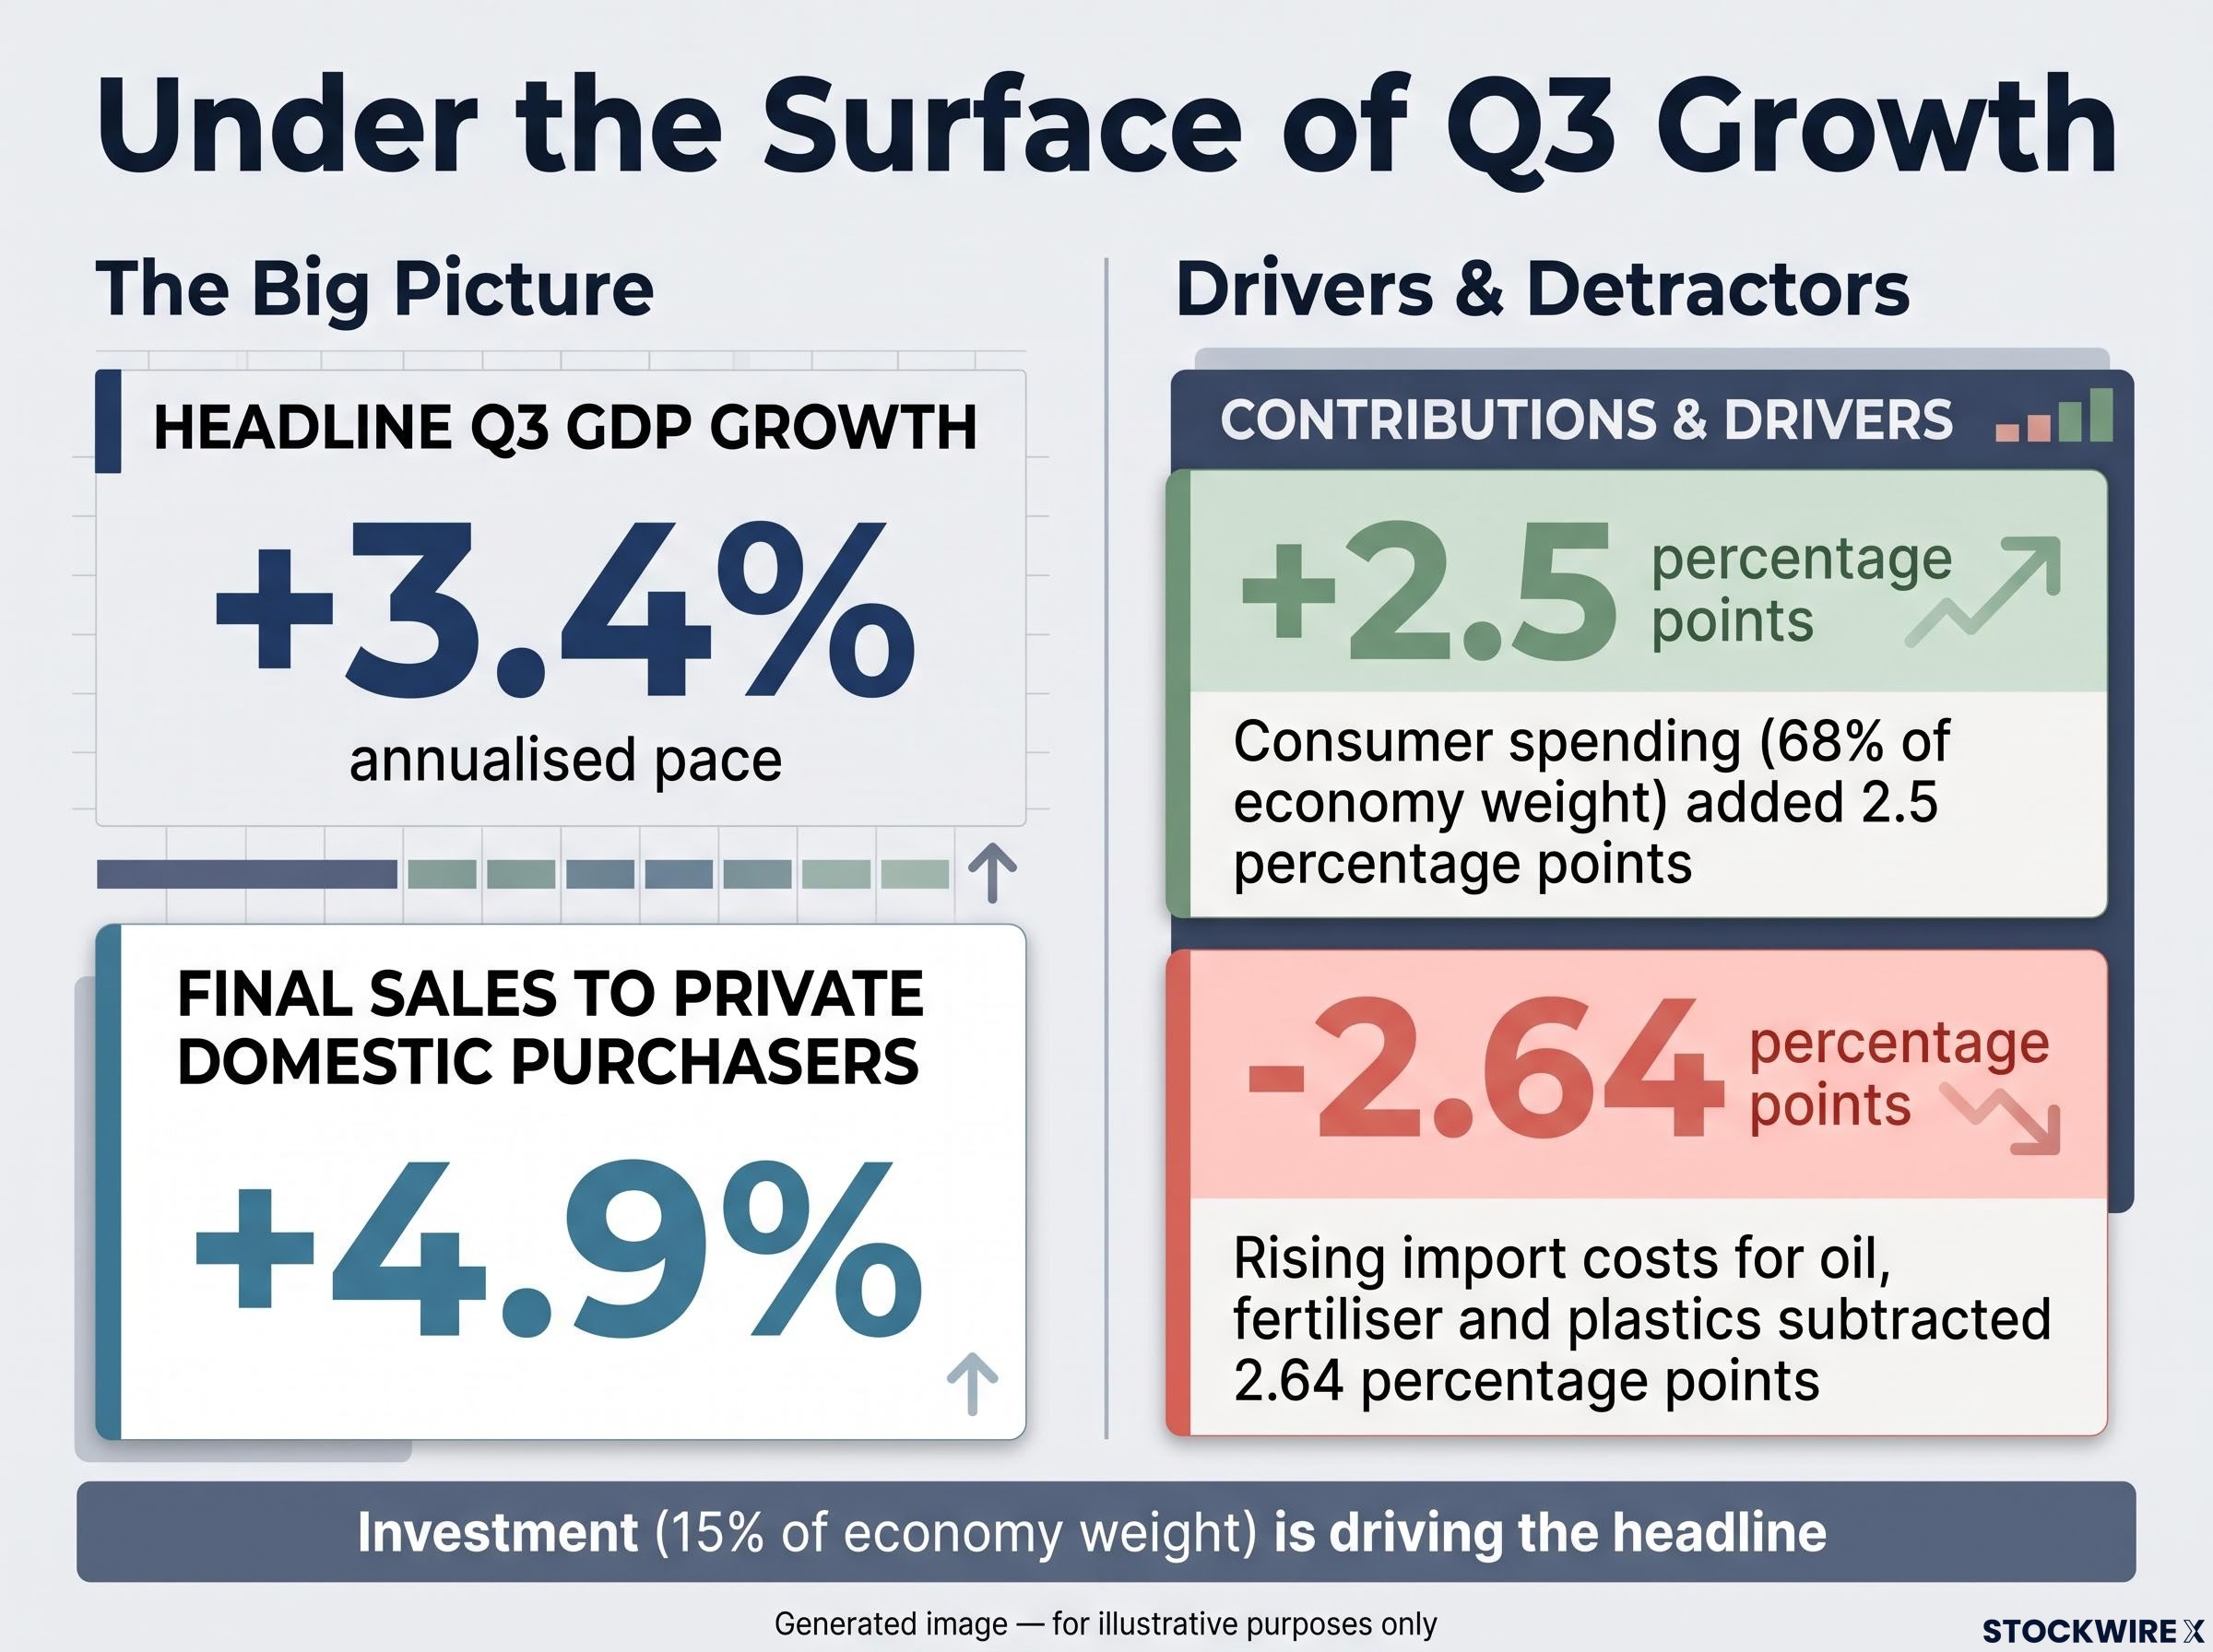
Headline Q3 GDP growth hit a 3.4% annualised pace, driven by consumer spending adding 2.5 percentage points while import costs subtracted 2.64.
That leaves equipment and inventory investment, largely data centres and related stockpiling, as the main engine. Fed Governor Christopher Waller described Q3 growth as supported by strong consumption and a surge in high-tech equipment investment tied to AI.
Capital Economics has reportedly estimated hyperscaler spending at around $800 billion in 2026, a figure not independently confirmed. Either way, the economy’s strength now depends on a smaller set of corporate decisions, which is worth weighing before you assume broad resilience.
Earlier in 2026, AI infrastructure investment already accounted for roughly half of US output growth, and the Fed has set up internal working groups because it lacks a reliable model for separating a growth engine from front-loaded demand.
What the ISM data adds
October’s Institute for Supply Management (ISM) surveys, which ask purchasing managers about business conditions (readings above 50 signal expansion), confirm momentum without acceleration.
| Index | Reading | What it signals |
|---|---|---|
| Manufacturing PMI | 55.5 (from 54.5) | Second highest in four years |
| Manufacturing prices paid | 75.2 | Input costs still rising, though pressure softened |
| Manufacturing inventories | 51.4 | Shift from contraction to rebuilding |
| Services PMI | 54.5 | 28th consecutive month of expansion |
| Services business activity | 53.8 | Slower activity growth |
| Services new orders | 55.9 | Still expanding, but sharply slower |
Manufacturing looks strong on top, with softer backlogs and hiring underneath. Services are steady, not speeding up, which matters for how much more tightening the Fed believes it needs.
What are markets pricing for the Fed, and where do they differ from its projections?
CME FedWatch converts futures prices into probabilities for each Fed decision. Readings shift through the day as trades move, which is why sources quote slightly different numbers.
For December, CNBC reported:
- 25 bp hike: about 88%
- 50 bp hike: about 11%
- Original source reading: roughly 85% and 15%, likely reflecting a different observation time
A basis point is one-hundredth of a percentage point, so 25 bp equals 0.25%.
The gap opens beyond December. Markets price roughly 50-56 bp of further hikes through 2027, with moves increasingly priced for January, March and June. The Fed’s September projections showed a hold through 2027 and cuts from 2028.
Waller sits on the hawkish side. On 10 November, he backed a 25 bp December hike and said a 50 bp move should be considered if core CPI ran at about 0.3% a month or higher. October core came in at exactly 0.3%.
In Waller’s 10 November speech, the Governor tied any case for a larger move to the monthly core pace, which means each upcoming CPI print now works as a direct trigger for how aggressively you should expect the Fed to act.
| More hawkish | Less hawkish |
|---|---|
| Core CPI at 0.3% for a third month; three-month annualised core about 3.7% | Hikes can destroy demand, reducing the need for repeated moves |
| Waller backs at least 25 bp, with 50 bp on the table | Higher rates cannot produce more oil |
| Energy, tariffs and AI reinforce each other | Falling breakeven inflation and lower crude reduce embedding risk |
PPI is the next test. Consensus expects headline PPI of +0.4% and core of +0.3%, against September’s +1.3% and +0.7%; the result was still pending at the time of writing. A cool print would suggest September’s surge was temporary, while a hot one would support the hawks. These scenarios are speculative and subject to change as data arrives.
Demand destruction versus overheating
The disagreement comes down to one distinction. A supply shock that destroys demand eventually cools inflation on its own, implying fewer hikes after an initial response.
A supply shock plus overheating demand is different. If strong spending keeps services prices rising, the Fed may need more tightening. The 1970s and post-Covid episodes both showed initial shocks broadening into wages and services.
What happens if the AI buildout slows?
If growth leans on data centre investment, then a pullback in that spending would travel through the economy along a clear chain.
- Semiconductor equipment: Fewer orders for chips and servers.
- Construction: Fewer data centre sites under way.
- Utilities: Slower growth in power demand.
- Commercial lending: Less financing for projects.
- Industrial production: Weaker output across suppliers.
- Regional employment: Job losses where projects cluster.
AI spending plays a double role right now. It supports growth, and it also adds a demand impulse competing for power, construction labour and equipment, which feeds the services inflation described earlier.
The competition for power is partly a grid bottleneck: data centres can be built in 2-5 years, but the transmission lines feeding them can take more than 10, which keeps electricity costs under upward pressure.
Invesco has reportedly flagged the scale of planned investment and higher interest rates as risks to the pace of spending. Separately, CNBC carried reports of a leadership change at Nvidia, alongside analyst expectations that revenue will more than double this fiscal year; those reports have not been independently confirmed.
Past capex-led expansions lifted GDP quickly, then carried downside risk if firms overbuilt or financing tightened. A slowdown would cut the growth impulse and the inflation impulse together, so you should see AI dependence as a cyclical risk that cuts across the rate outlook rather than a one-way bet.
The case for durability
The counter-view AI investment may be a lasting productivity and infrastructure transition. On that view, a slower buildout would trim the growth impulse without erasing long-term demand for computing, power and data infrastructure.
Hold both outcomes in mind. The answer decides whether higher rates bite hard or simply slow a long project.
Reading the next releases: what to watch in a split rate outlook
The shock has reached services, growth rests heavily on AI investment, and market pricing sits above the Fed’s own projection. Four variables will show which way that gap closes:
- The PPI result: pending as of writing, and a test of whether September’s surge was temporary.
- The next core CPI print: another 0.3% would strengthen the case for larger hikes. Remember official annual figures are missing for October.
- Oil and breakeven inflation: further falls would ease the risk of prices becoming embedded.
- Hyperscaler capex signals: any pullback would hit growth and inflation together.
The gap can close in either direction. Watch which variable moves first.
This article is for informational purposes only and should not be considered financial advice. Investors should conduct their own research and consult with financial professionals before making investment decisions.