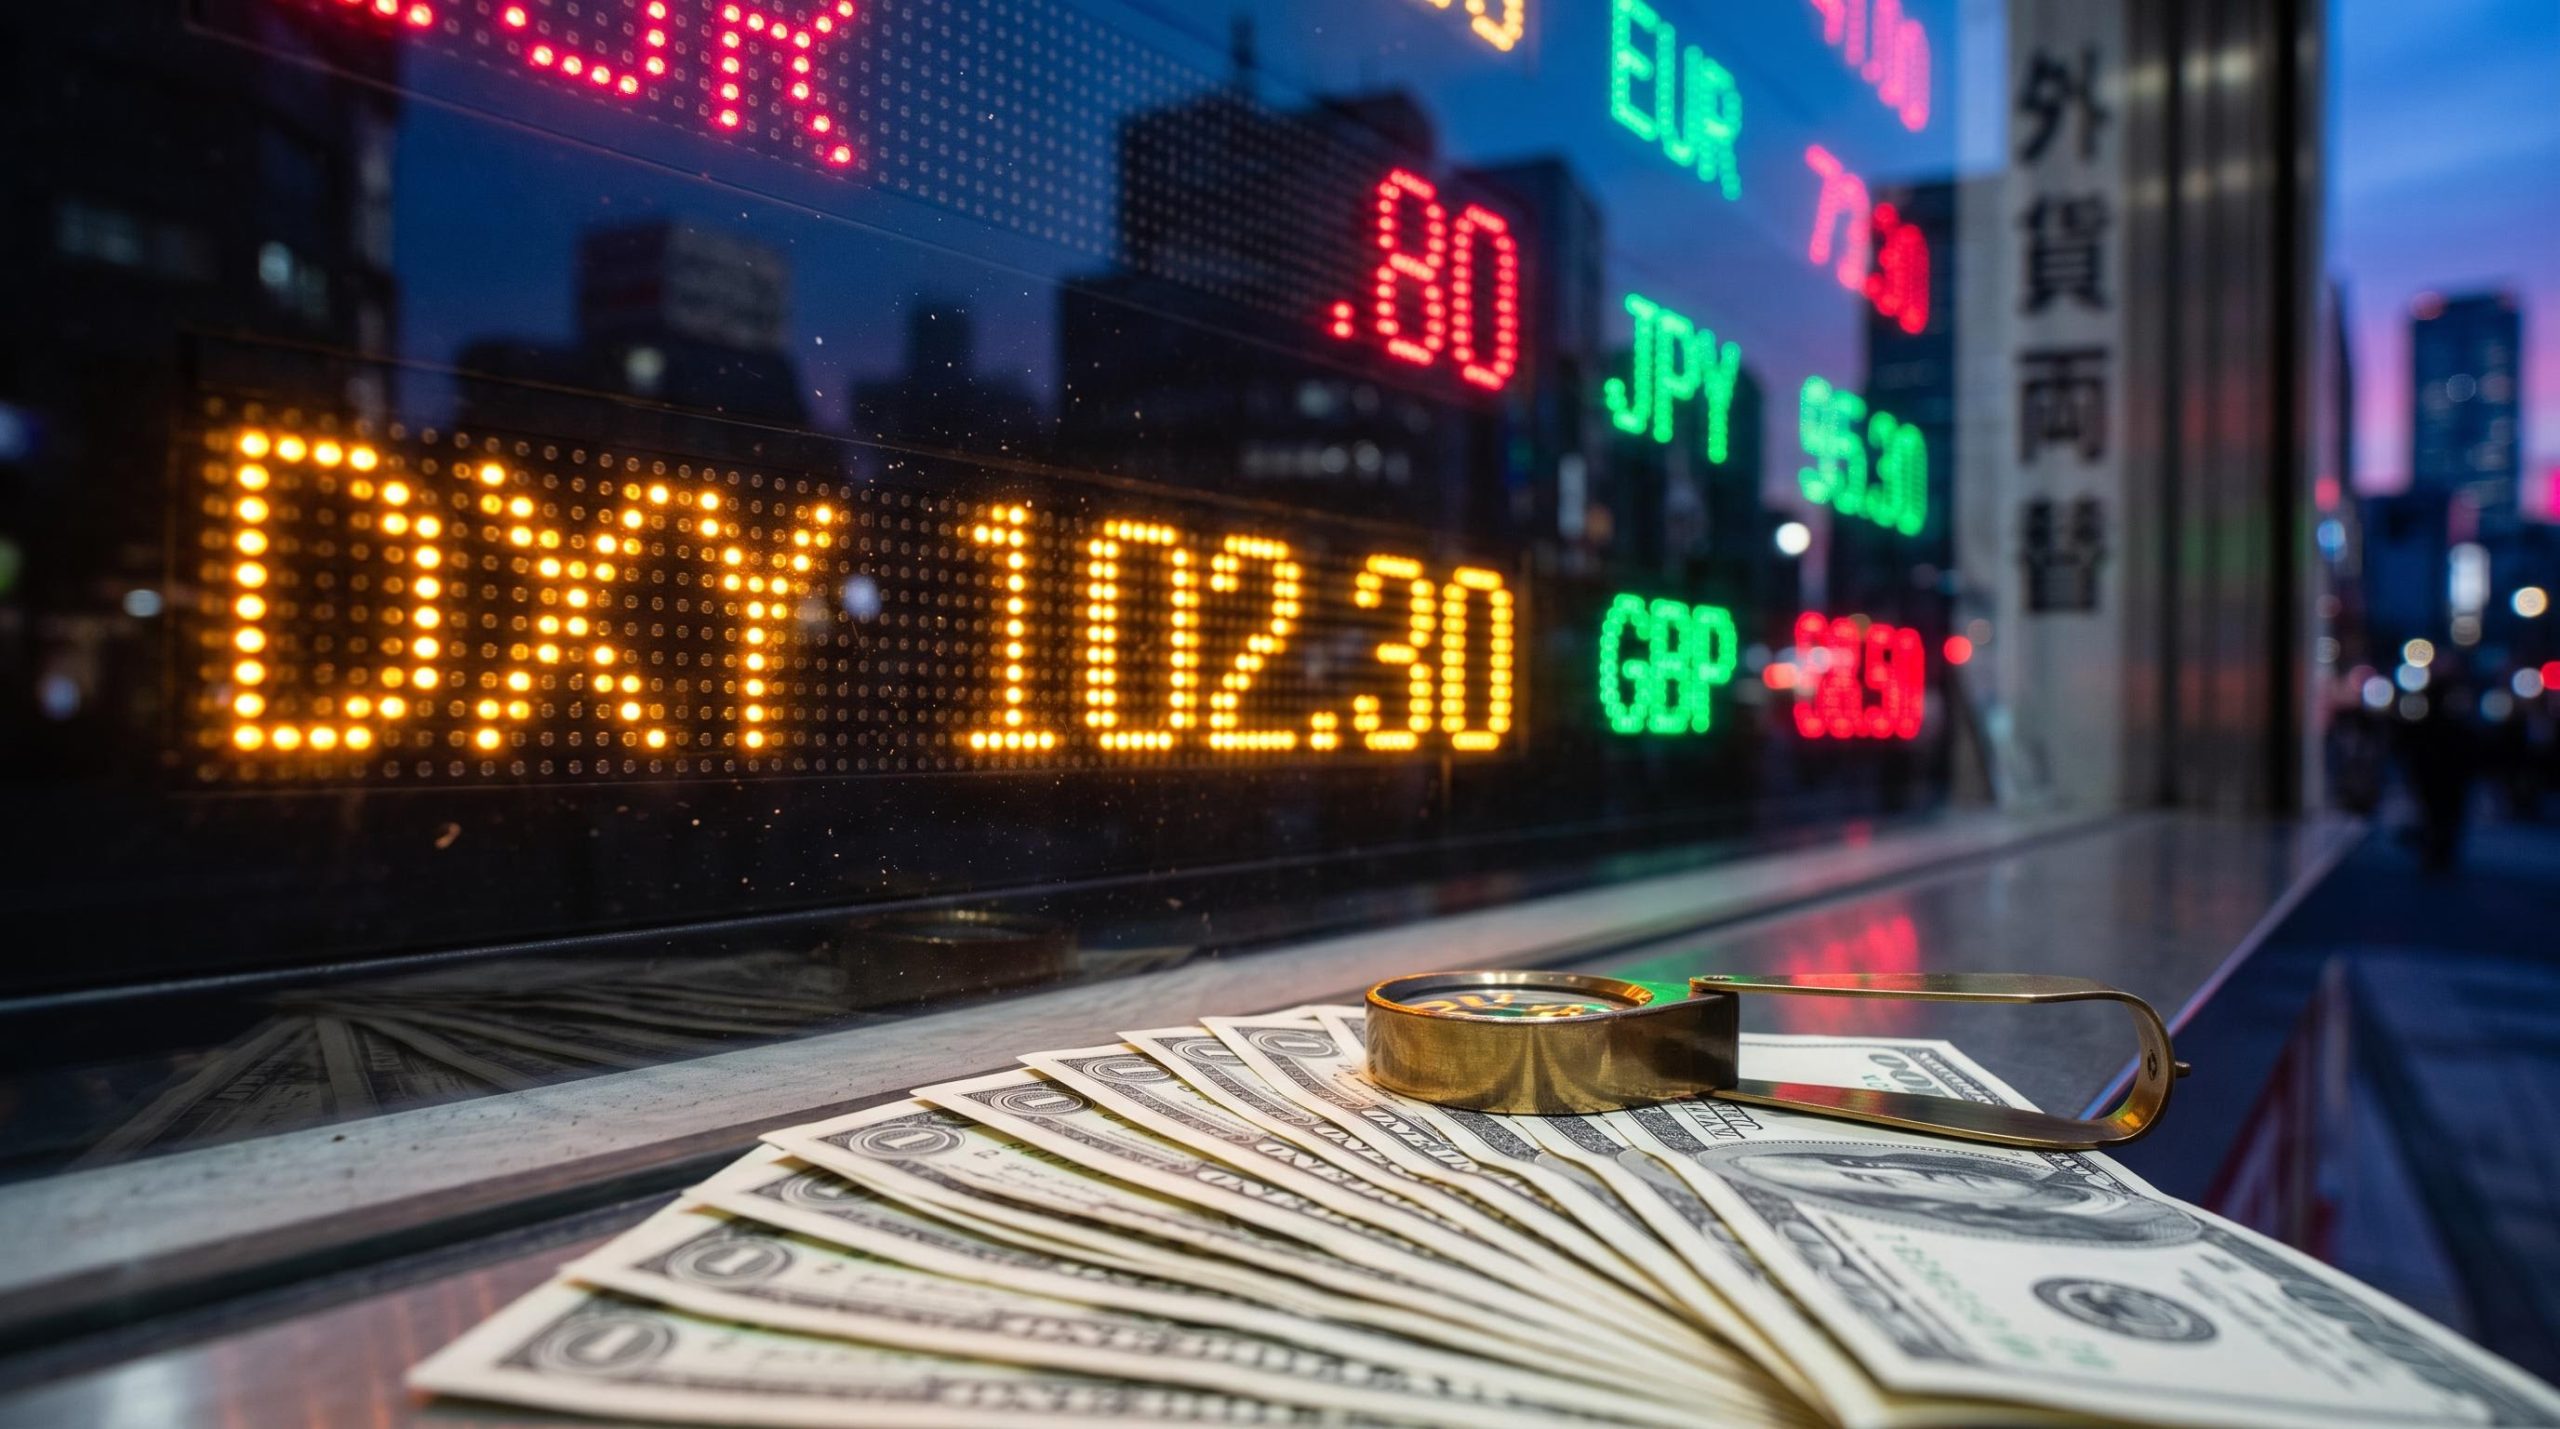
The US dollar index is climbing, but not because the US economy suddenly looks unstoppable. It is climbing because one number was repriced: the interest rate markets expect the Federal Reserve to set next month. The index sat at about 102.30 on 11 November 2026, its strongest since April 2025 and close to the 103.00 zone.
The repricing is now showing up across markets. CME FedWatch-based estimates put the odds of a December hike at 85% to 90%, depending on the source. The ten-year Treasury yield is also brushing 5%. Together, these two forces are moving currencies, gold and oil at the same time.
Here is a working framework for tracing one rate repricing through to EUR/USD, GBP/USD, USD/JPY, AUD/USD, gold and oil. It also covers the specific events that could confirm the move or break it.
What is driving the US dollar index higher: the yield chain explained
The headline is simple: the dollar is at a 19-month high. The mechanism behind it has more moving parts, and each link can fail.
Markets reacted to a hot inflation reading. October’s Consumer Price Index (CPI), the main US measure of consumer prices, reportedly rose 0.4%, against the 0.3% expected. Strong employment data added to the pressure.
Fed officials then fed the move. Governor Christopher Waller is reportedly leaning towards a December increase and told CNBC on 10 November that a 50 basis point move should be considered if inflation runs hot. A basis point (bp) is one hundredth of a percentage point. Cleveland Fed President Beth Hammack and San Francisco Fed President Mary Daly have reportedly leaned hawkish, but both favour gradual tightening.
What the dollar index measures
The DXY tracks the US dollar against a basket of six major currencies. The basket is weighted heavily towards the euro, the yen and sterling. A rising DXY therefore mostly tells you the dollar is gaining against those three.
The 103.00 area matters because it is a resistance zone, meaning a price level where past rallies have stalled. A clean break above it would suggest buyers have the conviction to push further.
Why yields lead the dollar
The chain runs in five steps:
- Hot economic data arrives.
- Markets raise the policy rate they expect from the Fed.
- Short-dated Treasury yields rise first.
- The gap between US rates and rates in other countries widens.
- Capital moves into dollar assets, and the dollar strengthens.
The chain in one line Hawkish data → higher expected Fed rate → higher front-end yields → wider rate differential → stronger dollar
The two-year yield is the link to watch, because it reacts most directly to Fed expectations. The ten-year near 5% gets the headlines.
Treasury yields are not fixed signals. How bond yields are set at auction and then repriced continuously in the secondary market explains why front-end yields can jump on a single data release while longer maturities respond more slowly.
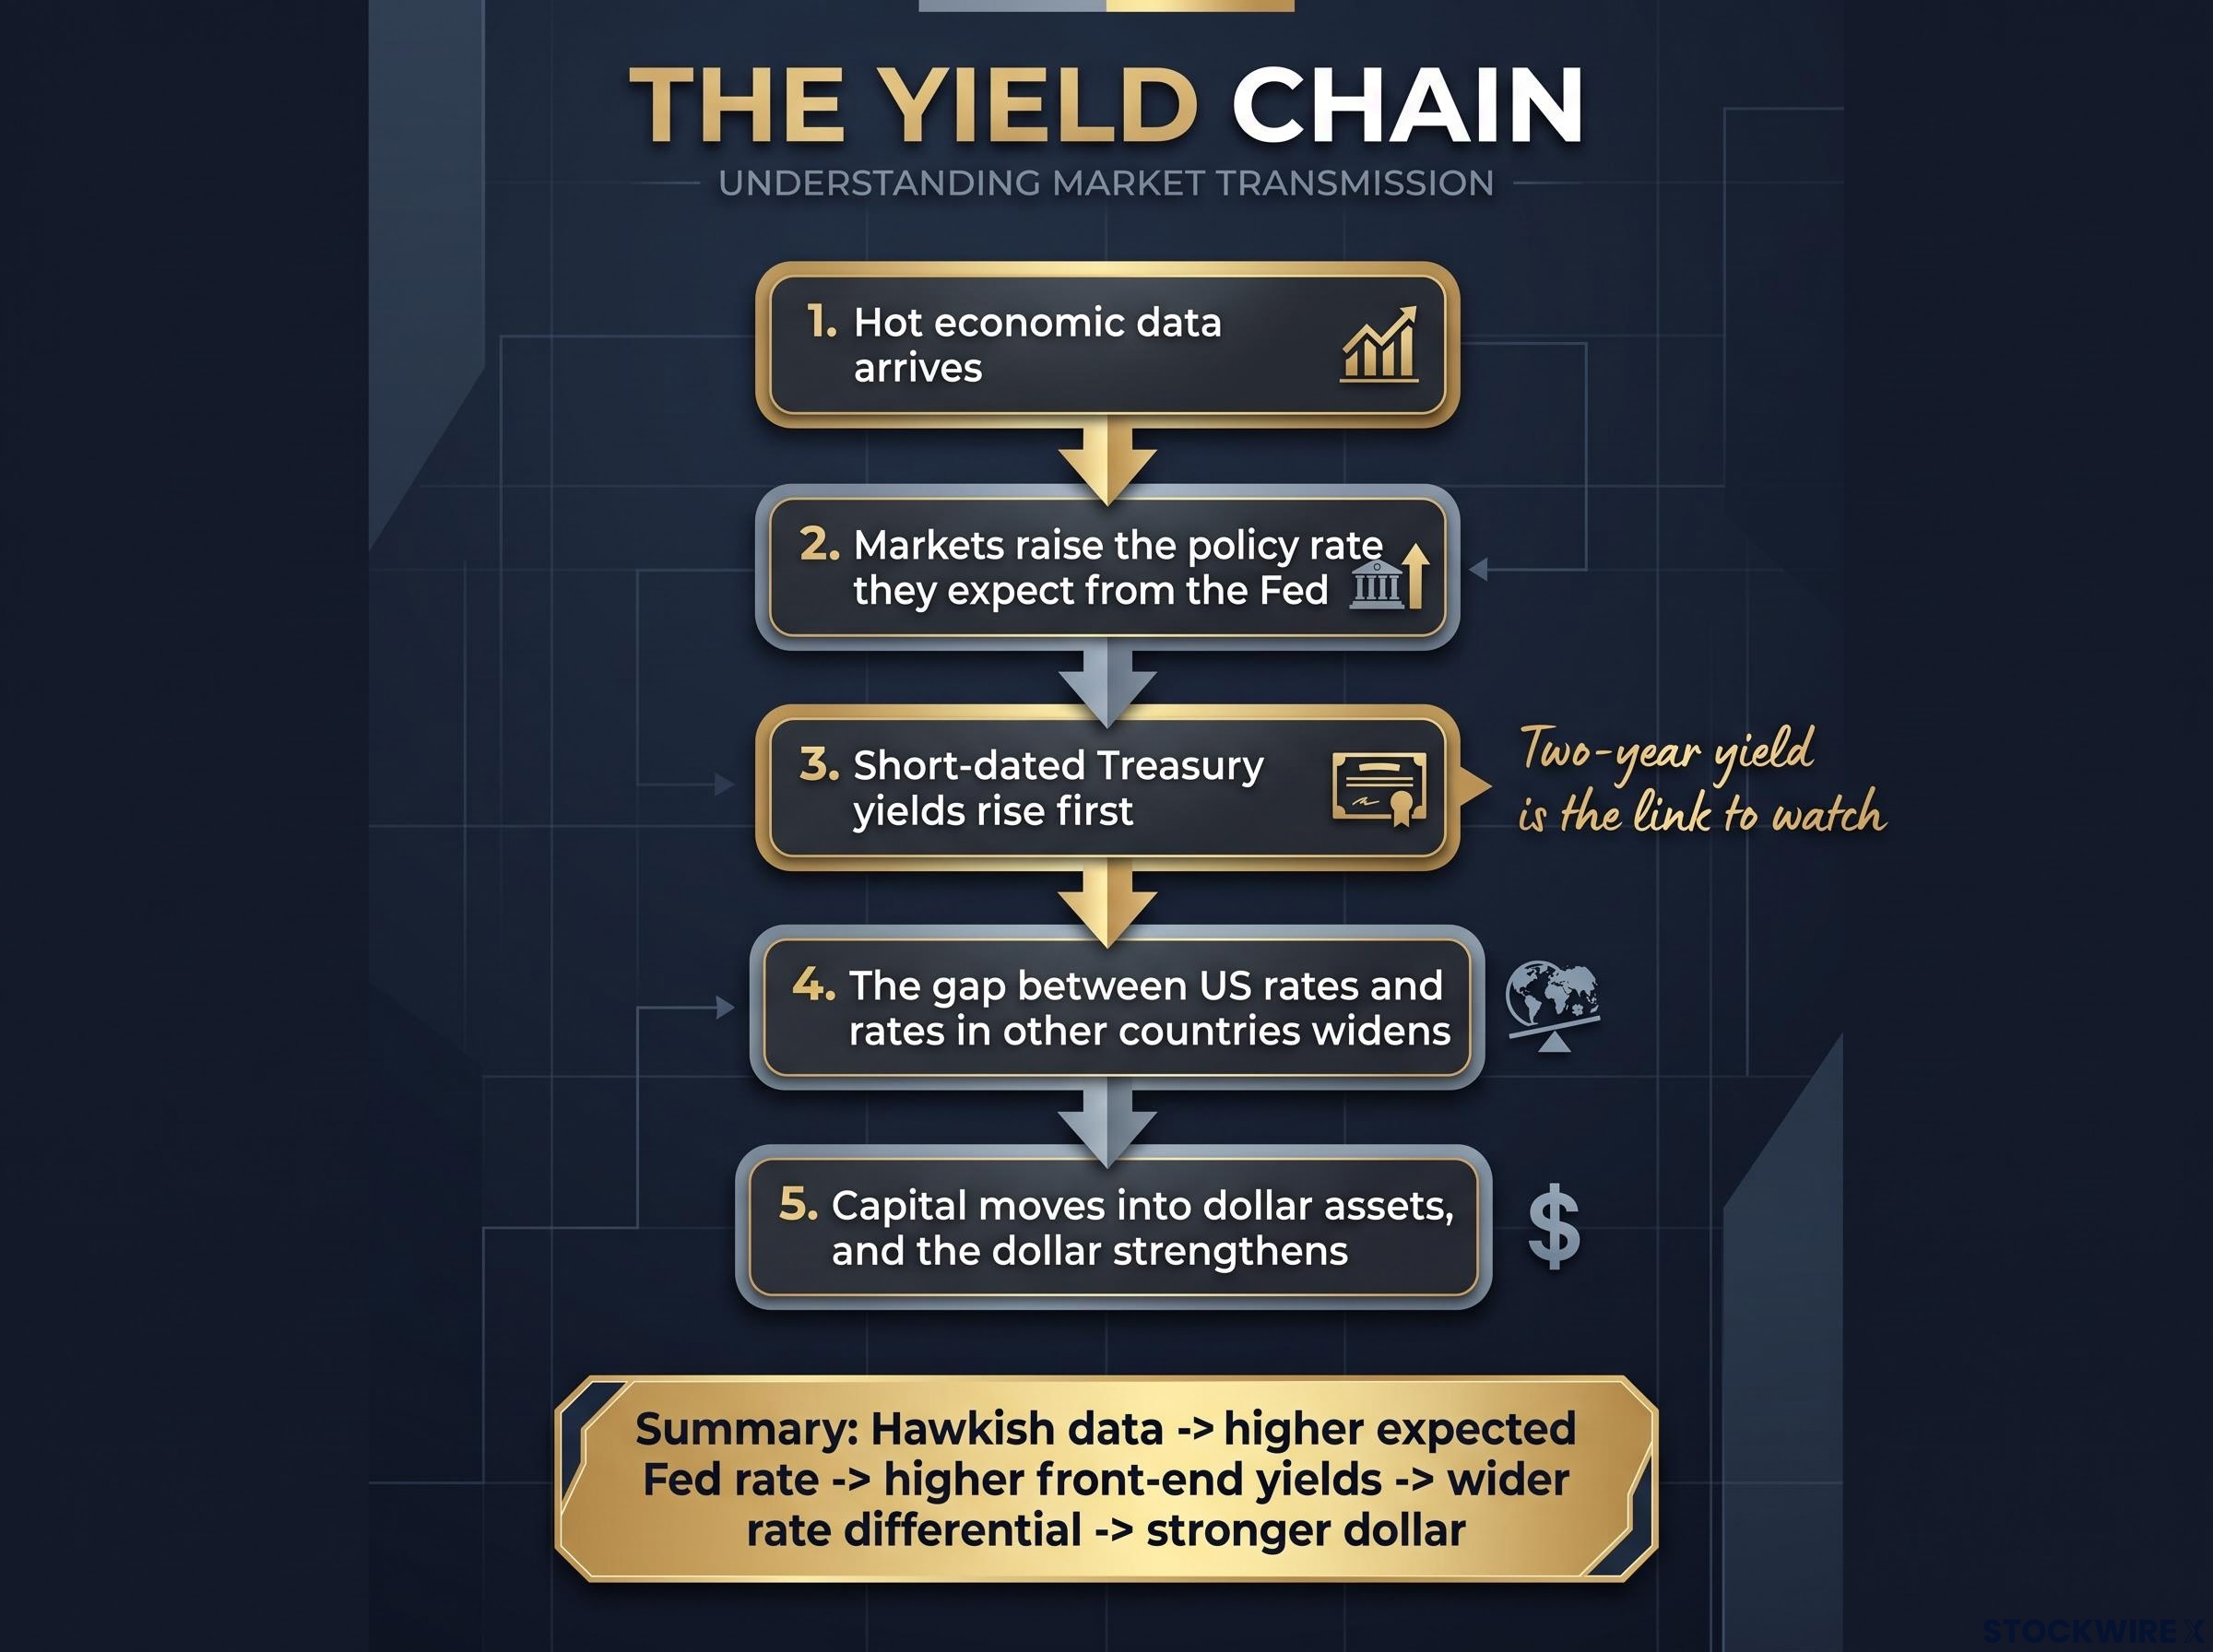
The sequence connects hot economic data to a stronger dollar, with the two-year yield acting as the critical link to watch.
| Measure | Reported level | Change |
|---|---|---|
| US Dollar Index (DXY) | 102.30 | Up 0.1% |
| Two-year Treasury yield | 4.75% | Up about 18 bp |
| Ten-year Treasury yield | 4.996% | Up 13.8 bp |
| December 25 bp hike odds | 85% (Reuters) to 90% (Equiti) | Open question: 25 or 50 bp |
The figures are as reported on 11 November and differ slightly between sources.
What this tells you is that the rally rests on repricing, not on growth. The dollar stays strong only while the Fed stays restrictive and other central banks do not follow. One hot CPI print is not enough to call that a trend.
When big ASX news breaks, our subscribers know first
How the dollar move reaches currency pairs, gold and oil
The same driver hits every asset, but the effect is different each time. The way it lands depends on what else is pushing on that asset.
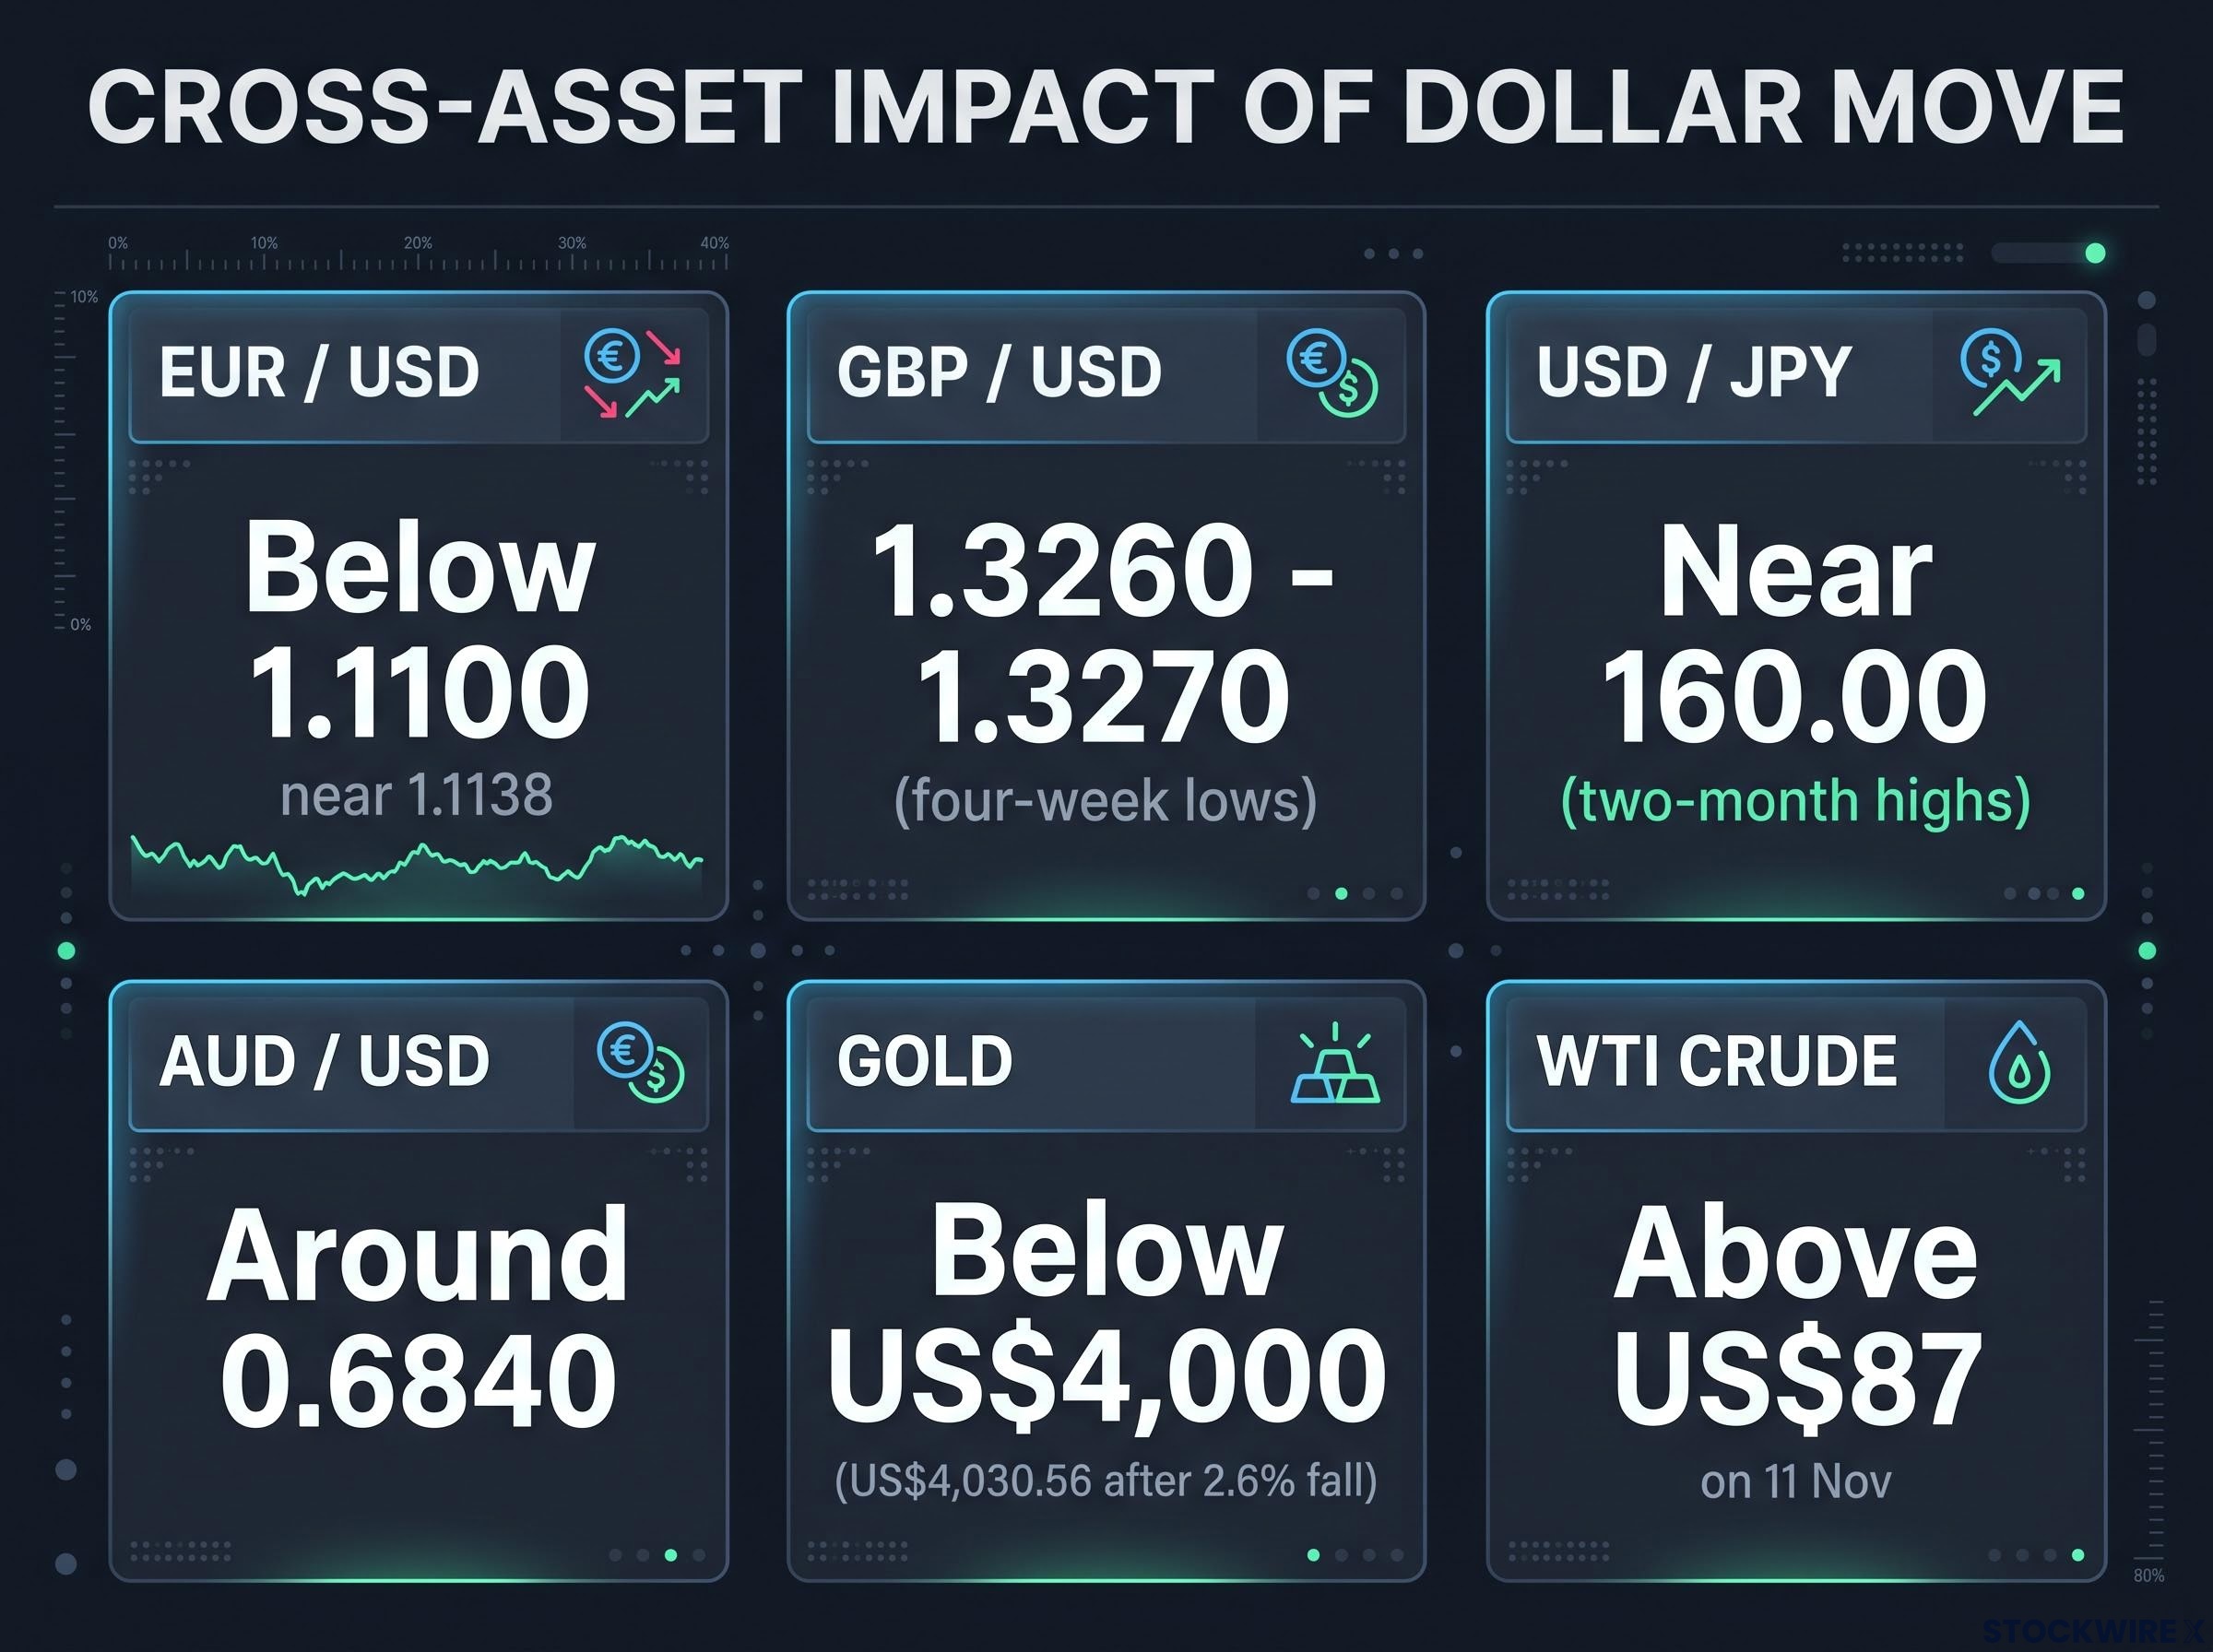
The dollar’s strength causes varied market impacts, pushing EUR/USD below 1.1100 and gold below US$4,000, while WTI crude sits above US$87.
Currency pairs
EUR/USD fell below the 1.1100 area, last seen in May 2025. Another same-day report put it near 1.1138, so treat the exact level loosely. GBP/USD slipped to four-week lows around 1.3260-1.3270, as the dollar’s yield advantage grew and investors cut exposure to riskier assets.
USD/JPY is the cleanest version of the trade. Higher Treasury yields against low Japanese yields encourage carry trades, where investors borrow cheaply in yen to hold higher-yielding dollar assets. That pushed the pair to two-month highs near 160.00.
AUD/USD is affected by two forces at once. Wider rate gaps and weaker risk appetite together pushed it to around 0.6840, its lowest since January.
Gold
Gold slipped below US$4,000 per ounce. Another report put it at US$4,030.56 after a 2.6% overnight fall. Three pressures are working against it:
- Higher nominal yields make interest-paying Treasuries more attractive than gold, which pays nothing.
- Higher real yields, meaning returns after inflation, raise the cost of holding gold.
- A stronger dollar makes gold more expensive for buyers outside the US.
There is also a counterforce. Citi commodities strategist Max Layton has reportedly argued that a large enough fall in oil could push the Fed from hiking towards cutting, which would support gold.
Oil and the fuel-cost lag
WTI crude climbed back above US$87 on 11 November, after three straight daily declines, as Middle East tension flared again. Since mid-October, Brent has shed roughly a third of its value as traders bet the Iran war is winding down. The earlier Brent readings of US$108.64 on 2 November and about US$100.60 on 4 November come from different dates, so they cannot be compared directly with today’s WTI price.
That move is mostly about geopolitics, not the dollar. Peace hopes and the outlook for shipping through the Strait of Hormuz set the risk premium in the price.
Pump costs for diesel, freight and fertiliser have yet to drop in step with crude. Several factors slow the pass-through: inventories bought at earlier prices, refinery margins, taxes, war-risk and rerouting costs, and fertiliser’s dependence on natural gas. No named-source estimate quantifies how long that lag lasts.
What you should take from this is that a strong dollar does not guarantee cheaper gold or cheaper fuel. The dollar is only one of several forces on commodity prices.
What could stall the rally, and what history suggests
The case for a durable rally looks solid. It also has specific points where it could break.
December hike odds also rest on a supply-driven inflation backdrop, where energy costs account for most of the rise in goods prices, which is why some analysts question how much a rate increase can actually fix.
| Interpretation | Supporting logic | Counter-argument |
|---|---|---|
| Durable rally | Inflation and jobs data support a hike; Waller is open to 50 bp | December may already be discounted |
| Routine 25 bp only | Goldman’s David Mericle reportedly expects 25 bp, with most voters hesitant on 50 | A hotter inflation print revives 50 bp |
| Already priced in | 85% to 90% odds leave little room for surprise | Markets can still price more 2027 hikes |
| Oil weakness undercuts tightening | A peace deal lowers energy prices and inflation | Better risk appetite has an uncertain net effect on the dollar |
| Positioning squeeze | A crowded long-dollar trade can unwind fast | Momentum and yield gaps can sustain it |
Lessons from 2022 and the 160 line
The 2022 episode followed the same chain. The Fed tightened aggressively while the Bank of Japan (BoJ) held rates ultra-low. The sequence that followed, as reported by Reuters, ran like this:
- The US-Japan yield gap widened, and USD/JPY climbed sharply.
- In September, Japan intervened in currency markets for the first time since 1998, and the dollar fell more than 2% to about 140.3 yen.
- In October, Japan intervened again as the pair approached 152.
Japan stepped in again in April 2024 after USD/JPY hit 160.245, spending a reported ¥9.79 trillion. The pair then reached 160.72 in April 2026 before the yen recovered. A Bank for International Settlements (BIS) review of 2026 reportedly tied the yen’s weakness to the widening US-Japan rate gap.
The pattern is consistent. Intervention can spark violent counter-moves, but Commonwealth Bank economist Joe Capurso has reportedly said it often fails to change the broader trend unless policy expectations turn as well.
Treat 160 on USD/JPY and the oil-peace link as your two early warning signs. Both can reverse the dollar’s momentum faster than the Fed can.
What to watch next: data releases and central bank speakers
The December decision itself is largely priced. What matters now is anything that changes the size of that hike or the path of rates after it. The Fed speaker run is reportedly set for 12 November:
- Beth Hammack: favours restrictive policy delivered in smaller, more frequent steps
- Mary Daly: expects further tightening at a deliberate pace; reportedly speaking again on 13 November
- Michael Barr and Austan Goolsbee: no reliable recent read on their views
These dates are reported, not confirmed. Calendar details for the FOMC minutes, the record of the Fed’s last meeting, were inconsistent across sources, so no date is given here.
| Region | Event | Date | Asset affected |
|---|---|---|---|
| US | Jobless claims, existing home sales | This week | DXY, two-year yield |
| US | EIA crude inventories | This week | WTI |
| US | Empire State Manufacturing | 16 November | DXY |
| US | University of Michigan sentiment | 20 November | DXY, gold |
| UK | Q3 GDP, industrial production, trade, RICS; BoE speakers on 18 November | Various | GBP/USD |
| Eurozone | ECB’s Vujčić and Lagarde speak | Unconfirmed | EUR/USD |
| Japan | BoJ’s Asada speaks | Unconfirmed | USD/JPY |
| Australia | RBA’s Baker; Melbourne Institute inflation expectations | Unconfirmed | AUD/USD |
The Reserve Bank of Australia (RBA) reportedly raised its cash rate to 4.85% on 2-3 November and has no decision this coming week. Even so, its commentary will shape how much of the rate gap the Australian dollar can close.
Reading the dollar’s next move: three tests for the rally
The chain, the risks and the calendar come down to three tests you can apply as new data arrives.
First, does the data keep the Fed’s path restrictive beyond December? Second, does the US yield advantage hold as other central banks set their own course? Third, do oil and peace headlines keep inflation expectations elevated, or let them fall?
A December hike is largely priced in. The next leg depends on how markets price 2027, not on the decision itself.
Yields alone can mislead. Credit spreads add a second reading, and with investment-grade spreads still compressed, bond investors appear to be treating the global yield rise as a repricing rather than a sign of systemic stress.
Two levels will test the thesis first. Watch the 103.00 zone on the DXY and 160 on USD/JPY: a clean break of either confirms the chain is holding, while a rejection may signal the repricing has run its course.
These statements are speculative and subject to change based on market developments and central bank decisions.
This article is for informational purposes only and should not be considered financial advice. Investors should conduct their own research and consult with financial professionals before making investment decisions.