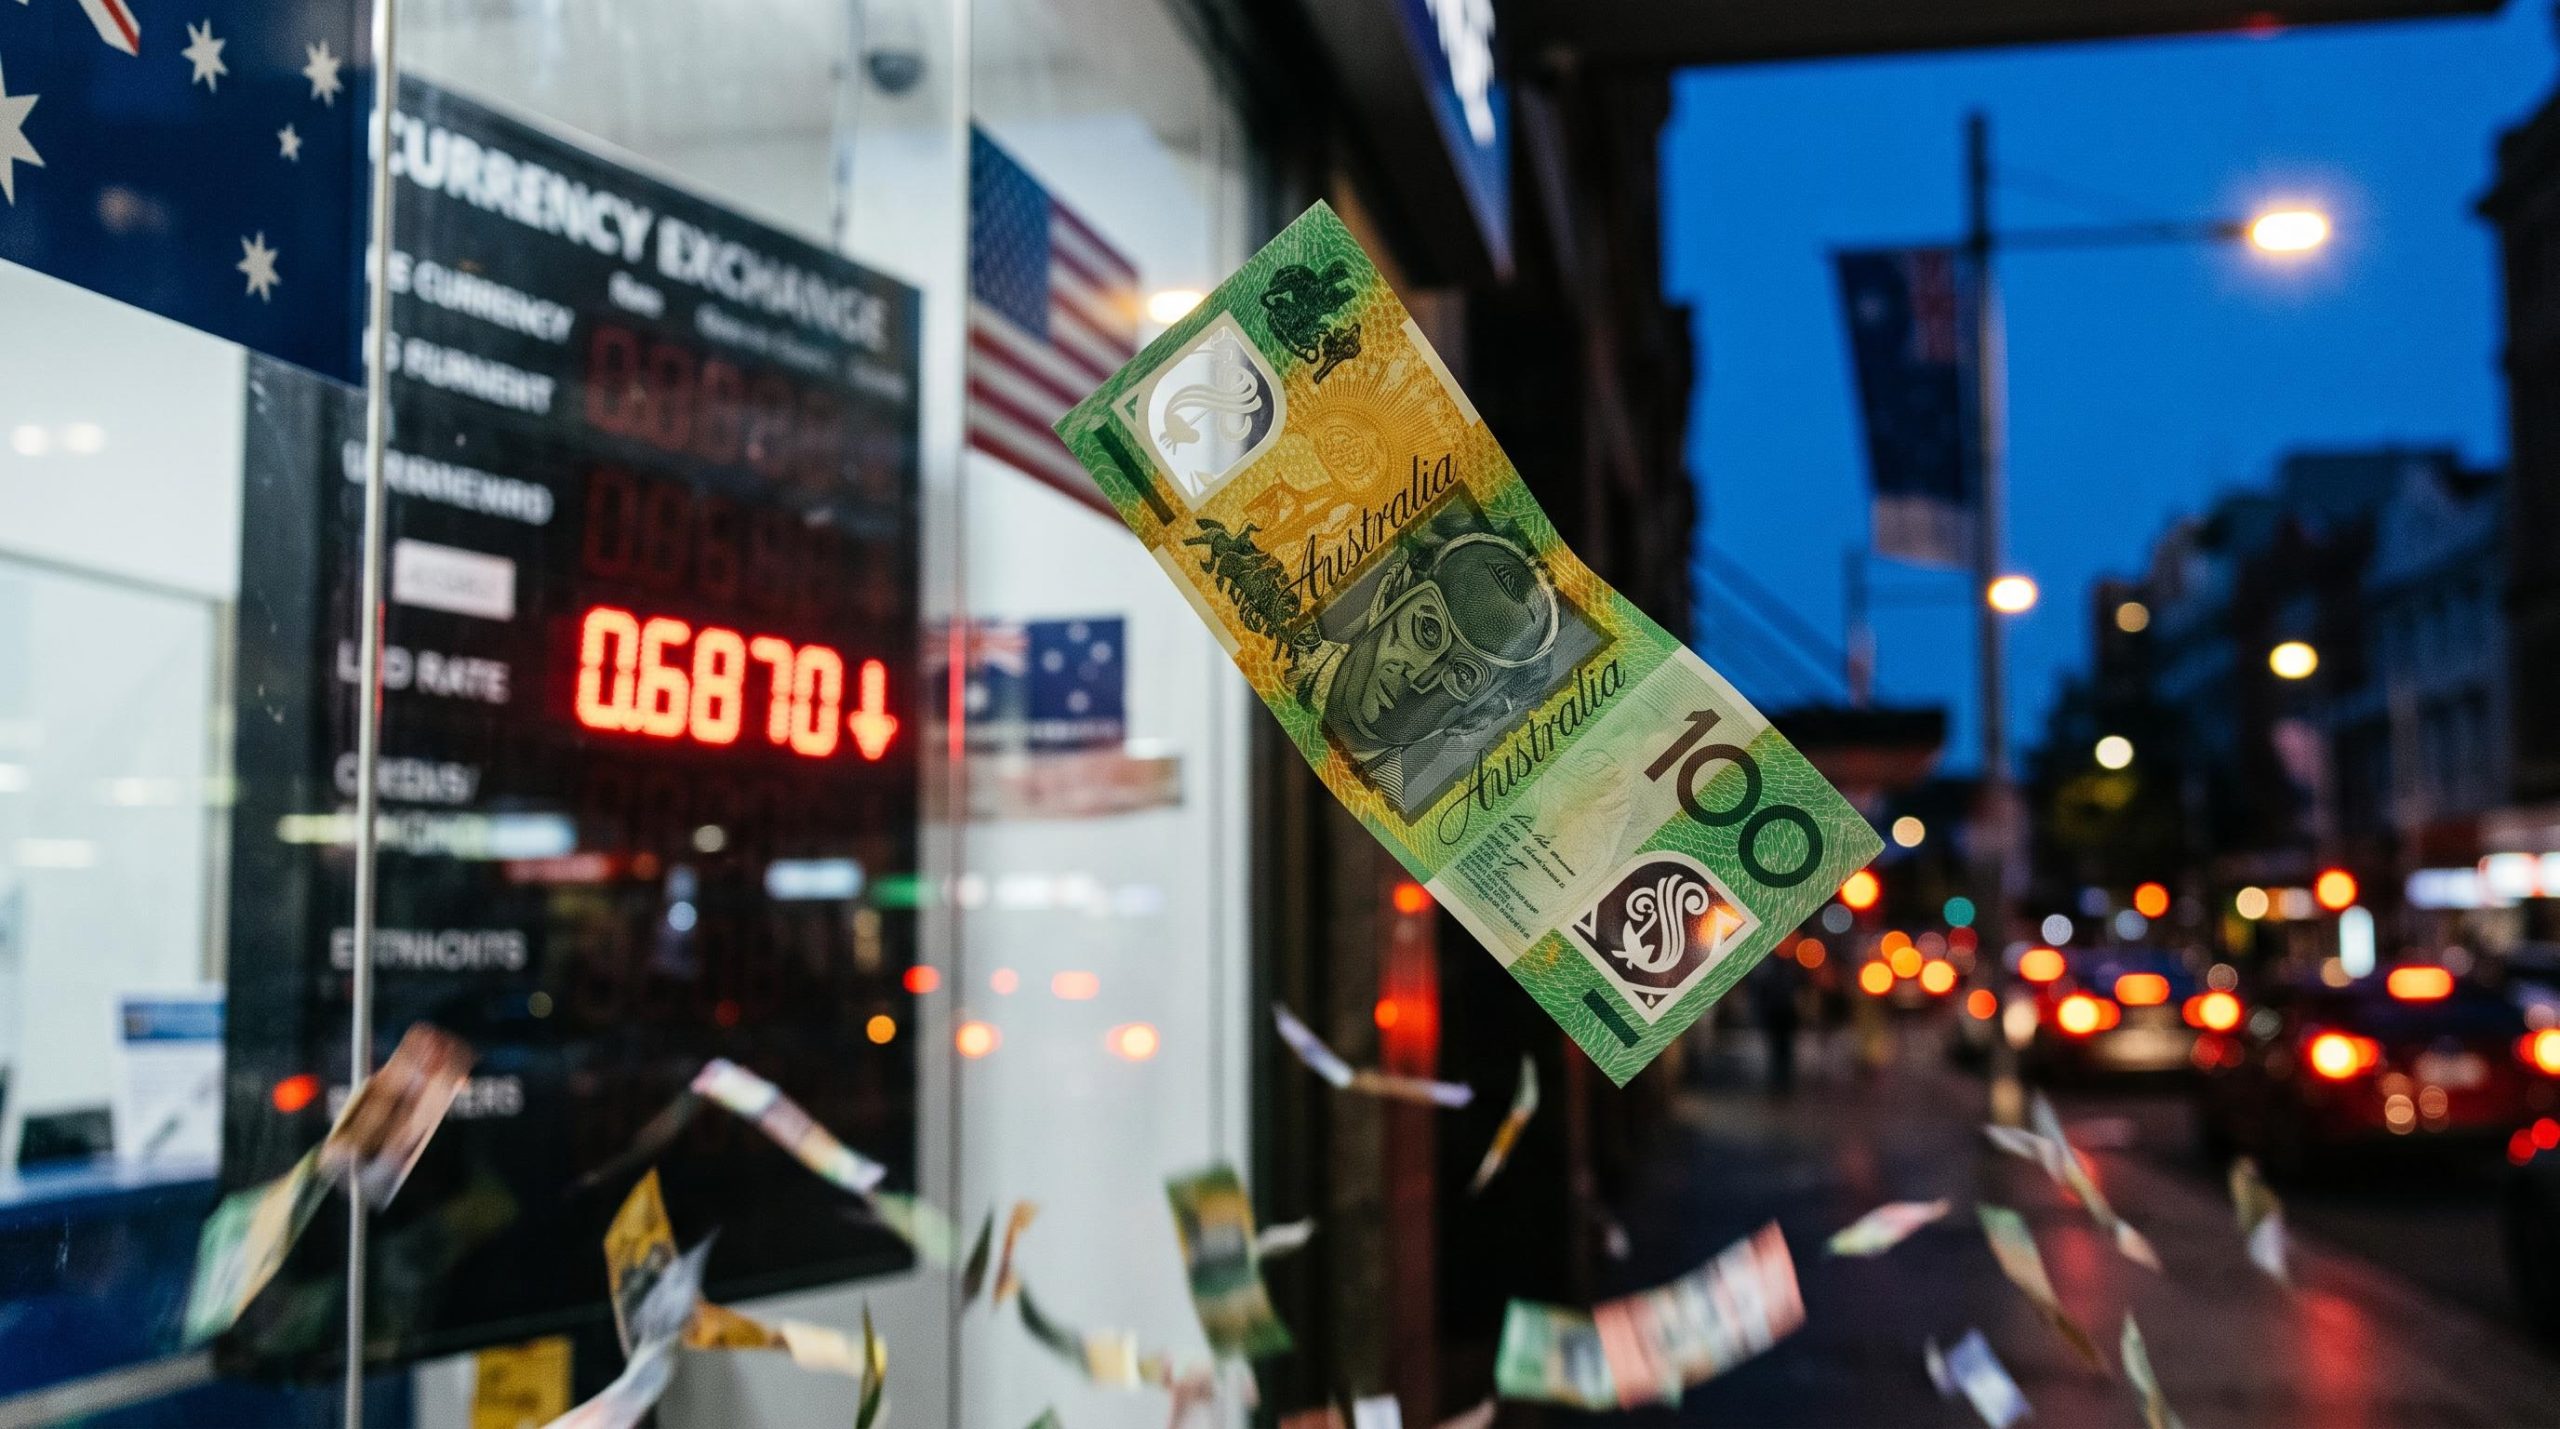
The Australian dollar fell about 0.88% yesterday, Tuesday 10 November 2026, slipping below 0.6900 to trade near 0.6870 after US inflation data came in hotter than expected. The move has redrawn the near-term AUD/USD forecast, as traders priced in a faster pace of US rate rises.
US core consumer price index (CPI) inflation rose 0.3% in October, ahead of the 0.2% consensus. Within hours, Federal Reserve Governor Christopher Waller raised the prospect of a 50 basis point December hike. A basis point is one hundredth of a percentage point, so 50 bp equals 0.5%.
That matters if you hold Australian assets, earn in US dollars or trade the pair. Blaming the slide on Australia, when Washington is doing most of the work, can lead you to watch the wrong data.
Here is how the inflation print, the Fed rhetoric and the chart fit together, and which price levels now carry the most weight.
Why a hot CPI print and a 50 bp hint hit the Aussie dollar
The data
The US Bureau of Labor Statistics reported that headline CPI rose 0.4% in October, against expectations of 0.3%. That was slower than September’s 0.6%, but it still beat forecasts.
Core CPI strips out volatile food and energy prices. It rose 0.3%, matching September and marking a third straight month at that pace.
That run is the real problem: underlying price pressure has stopped easing.
The Fed response
Waller moved first and went furthest. He had said in advance that a core reading of 0.3% or higher would justify a stronger response, and the data delivered exactly that.
“In that case, I believe a 50 basis point hike in the policy rate should be considered at the December meeting,” said Christopher Waller, Federal Reserve Governor.
He also argued that a 25 bp move alone could damage the Fed’s credibility. Other officials followed:
- Christopher Waller (Governor): a 50 bp December hike should be considered.
- Lorie Logan (Dallas Fed): it “may be possible to move more rapidly” than the quarter-point hike in September.
- Jeffrey Schmid (Kansas City Fed): inflation is “top of mind” and policy is “fairly accommodative.”
- Michelle Bowman (Vice Chair for Supervision): there is still work to do, though she expects core PCE inflation to move closer to 2% next year after an estimated 3.3% in October.
The CME FedWatch tool converts futures prices into rate-move probabilities. It now shows a 25 bp December hike as 100% priced. The odds of 50 bp jumped from near zero to roughly 10-11.8%, depending on the source: TMGM reported 10%, CNBC 11% and Reuters-linked coverage 11.8%.
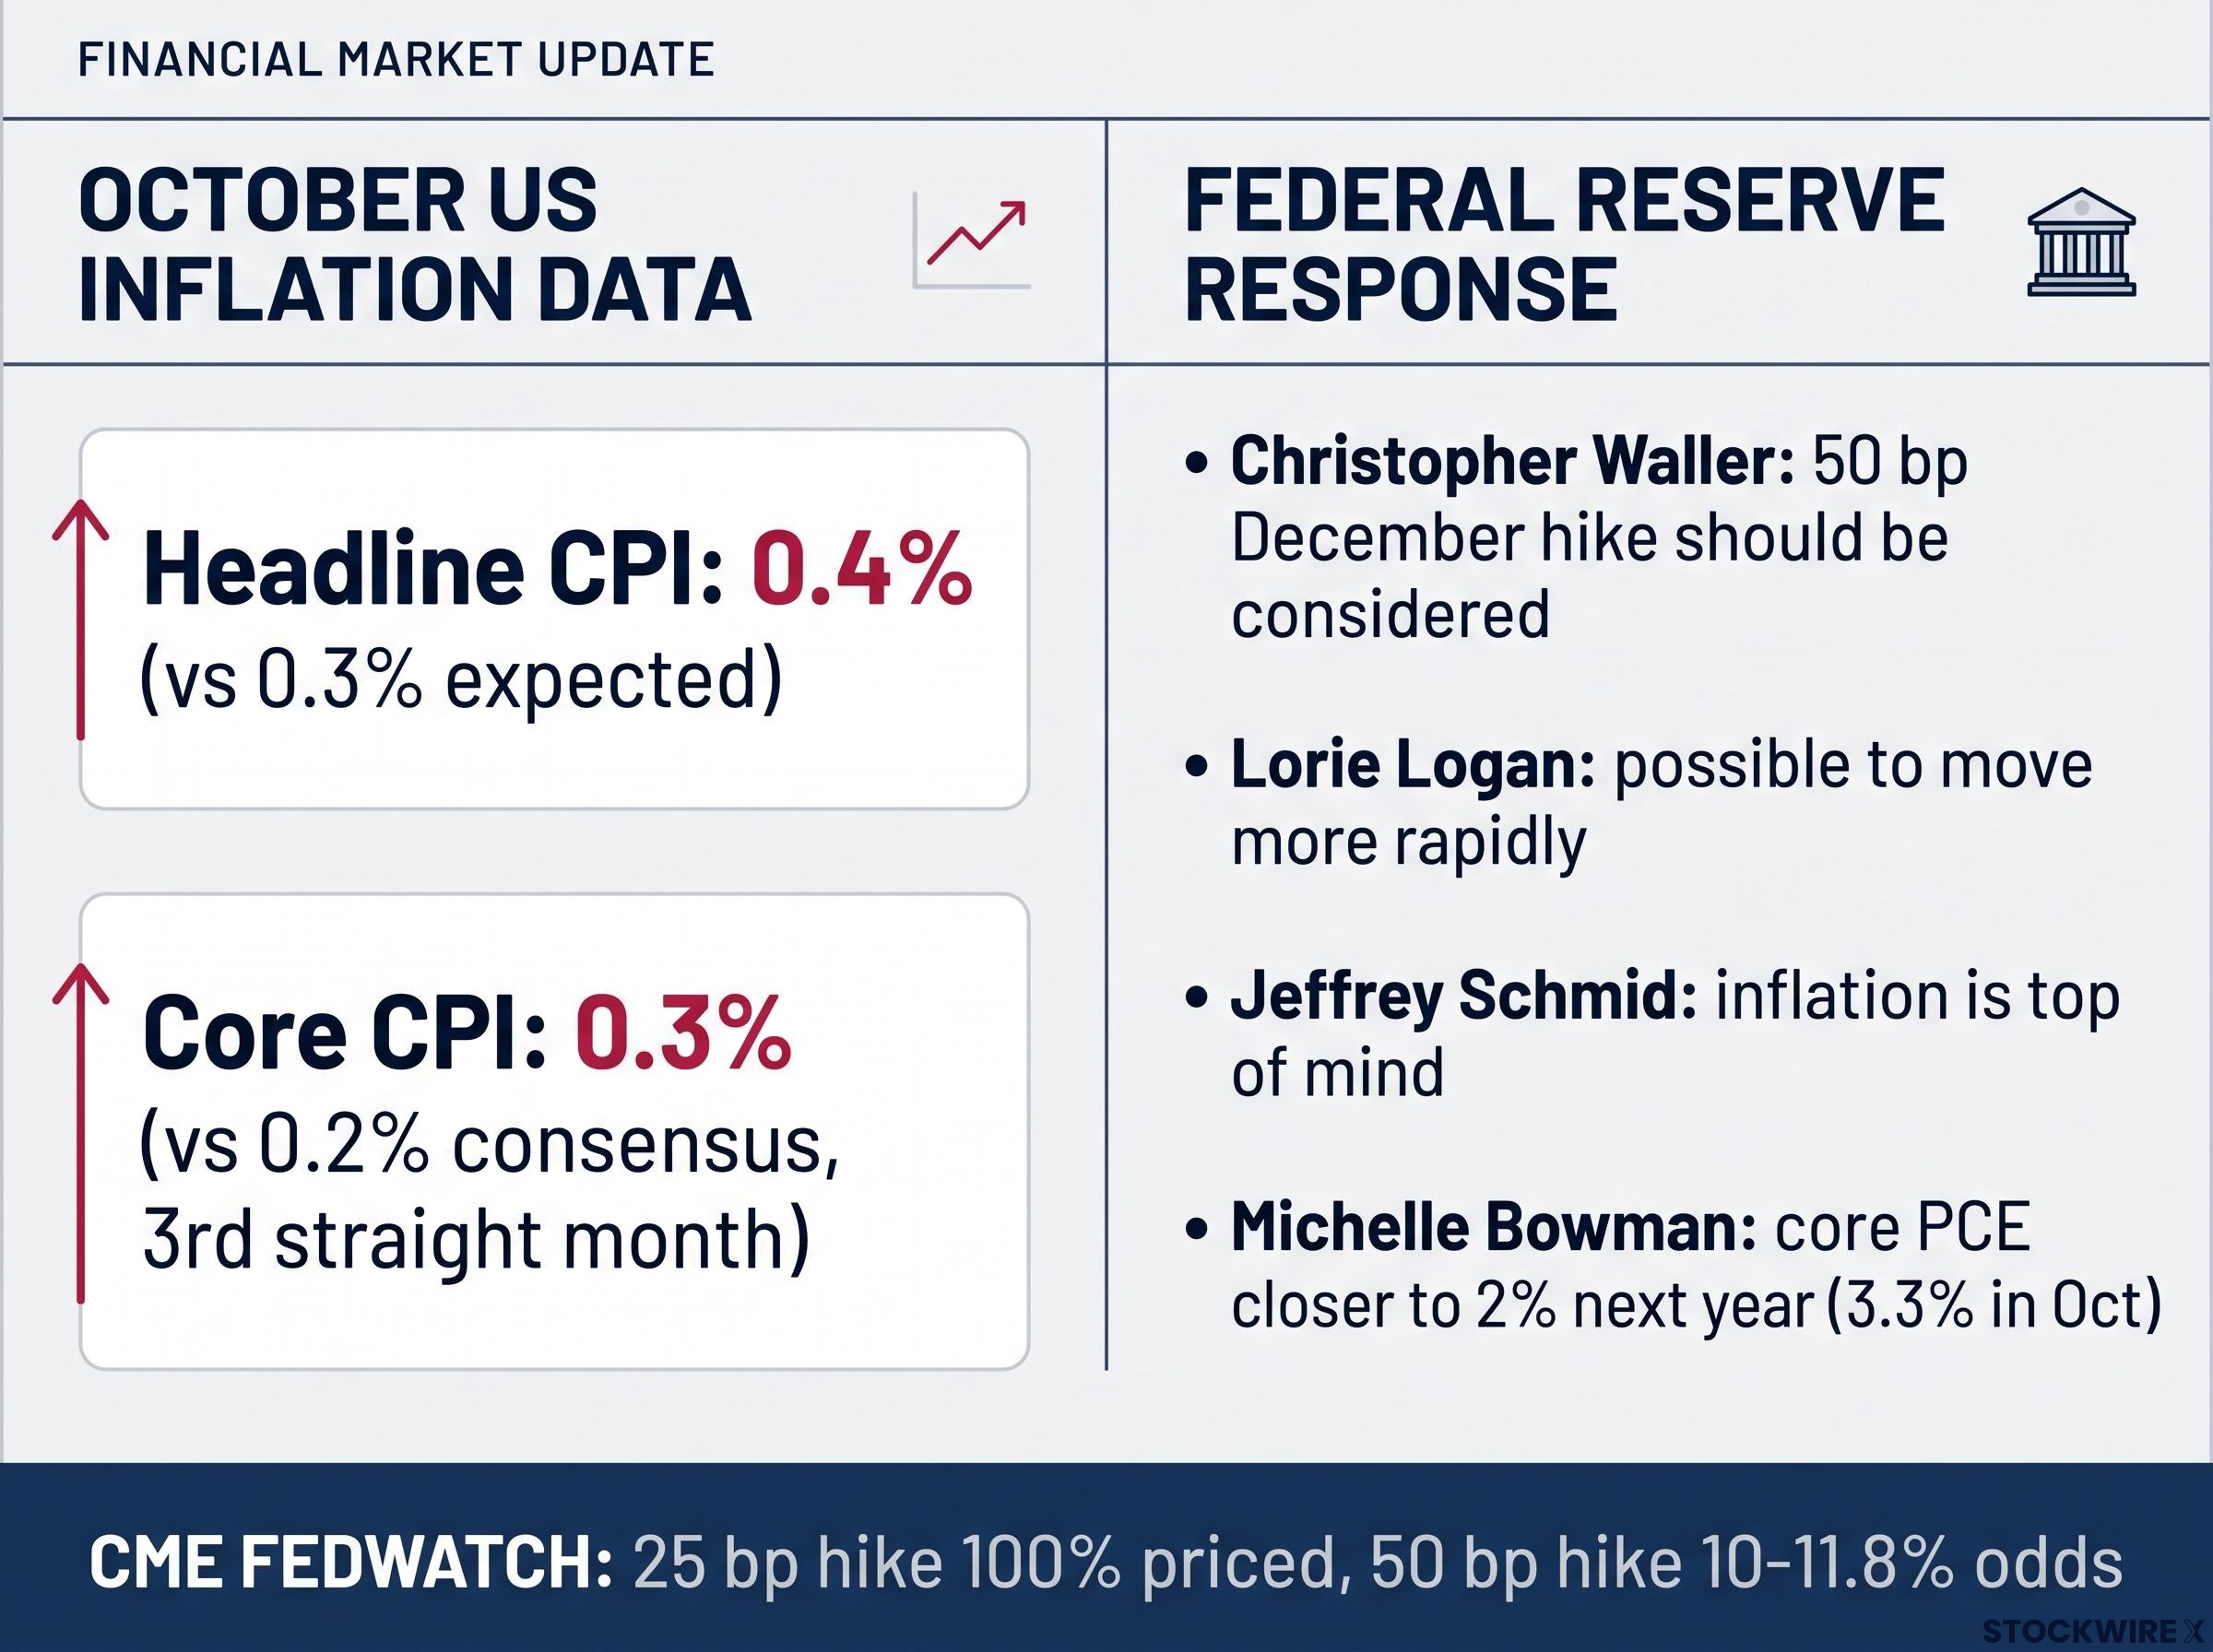
Headline CPI rose 0.4% and Core CPI 0.3%, driving CME FedWatch odds for a 25 bp hike to 100% and a 50 bp hike to 10-11.8%.
One in ten is still a minority outcome. However, the pair is now trading the risk of a larger Fed move, not just a routine one, and that keeps steady demand for the US dollar.
Strong October payrolls had already lifted December Fed hike odds before the inflation print, and the supply-driven nature of the price pressure means a rate rise cannot easily fix its source.
Weak Australian sentiment and a hawkish RBA limit the Aussie’s defences
On paper, Australia has its own defence. On 3 November, the Reserve Bank of Australia lifted the cash rate 25 bp to 4.85%, an 18-year high, by a 6-3 vote. Its projections implied a further 35 bp by mid-2027.
Higher Australian rates should help hold up the currency. Australian households, though, are showing strain.
RBA forward guidance can shift terminal rate pricing by up to 25 bp on the futures curve, which is why the Australian side of the pair reacts to Governor Bullock’s wording as much as to the cash rate itself.
Consumer sentiment at a four-year low The Westpac-Melbourne Institute index fell 2.7% to 78.2 in November, down from 80.4.
Westpac pointed to several causes:
- Petrol prices near $2.40 per litre
- Persistent cost-of-living pressure
- The recent RBA hike
- Worry about further mortgage rate rises
- Weaker economic and household outlooks
Among respondents surveyed after the decision, 72% expect mortgage rates to rise again within 12 months. That gloom may limit how far the RBA can go.
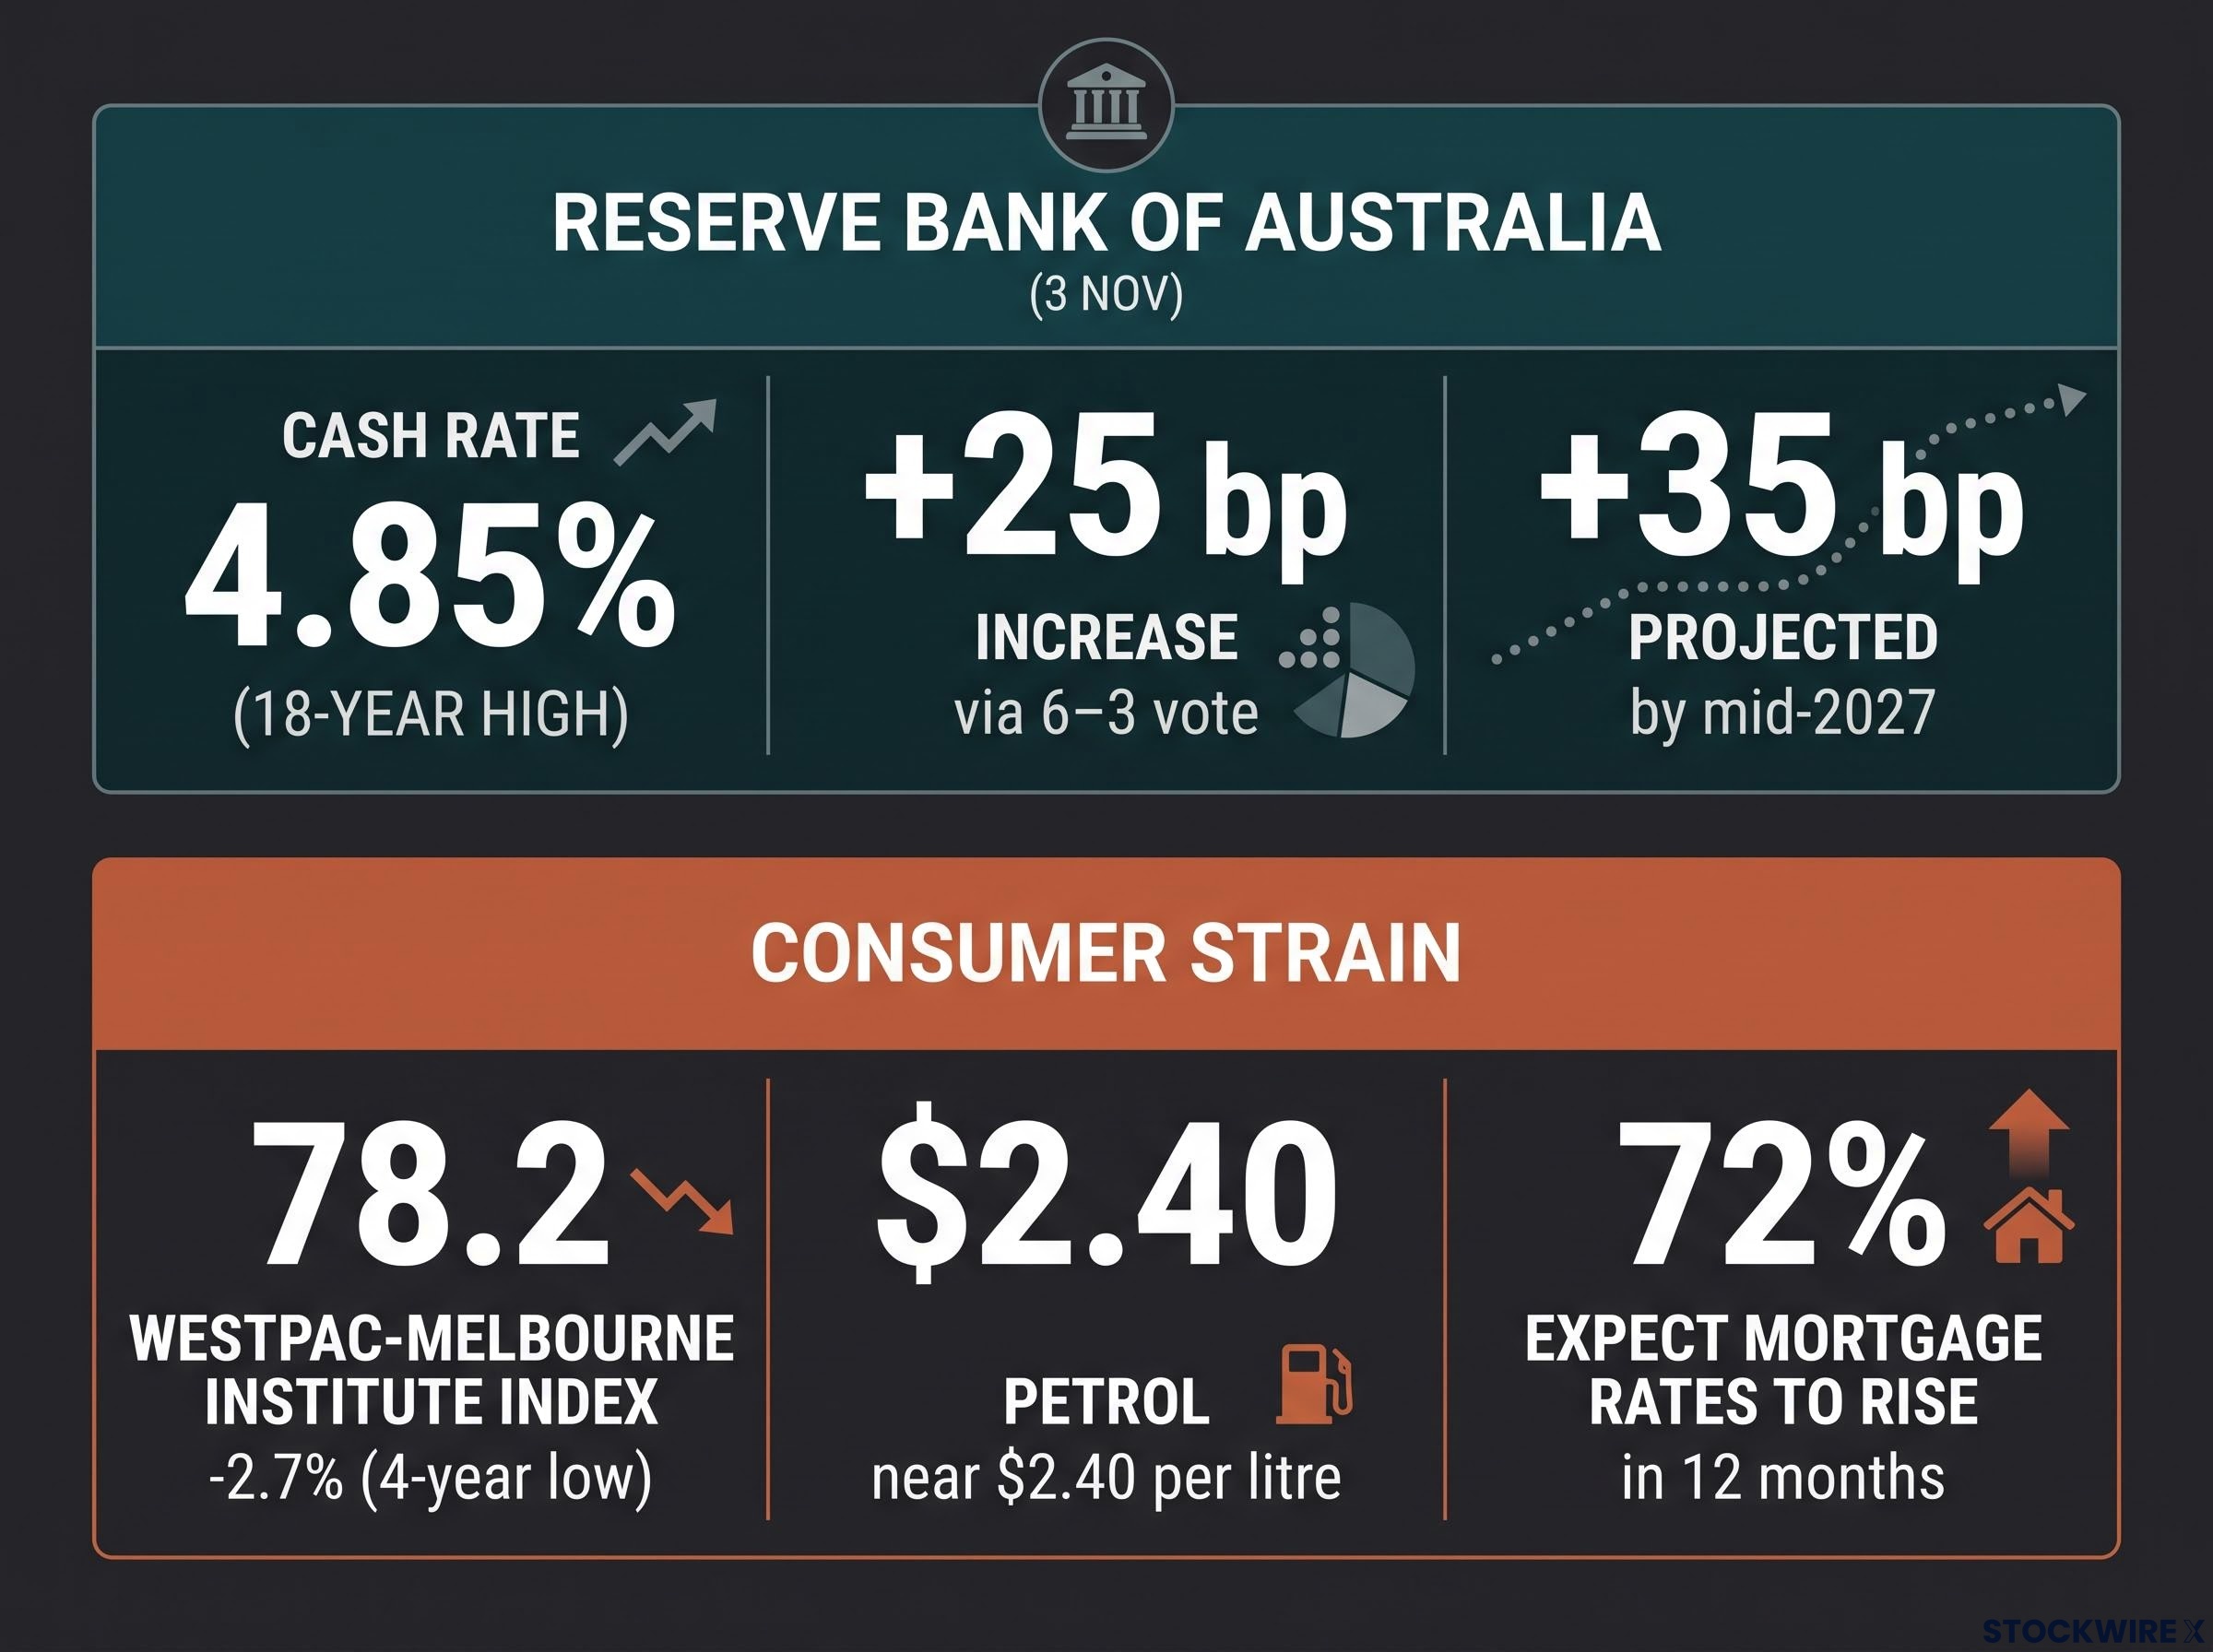
The Reserve Bank of Australia raised the cash rate to 4.85%, while the Westpac-Melbourne Institute Index fell to 78.2.
Before the CPI release, ING suggested a 25 bp RBA hike could lift AUD/USD toward 0.71, but said a hawkish Fed made 0.72 unlikely near term. That view has not been independently confirmed.
The Aussie also tends to weaken when tighter US policy dampens appetite for currencies tied to China and commodities. For you, the result is a currency squeezed from both sides: US rates pull capital toward the dollar while Australian households cut back.
Where AUD/USD forecast levels sit: the chart levels traders are watching
At 0.6870, the pair sits below the cluster of its 50-, 100- and 200-day moving averages near 0.7034-0.7040. A moving average is the average closing price over a set number of days. The pair is also below a descending trend line from near 0.8015.
The relative strength index, or RSI(14), measures momentum on a 0-100 scale. It sits near 37, which signals weak momentum without the pair being deeply oversold.
| Level | Role | Type |
|---|---|---|
| 0.7198 | Distant horizontal resistance | Resistance |
| 0.7034-0.7040 | Moving-average cluster | Resistance |
| 0.6897 | Trend-line pivot | Resistance |
| 0.6865 | Rising trend line, near June low | Support |
| 0.6833-0.6835 | Prior low, trend-line floor | Support |
| 0.6673 | Longer-term rising trend line | Support |
Support
0.6865 is the first floor and 0.6833 the second. Together, these levels separate a pause from a deeper decline. A decisive break below both would open the way toward 0.6673.
ActionForex cites about 0.6854 and 0.6723 as projection targets, and notes that the move could also be a correction within the broader rise from around 0.5913. Neither view has been independently confirmed.
Resistance
A rebound first meets 0.6897, then the moving averages near 0.7040, with 0.7198 further out. The descending trend line caps rallies along the way.
Treat these levels as a map, not a prediction. The indicators are backward-looking, and Fed communications, US data, China news or commodity swings could overturn them. The source’s technical read was also AI-assisted.
What would change the picture from here
Three forces now steer the pair: firm US inflation and rising Fed pricing, a strained Australian household sector, and a chart that leans lower.
The December Fed meeting is the main decision point. If the odds of a 50 bp hike keep climbing, dollar strength is likely to persist. Softer US inflation or jobs data could cap that strength, and a drop in oil prices or firmer Chinese demand could give the Aussie room to recover.
Defensive portfolio positioning during Fed hiking cycles typically means shorter bond duration, a tilt toward quality large caps over high-beta tech, and tactical cash reserves held for flexibility.
In practical terms, watch 0.6865 and 0.6833 on the downside and 0.6897 on any rebound, and treat any forecast as conditional on the next data release.
Past performance does not guarantee future results. Financial projections are subject to market conditions and various risk factors.
This article is for informational purposes only and should not be considered financial advice. Investors should conduct their own research and consult with financial professionals before making investment decisions.