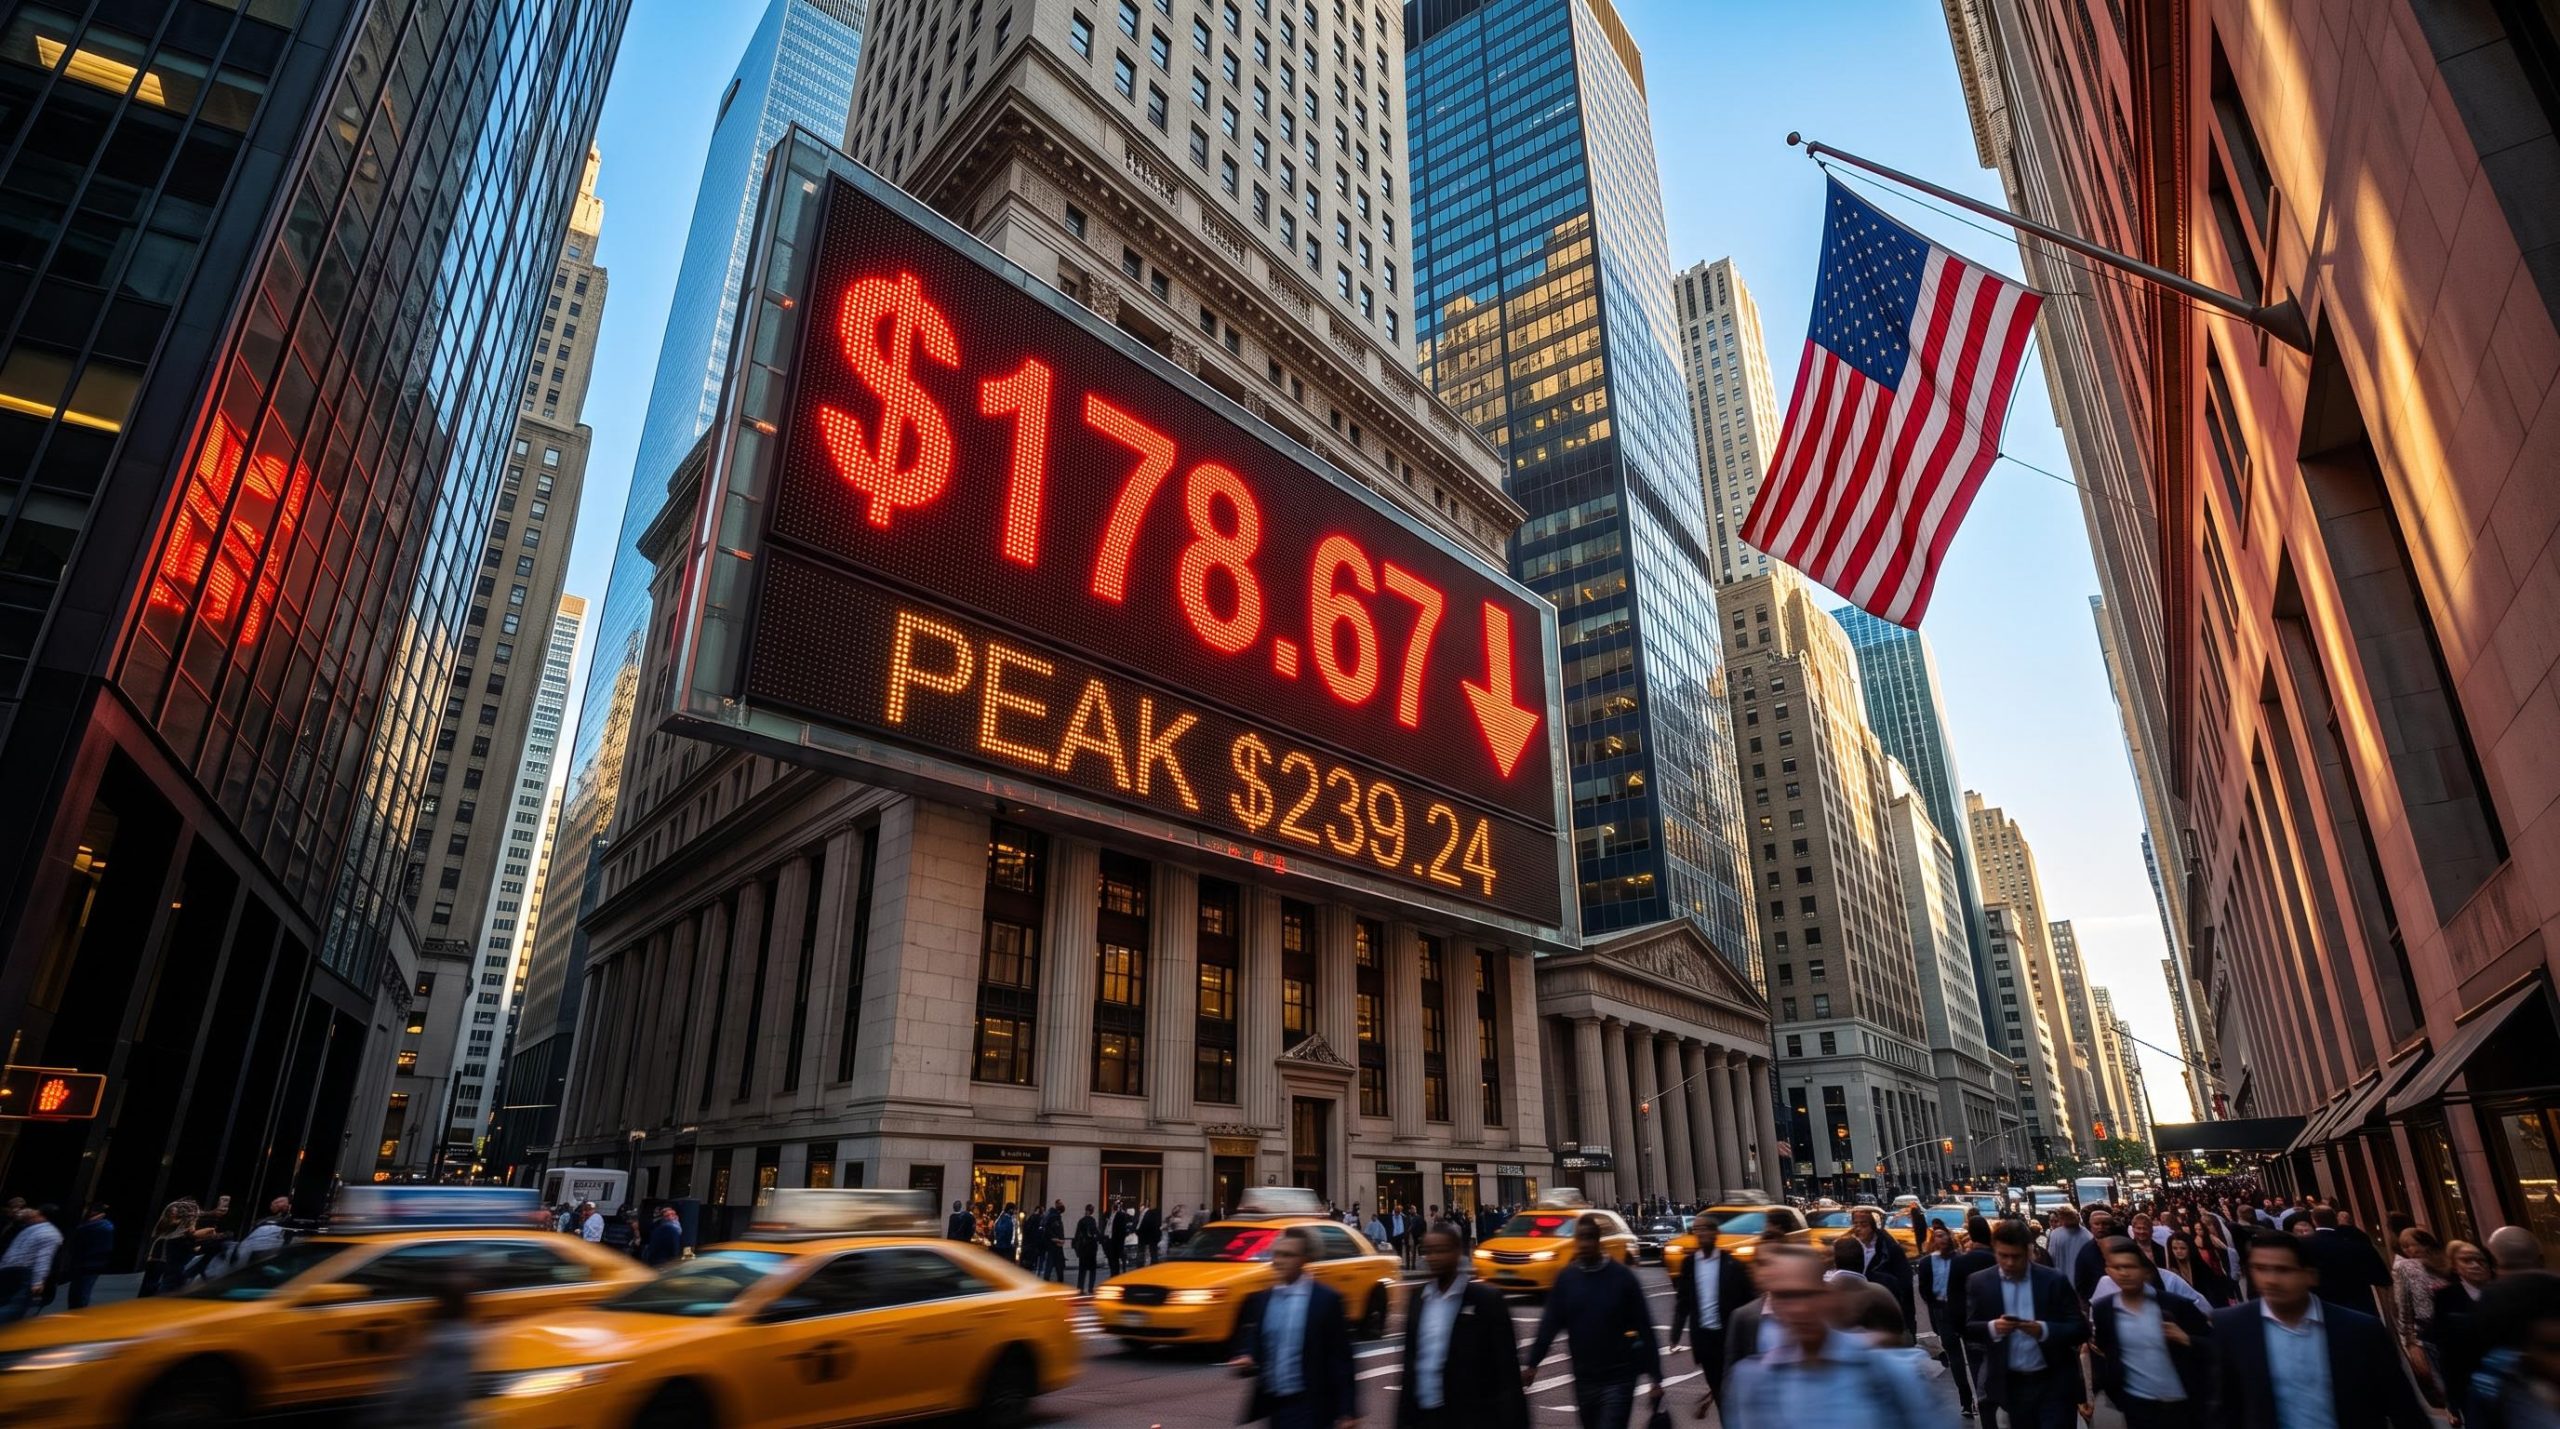
Nvidia closed at $178.67 on 9 November, roughly a quarter below its 6 October record close of $239.24. The fall came straight after Wall Street’s worst week since April 2025, and it places the chipmaker at the centre of a market selloff that has wiped about $1.47 trillion from its market value.
Two forces hit at once. Democrats won control of both chambers of Congress in the midterms, and doubts are growing over whether the enormous sums spent on artificial intelligence (AI) will ever earn an adequate return.
Australia went the other way. The local market rose over the same week.
Here is how to separate the headline shock from the slower question underneath it, and how long-term investors can respond without reacting to every price swing.
How hard did US markets fall, and where did Nvidia sit in the damage?
The S&P 500 fell about 2.68% in the week ended 6 November, and the Nasdaq dropped about 3.4%. For both indices, it was the weakest week since the April 2025 tariff selloff.
Thursday did most of the damage. On 5 November the S&P 500 lost 4.36% and the Nasdaq about 5.5%, their worst sessions since the “Liberation Day” rout of April 2025.
| Index | Weekly move (to 6 November) | 6 November level |
|---|---|---|
| S&P 500 | -2.68% | 7,376.86 |
| Nasdaq Composite | About -3.4% | About 24,579 |
| Dow Jones Industrial Average | -0.94% | 51,285.73 |
The Dow’s smaller fall tells you where the damage concentrated: AI and technology exposure. Your own risk depends on how much of your portfolio sits there.
Nvidia was the focal point, and its path shows how fragile any recovery was:
- 5 November: down about 9.3% to $181.60
- 6 November: up 2.78% to $186.64
- 9 November: closed at $178.67, down 4.27% on the day
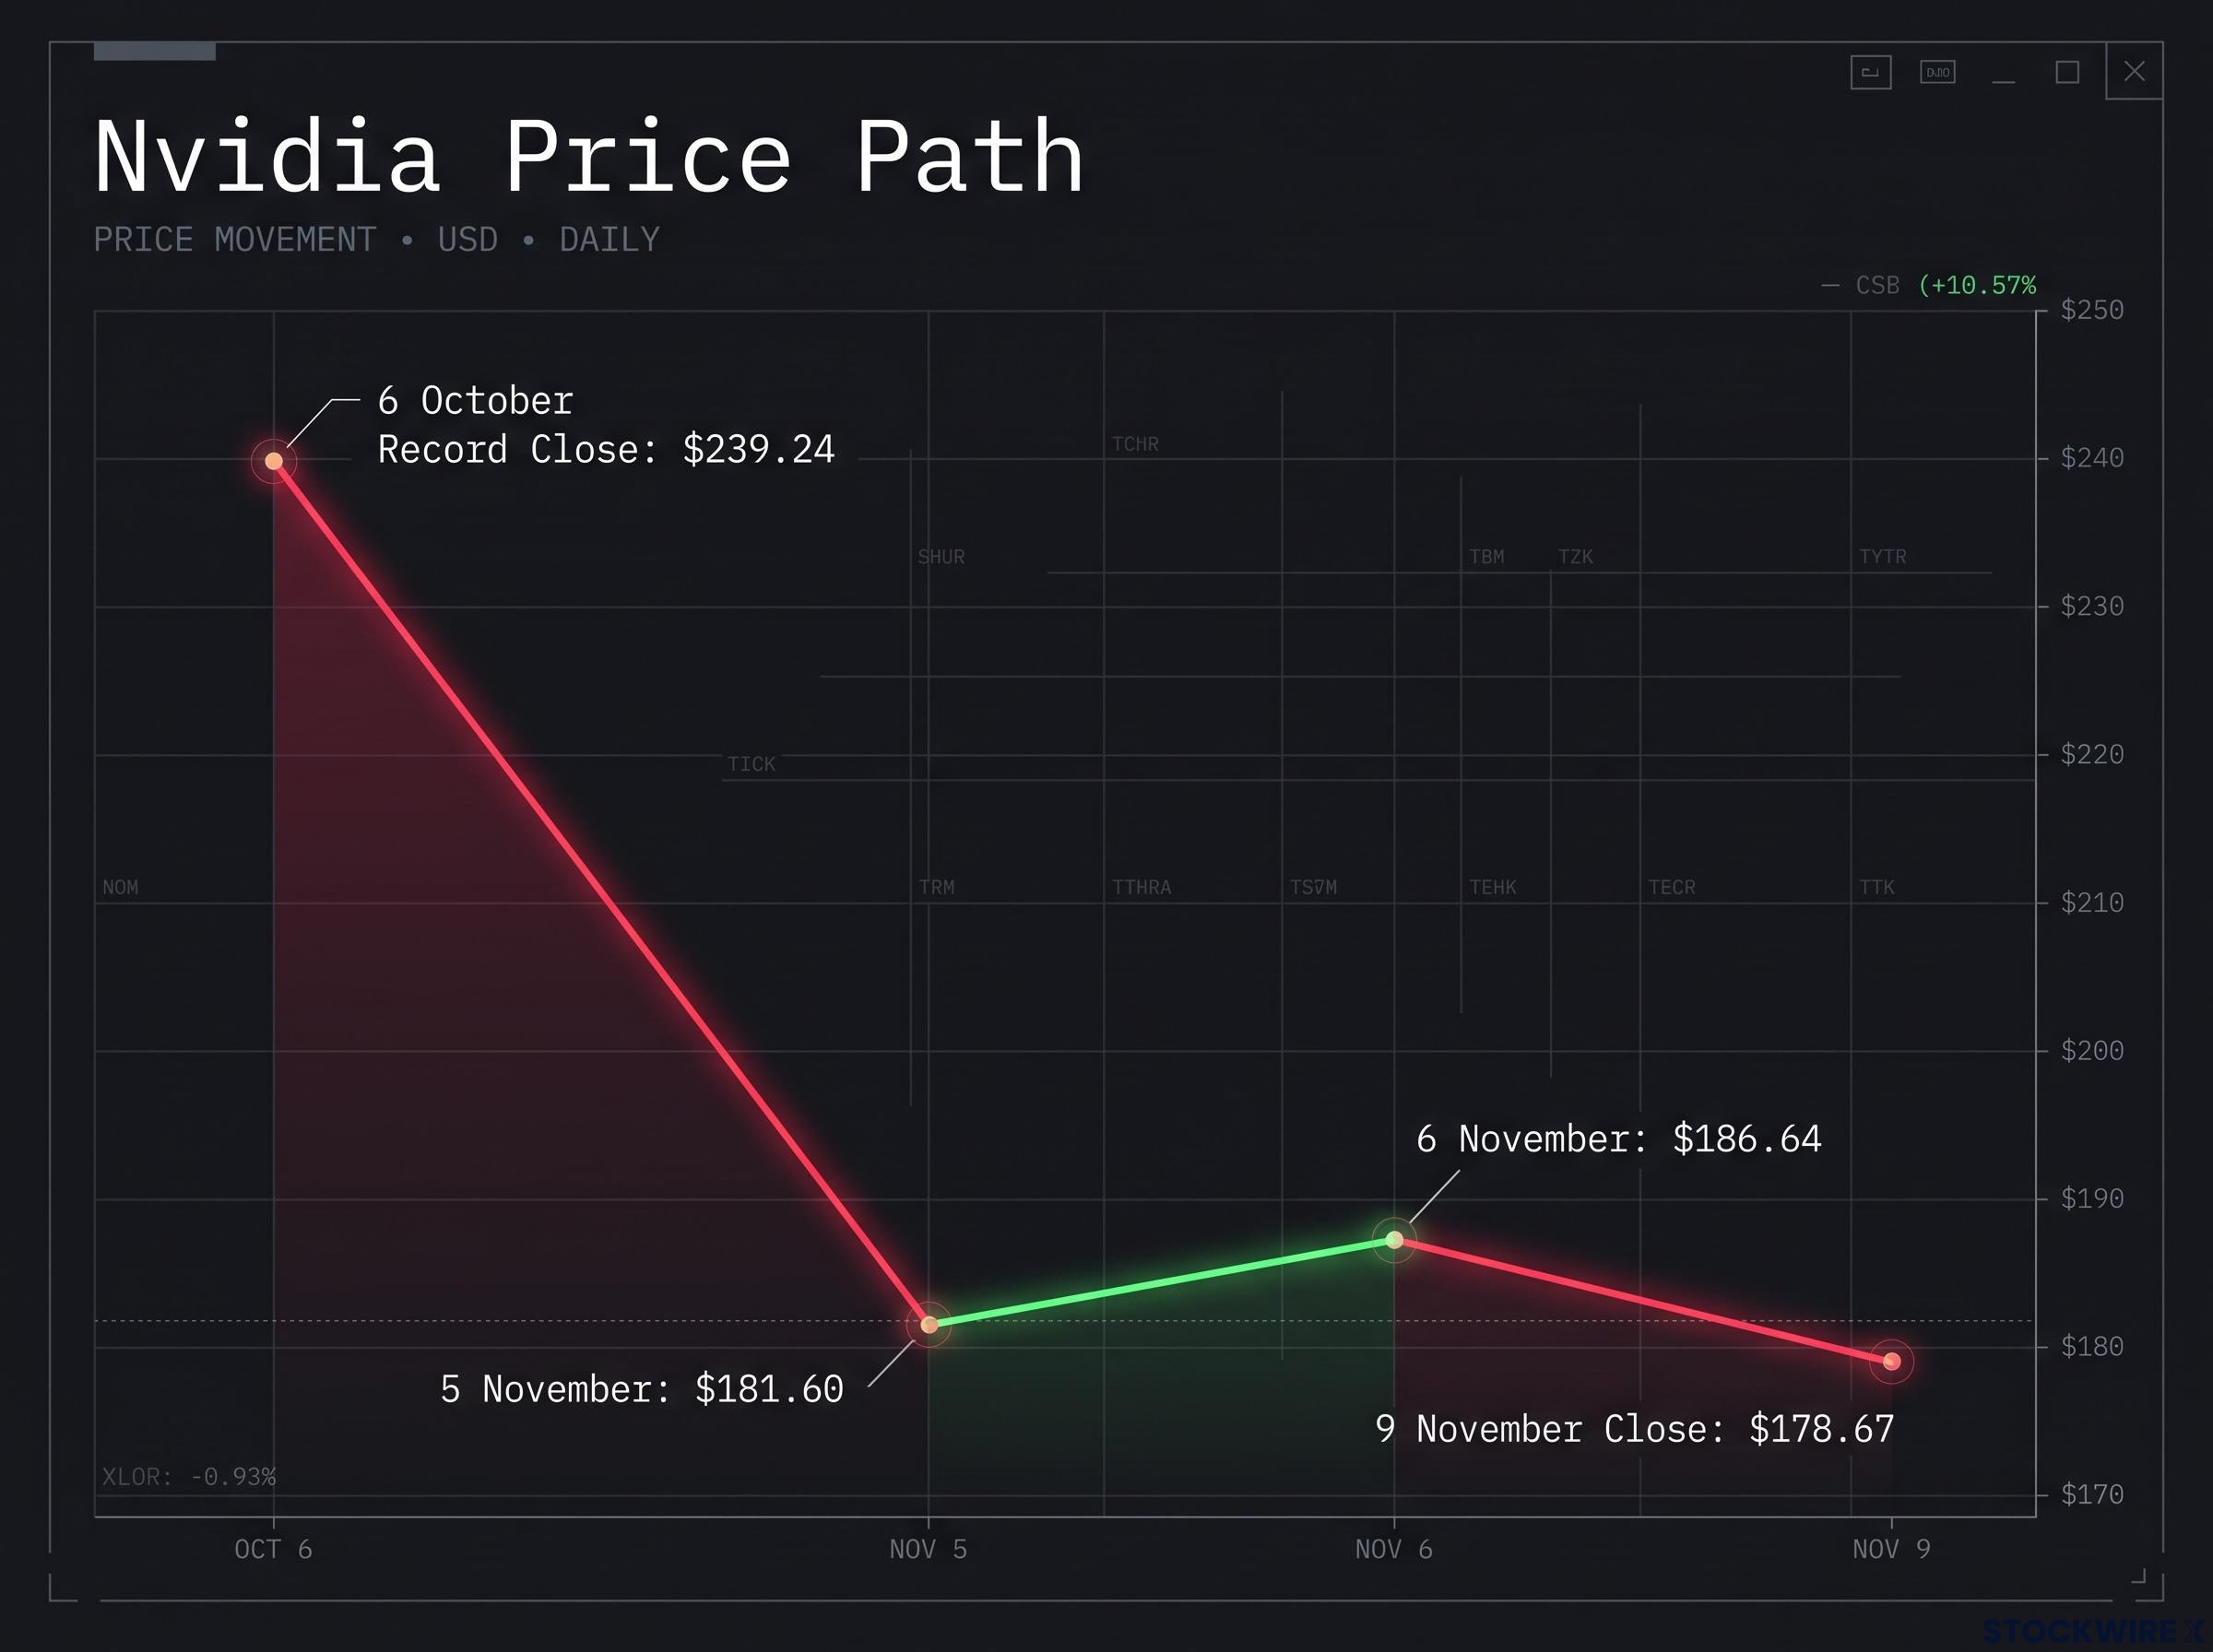
Nvidia’s stock experienced significant volatility, falling from a 6 October record close of $239.24 down to $178.67 by 9 November.
Reported declines vary. On a closing basis the fall from the peak is about 25.3%, while the roughly 27% figure reflects intraday lows and SBS cited about 22%. Morningstar’s Bryce Anderson reported the stock “fell more than 6%” on 9 November, which is likely an intraday measure. The 10 November close is not yet available.
Two catalysts, one compounding effect
Democrats won the House and Senate, giving them unified control of Congress from January 2027. Investors fear tighter AI regulation, limits on data-centre construction and more scrutiny of big tech. Senate tallies differ as races are called: NPR showed 52 Democrats plus two aligned independents, while the BBC’s later count put Democrats at 54.
Then came the Jensen Huang story. The New York Times reported that Nvidia’s chief executive acknowledged a relationship with an executive whom US intelligence reportedly believed was gathering information for China, and Nvidia opened an investigation. The selling was already under way; the allegation compounded it.
The board’s independent investigation examines whether Huang was targeted by a foreign-intelligence effort, and no wrongdoing has been found so far; any succession disclosure may weigh more on sentiment than the verdict itself.
When big ASX news breaks, our subscribers know first
Is this a correction or a re-rating? The AI returns question behind the selloff
The election explains the speed of the fall. It does not explain whether prices have further to go.
The harder issue is timing. The hyperscalers (the giant cloud operators) are spending heavily now, while the returns may arrive later or fall short.
Morningstar DBRS, in analysis dated 4 November 2026 covering Amazon, Meta, Alphabet and Microsoft, put the arithmetic starkly.
The capex squeeze AI-related capital spending could reach 80-100% or more of EBITDA through 2028, while incremental EBITDA may remain only 20-40% of prior-year capex, according to Morningstar DBRS.
UBS estimates hyperscaler capex at about US$940 billion in 2026 and US$1.3 trillion in 2027. J.P. Morgan sees funding shifting toward debt and equity issuance, though it still expects operating cash flow above US$900 billion by 2027.
PIMCO estimates that hyperscaler capex absorbs 93-94% of operating cash flow, up from 33-40% in 2022-2023, leaving little room for buybacks, dividends or financial flexibility.
Anderson said the AI ecosystem had been viewed optimistically, and that concerns about returns and financing have now surfaced. The bear case runs in six steps:
- Hyperscalers raise capex.
- Free cash flow falls.
- Debt, leases and structured finance fill the gap.
- AI labs and customers use that capital to buy cloud capacity and chips.
- If end-user revenue disappoints, growth slows while depreciation and interest costs remain.
- Returns fall, leverage rises and valuations adjust.
| Interpretation | Supporting argument | Key caveat |
|---|---|---|
| Short-term correction | Crowded, richly valued shares hit by political and company shocks | Debt-funded capex could keep pushing multiples lower |
| Super-cycle | Strong accelerator demand; J.P. Morgan sees cash flow above US$900B by 2027 | Chip demand is not the same as a return on the whole buildout |
| Structural re-rating | Capex of 80-100%+ of EBITDA may erode cash flow for years | Lower multiples need not mean the end of AI growth |
| Circular-financing risk | Linked deals can inflate apparent demand | The test is independent end-demand that earns its keep |
The point for you: strong chip demand and an adequate return on the AI buildout are different things. Nvidia’s sales strength alone does not settle whether prices have further to fall.
What circular financing means
Circular financing is when chipmakers invest in AI labs, the labs sign compute contracts with cloud providers, and the cloud providers buy the chips. ROIC (return on invested capital) measures profit earned on money put into a business. Capex-to-EBITDA compares capital spending with earnings before interest, taxes, depreciation and amortisation.
Circularity is not necessarily fraudulent. The question is how much revenue comes from independent customers earning adequate returns.
Why Australia held up, and why that is only half the story
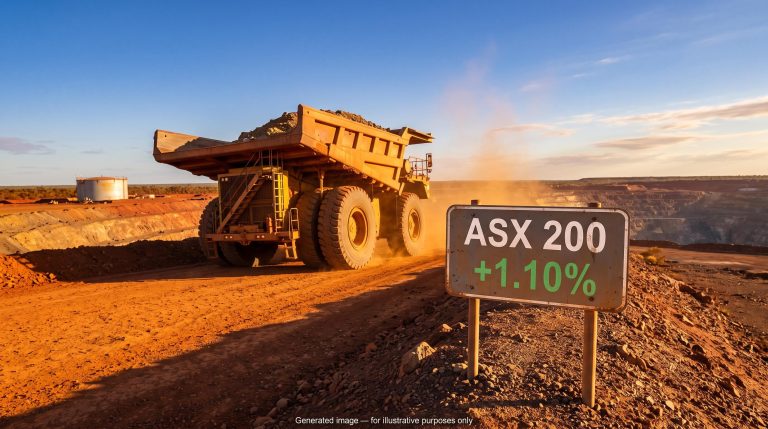
While Wall Street fell, the ASX 200 rose 0.9% on 9 November and about 1.3% over the week, according to Raiz Invest.
The reason is composition. The local market leans on banks, resources and mature dividend payers, with few AI names. Moomoo chief market strategist Tapas Strickland said that lack of advanced-technology exposure makes Australia relatively more attractive as global investors reassess AI stocks.
Even with few AI names listed, Australia’s data centre build-out carries its own risk, with construction that could approach $150 billion by 2030 raising the prospect of localised oversupply.
The pressure under the surface
On 3 November, the Reserve Bank of Australia (RBA) lifted the cash rate 25 basis points to 4.85%. Six board members voted for the hike and three voted to hold at 4.60%. The RBA flagged:
- Elevated, broad-based inflation
- The risk of inflation expectations becoming embedded
- Higher rates, falling housing prices and weaker turnover weighing on household spending
Anderson noted consumers have now absorbed five rate increases.
David Jones shows what that looks like on the high street. The department store entered voluntary administration and receivership after falling behind on rent, with McGrathNicol appointed administrator. It continues trading, but thousands of jobs are reported to be at risk.
For you, owning a less AI-heavy market lowers exposure to this particular shock without removing rate and consumer risk. Judge diversification on what drives returns, not just on geography.
How should long-term investors respond when AI stocks fall?
Anderson’s guidance on 10 November was blunt about the noise.
On volatility Market noise is constant, and volatility is the necessary cost of long-term returns, according to Morningstar’s Bryce Anderson. He urged investors to focus on cash flows and their valuation rather than price moves.
His reasoning is that long-term fair values change little while prices swing, so declines can create opportunities. He noted attention turning to hyperscalers such as Amazon and Alphabet, but with caution.
Morningstar DBRS suggests judging Amazon, Alphabet, Microsoft and Meta on whether capex generates enough extra earnings and free cash flow. Cash-rich, self-funded players can absorb delays better; debt-dependent projects face interest, refinancing and utilisation risk.
A practical checklist after a price drop:
- Separate the measures. Look at revenue growth, accounting earnings, free cash flow, ROIC and returns after financing costs individually.
- Check the funding mix. Is capex paid from operating cash flow or from new debt?
- Watch credit metrics. Rising leverage is an early warning.
- Test end-demand. How much revenue comes from independent customers?
- Revisit your fair value. Has the cash-flow story changed, or only the price?
What this means for you is that a falling price is a prompt to re-check assumptions, not a verdict. Buying after a drop only makes sense where those assumptions still hold.
What the selloff changes for long-term investors, and what to watch next
The political shock accelerated the fall. The AI return and financing question will decide how lasting it is.
The signals worth tracking are hyperscaler capex and its funding mix, free cash flow and credit metrics, and evidence of independent end-demand. Nvidia’s investigation outcome and the RBA’s next decision also matter for the US and Australian sides of this story.
Demand durability is harder to read where AI labs use consumption-based billing, because annualised run-rate figures are more sensitive to demand normalisation than contracted software revenue.
Nvidia’s 10 November close was not available at the time of writing. These views are speculative and subject to change based on market developments and company performance.
This article is for informational purposes only and should not be considered financial advice. Investors should conduct their own research and consult with financial professionals before making investment decisions.