
When Datadog dropped roughly 14% after earnings, traders holding short-dated puts should have been celebrating. Instead, many of those puts lost most of their value overnight, even though the stock fell exactly as they had bet.
That outcome comes from implied volatility crush, the rapid collapse in option prices once an earnings report removes the uncertainty traders were paying for. Before results land, option prices carry a premium for the unknown. When the numbers are out, that premium disappears almost immediately.
Most traders watch Delta, the Greek that tracks how an option responds to the stock’s price. Vega gets far less attention, yet around earnings it often decides whether a trade makes money.
After reading this, you will know how to convert Vega into a dollar figure, how to read the net change column on your platform, and how to tell whether a stock’s move is large enough to beat the premium you paid before the report.
What Vega measures and why it can outrank Delta around earnings
You probably already think about options through Delta. Delta is the expected change in an option’s price for a $1 move in the stock, all else equal. Call Delta runs from 0 to +1, put Delta from 0 to -1, and at-the-money options usually sit near ±0.50.
On an ordinary trading day, Delta is the main driver. Mike Butler of tastytrade ranks Vega as the second most influential Greek after Delta, and he notes it can become the most influential around binary events such as earnings reports or elections.
Vega measures how much an option’s price changes for each 1-point change in implied volatility. Implied volatility (IV) is the level of future price movement the options market is currently pricing in. The IV that matters is the IV of the specific expiration you are trading, not IV rank or a general measure across the whole option chain.
Because implied volatility is reverse-engineered from live option prices rather than historical data, it reflects what the market expects right now, which is why it can reprice in minutes once an earnings report removes the unknown.
Vega in dollars: the SPX example If SPX implied volatility sits at exactly 20% and drops to 19%, the option price changes by about 46 cents, or roughly $46 per contract.
The maths is simple. A Vega of 0.09 means the option theoretically gains $0.09 per share, or $9 per standard contract, for each one-point rise in IV, and loses the same amount for each one-point fall. The Options Industry Council (OIC) stresses that Greeks are theoretical sensitivities, not guarantees, because price, time and volatility often shift at the same moment.
How Vega behaves across strikes and expirations
Vega does not apply equally to every option. Its size depends on where the strike sits and how much time remains:
- Moneyness: Vega is generally largest for at-the-money options and smaller for options deep in or out of the money.
- Time to expiry: Longer-dated options carry more Vega, and Vega shrinks toward zero as expiration approaches.
- Expiration-specific IV: The expiration containing the earnings date can see its IV collapse far more than a later expiration does.
If you hold an at-the-money option into earnings, you are carrying a Vega exposure that can matter as much as your view on the stock. Before entering the trade, you should know that exposure’s size in dollars.
When big ASX news breaks, our subscribers know first
Why implied volatility crush happens after the announcement
So why does IV fall so sharply once results are out? tastylive defines IV crush as an abrupt decline in implied volatility after a significant event, particularly earnings, as uncertainty fades. The cause is clearest when you look at three separate forces:
- Uncertainty is resolved. Before the report, nobody knows the results, guidance, margins or what management will say. Option prices carry all of that doubt, and once the report is public, most of it is gone.
- The event premium is removed. Pre-earnings IV includes an estimate of the earnings-day jump. Once the jump has happened, that portion of volatility is used up.
- The term structure resets. The term structure is the pattern of IV across different expirations. The first expiration after earnings holds most of the event volatility, then turns into an ordinary short-dated option, while later expirations dilute the single event across more time and fall less.
The OIC notes that weekly expirations let you isolate the expiration right after earnings, but those weeklies become expensive as the event gets closer. That expense is the event premium in its most concentrated form.
How large is the drop? Several datasets give a rough guide.
| Source | Sample | Finding |
|---|---|---|
| IPresage (updated 5 October 2026) | 4,200 earnings events | Average 30-day at-the-money IV fell 38.2%; range 12% to 71%; standard deviation 11.3 points |
| GitHub event study (updated 13 October 2026) | Earnings events, more than 92% following each pattern | IV rose about 7.6 points in the ten days before earnings and fell about 7.3 points immediately after |
The 38.2% figure reflects one provider’s methodology, and the wide range matters as much as the average. IV crush is common, not guaranteed.
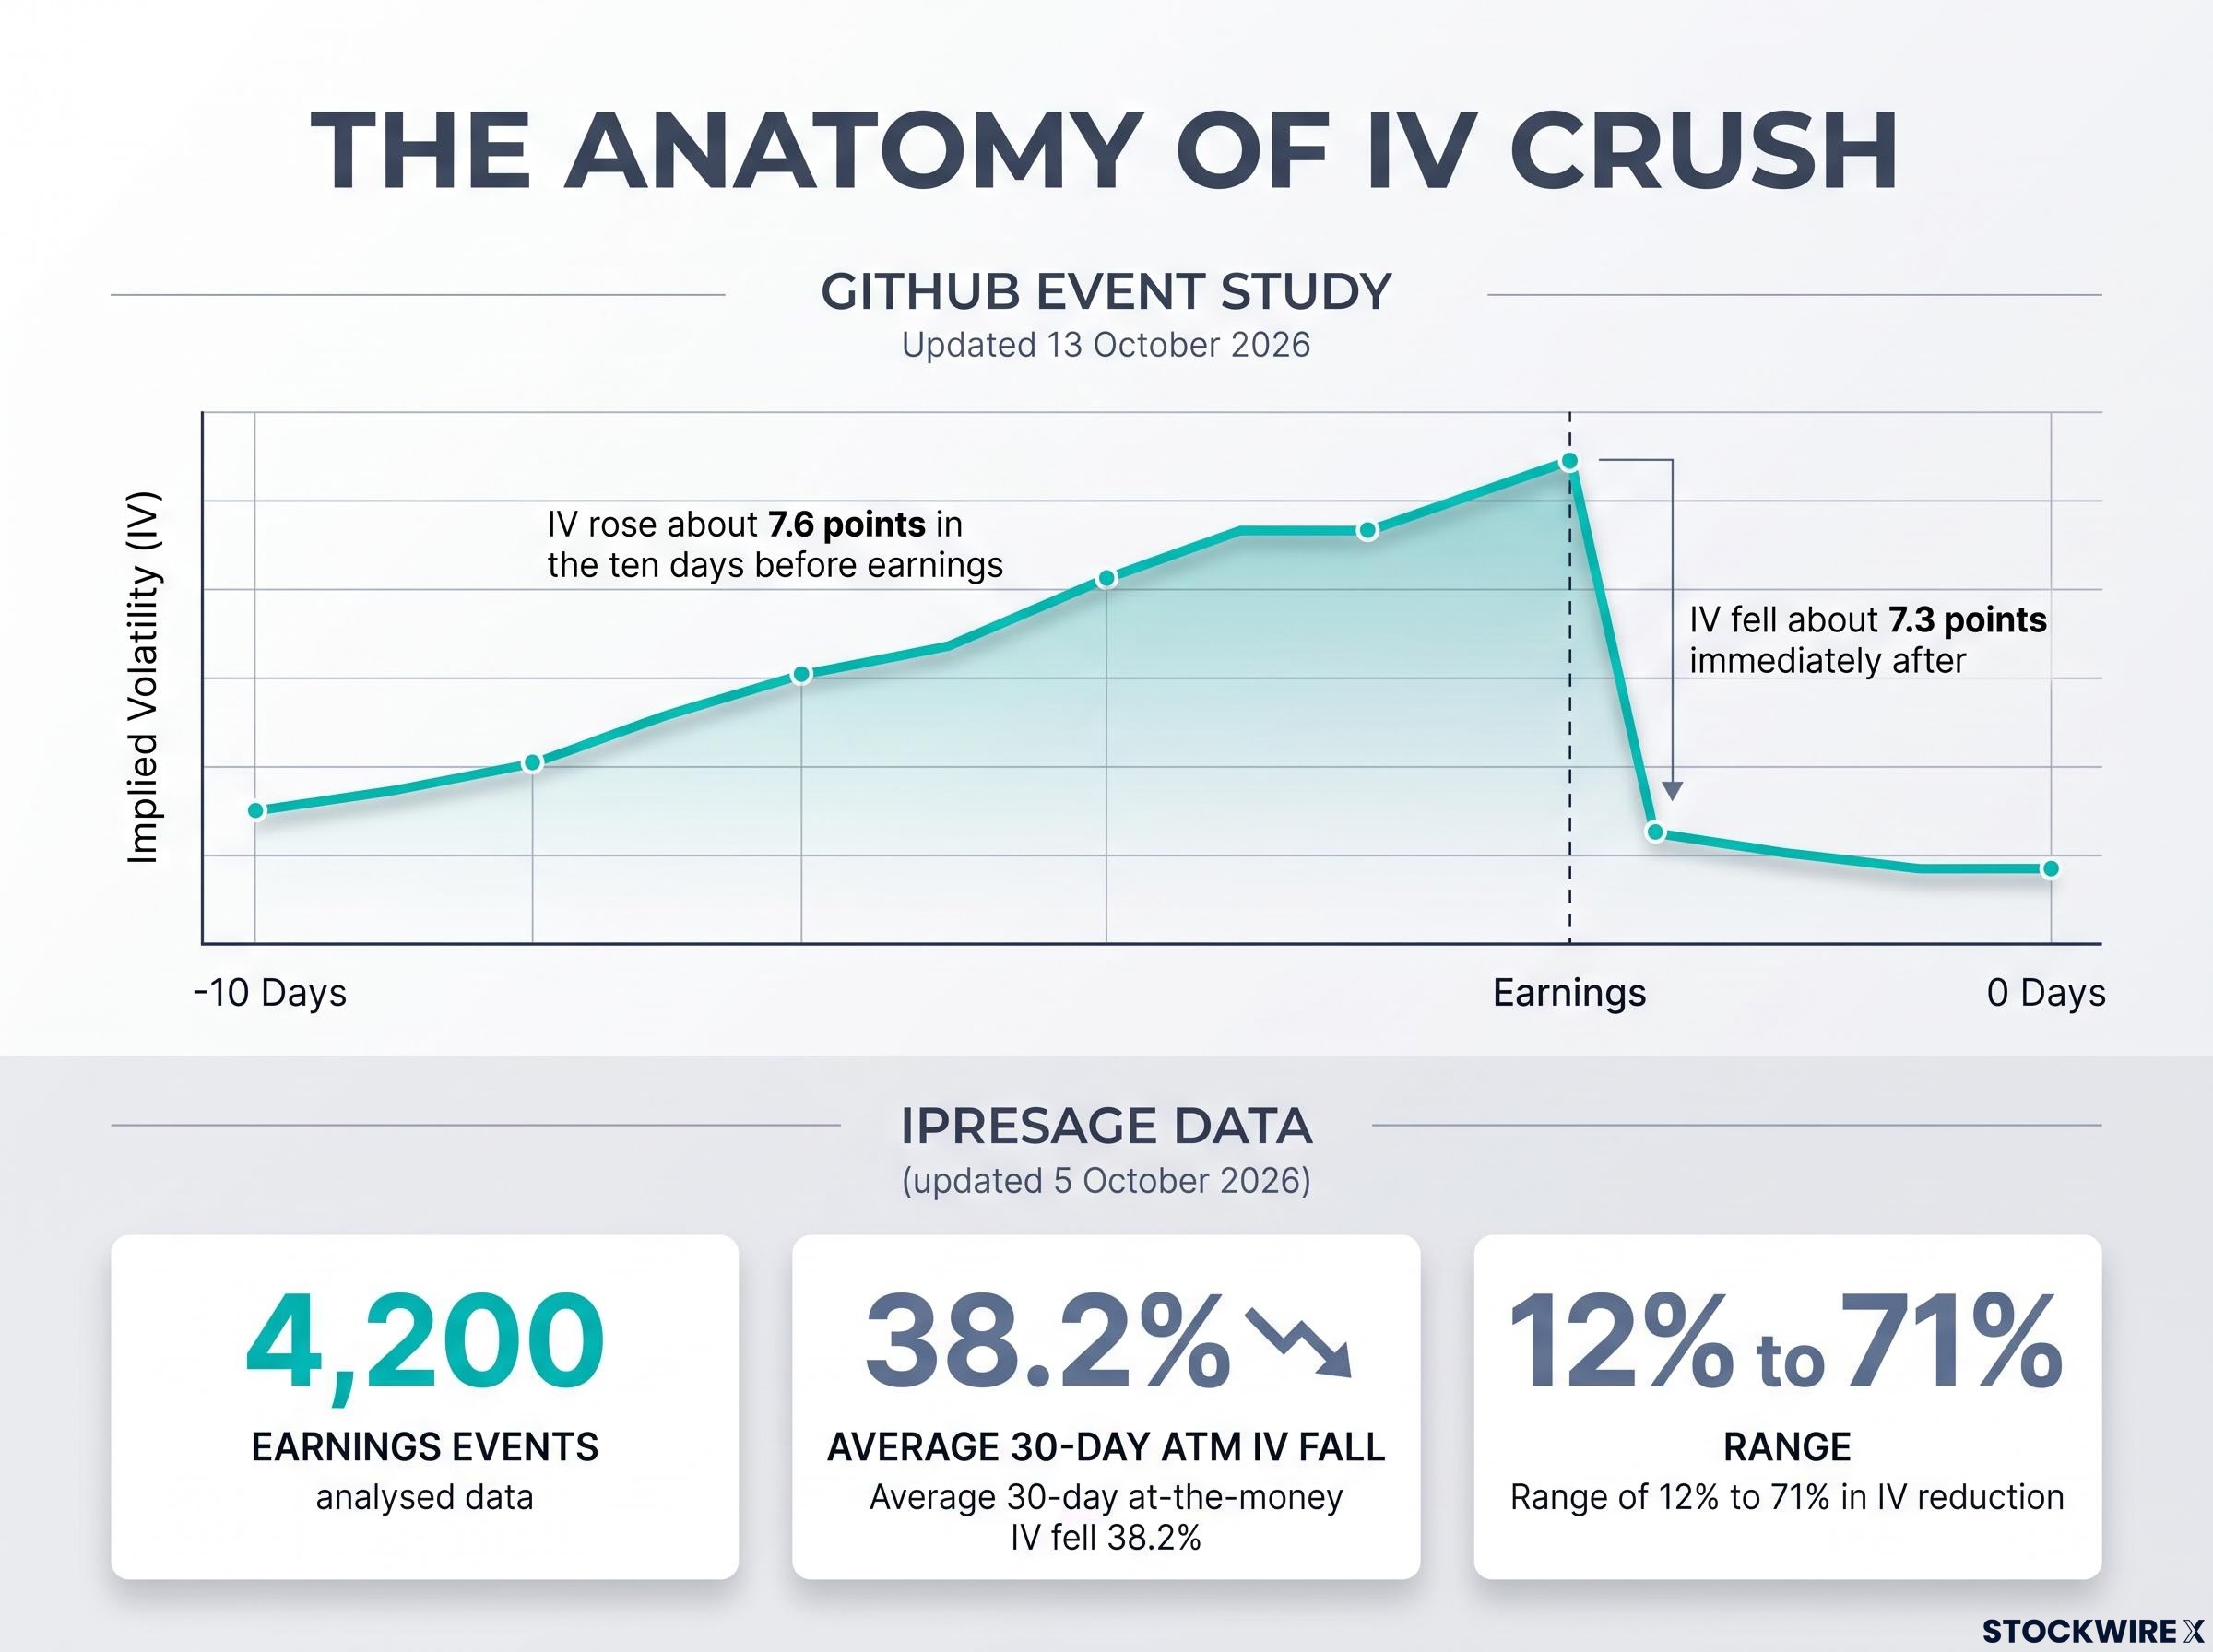
Data from 4,200 earnings events shows average 30-day implied volatility fell 38.2%, with a typical 7.6 point rise before earnings and 7.3 point fall after.
The way to think about it is this: the pre-earnings option price includes a bill for uncertainty. When results land, that bill is refunded to whoever sold you the option. The size of the crush tells you how much of that bill you were paying.
How Vega and Delta collide: the AMD and Datadog examples
To see the two Greeks fight it out, start with a rough formula:
Option P/L ≈ Delta × stock move + Vega × IV change – Theta × time elapsed
Theta is the daily loss of option value from the passage of time. The formula is incomplete because it ignores Gamma, Vanna (how Delta shifts when IV changes) and skew, but it explains why being right on direction does not guarantee a profit.
Long put arithmetic Delta -0.40, Vega 0.08, stock falls $5, IV drops 30 points. Delta gain: +$200. Vega loss: -$240. Net result: about $40 worse, before Theta and trading costs.
The stock did exactly what you wanted. You still lost money.
Your gain from being right on direction can be erased entirely when theta and vega act on the premium at the same time, a pattern that research on retail options losses has documented across millions of trades.
AMD: when the stock barely moves
Mike Butler described a session the day after an AMD earnings release when the stock barely moved, down only about $3. IV collapsed anyway, cutting the price of both calls and puts.
Some options fell from about $2,000 to roughly $100 per contract, with zero-day options holding about two hours of life. The net change (CHG) column, read alongside Vega, showed how much of that loss came from IV crush, with extrinsic value (the part of an option’s price above its intrinsic worth) erased because the move was small compared with what had been priced in.
An illustrative straddle shows the same effect. A straddle is a call and a put bought at the same strike. With a Vega of 0.10 and a 35-point IV drop, the loss is $350, with no Delta gain to offset it.
Datadog: when the stock falls and the put still struggles
In tastytrade’s Datadog example, the stock fell about 32 points, roughly 14%. The two-day 165 put fell from about $100 to about $30, a drop of around 70%, while still sitting about 20 points out of the money.
Further-dated puts held up better. With Delta near 0.24 and Vega near 0.20 against an IV crush of about 15 points, the Vega loss nearly cancelled the Delta gain. A further-dated put bought near $500 sold near $700.
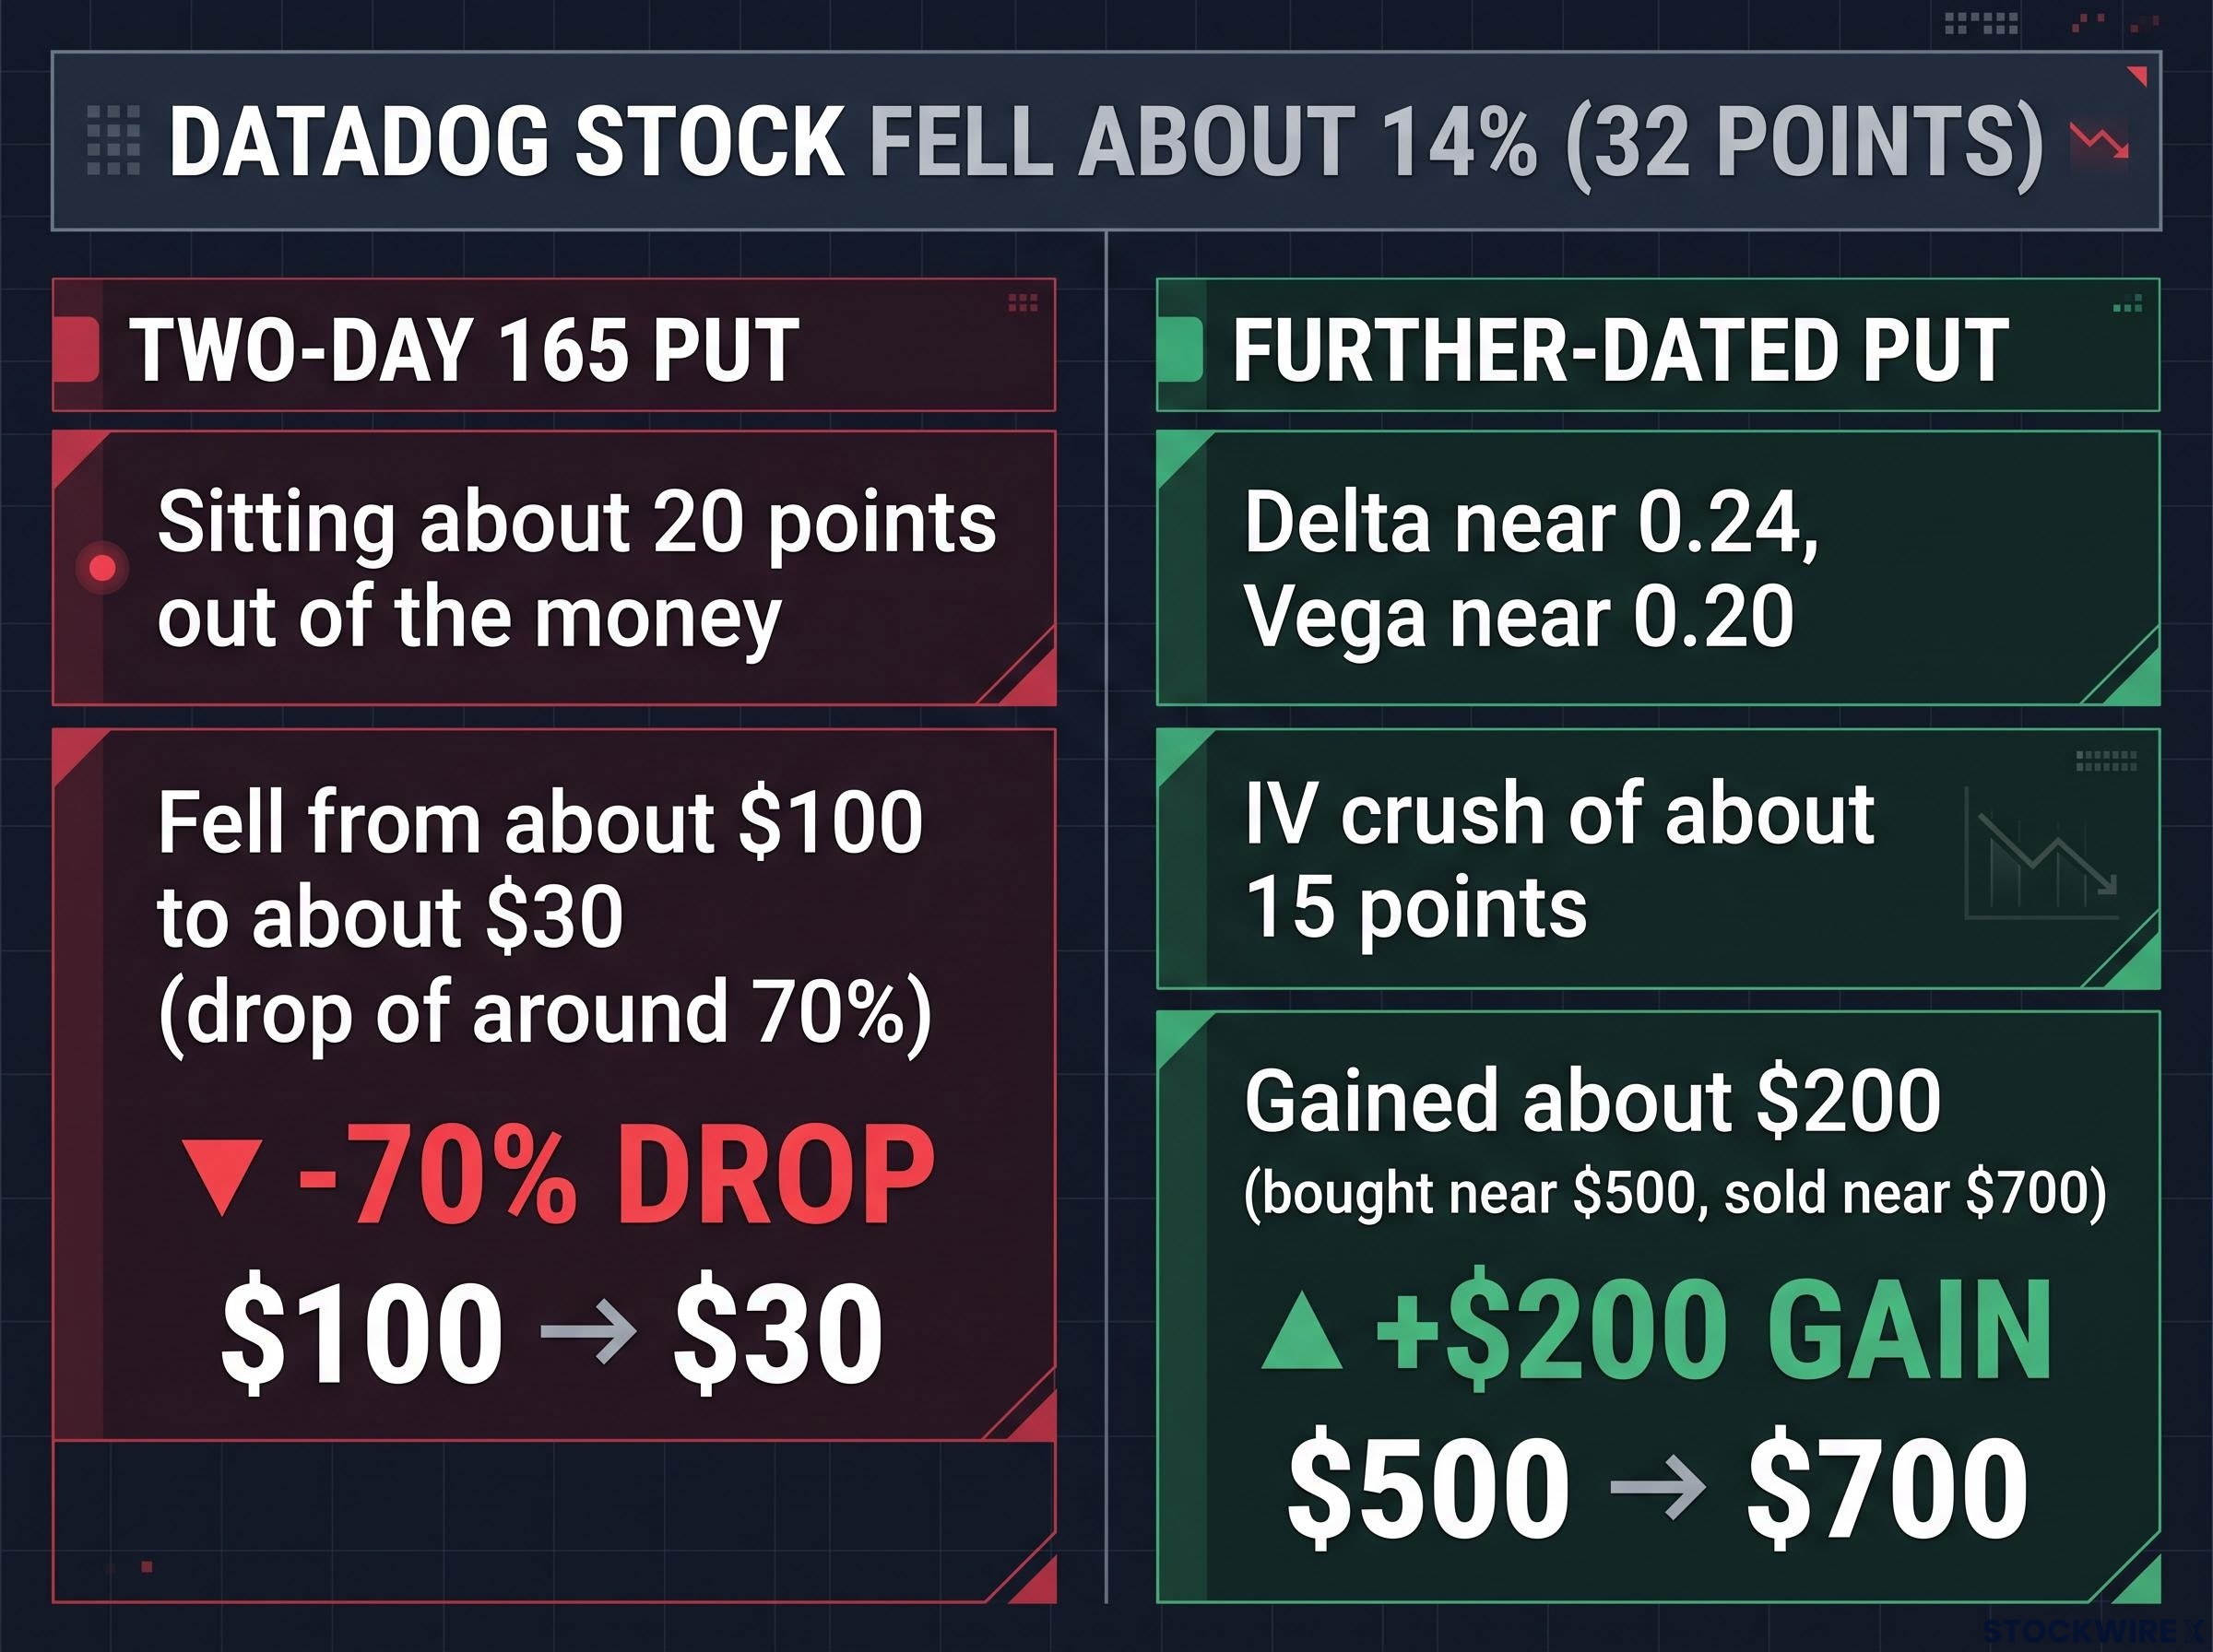
When Datadog stock fell about 14%, a two-day 165 put dropped 70% to about $30, but a further-dated put gained about $200.
| Case | Stock move | IV effect | Option outcome |
|---|---|---|---|
| AMD | Roughly flat, down about $3 | Sharp collapse across calls and puts | Some contracts fell from about $2,000 to $100; small move cannot beat priced-in premium |
| Datadog | Down about 14% | About 15-point crush | Two-day put down about 70%; further-dated put gained about $200; expiration choice decides the result |
Exact IV figures for these tastytrade examples could not be independently confirmed, so treat them as illustrations of the mechanism. The point stands either way: you need to ask whether the move will exceed what is priced in, not just which direction the stock will go.
Reading Vega and the net change column before you trade: practical checks and exceptions
Knowing the mechanism is useful. Turning it into a routine you can run before the next report is better.
A pre-trade checklist
- Convert Vega to dollars. Multiply Vega by the IV change you expect, then by 100. A Vega of 0.08 means about $8 per contract per IV point.
- Watch the CHG column. It shows the option’s total repricing, including Delta, Vega, Theta and Gamma, so you are not guessing from stock direction and Delta alone.
- Compare the right expirations. Do not use a later expiration’s IV to estimate the crush in the first expiration after earnings, because the event premium is concentrated there.
- Check the term structure. A front expiration priced well above later ones signals a large event premium waiting to unwind.
- Check moneyness and skew. Out-of-the-money puts can carry expensive downside skew, meaning higher IV than nearby strikes, which can shrink your gain even when Delta rises.
- Consider defined-risk spreads. A vertical debit spread reduces net Vega because its legs partly offset. Credit spreads can benefit from IV contraction but cap upside and can carry wider execution costs.
When the usual pattern fails
The checklist works most of the time. These are the situations where it can mislead you:
- IV can rise after a report. New uncertainty, such as weak guidance or a second catalyst, can push volatility higher instead of lower.
- Implied moves can be underpriced. Ahead of AMD’s results on 3 November 2026, the implied move was about 9% (about $41 with the stock near $467). The stock reached about $520, above the implied range of about $452.28 to $515.52.
- They can be close calls. Datadog fell 13.2% on 6 August 2026 against a ±12.8% implied move.
- Sellers carry gap risk. tastylive research found stocks stayed within the expected move about 68% of the time, so roughly one move in three broke out of it.
- Small samples mislead. Kresmion data (updated 7 November 2026) covering 35 events found a median implied move of 6.74% against 4.02% realised, with realised exceeding implied 12 times (about 34%).
Averages hide wide variation. Use these figures as context for sizing risk, not as proof of a built-in edge for buyers or sellers. Buying premium is not automatically safer, and selling it is not free money.
The bottom-line question Was the move large enough to overcome the pre-event premium, the Vega loss in your expiration, Theta, skew changes and trading costs?
What to ask before the next earnings trade
Every point here reduces to one question. Not “which way will the stock go?” but “will the move be big enough to beat the premium I am paying?”
IV crush happens often, but not every time, and its size varies widely between companies and reports. That is why Vega and Delta have to be read together. A correct directional view can be cancelled by a volatility reset you never priced into your plan.
Traders who want to use the front-to-back IV gap rather than fight it often build a calendar spread, where a front-to-back IV ratio below 1.5x is commonly treated as too thin to cover costs.
Before your next earnings position, find the Vega for the exact expiration you plan to trade and convert it to dollars. Then watch the net change column so you can see how the option is actually repricing, rather than assuming the stock’s direction tells the full story.
This article is for informational purposes only and should not be considered financial advice. Investors should conduct their own research and consult with financial professionals before making investment decisions. The profit and loss calculations above use simplified approximations for readability and exclude some factors that affect real option prices.