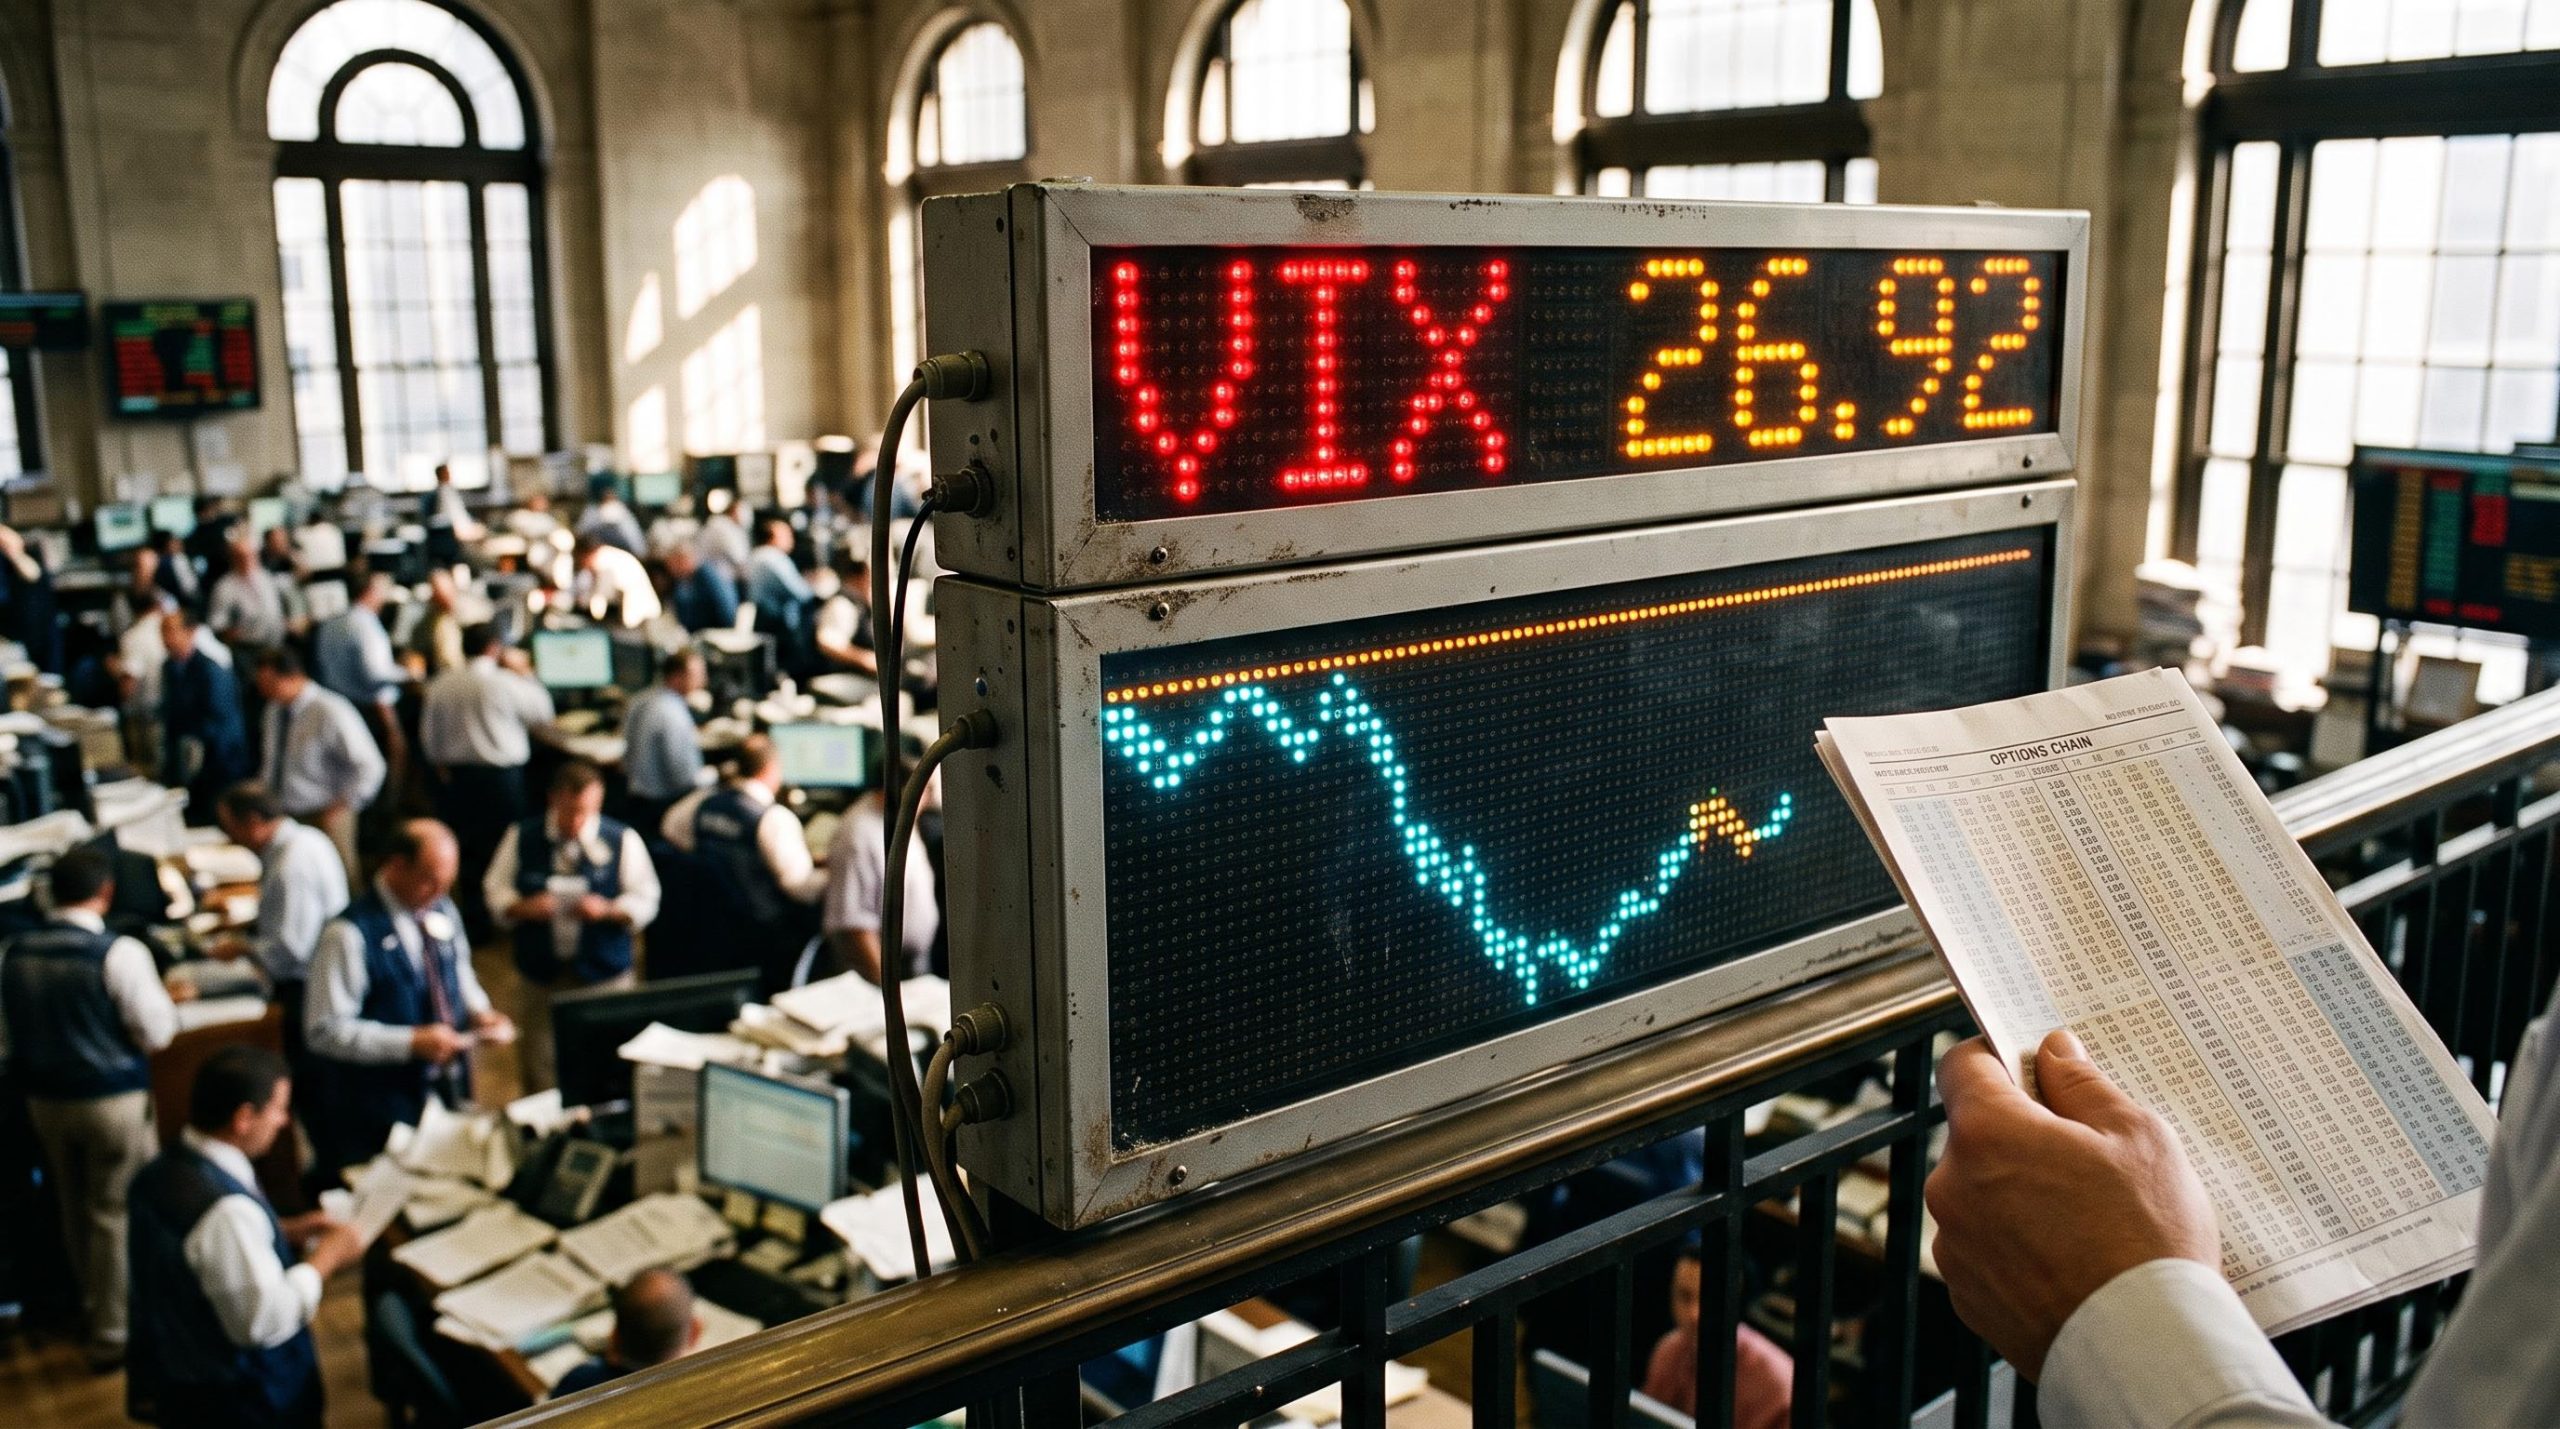
The S&P 500 finished Friday up 1.18% at 7,420.00, a day after a 4.36% plunge. On the surface, that looks like the stock market selloff running out of steam. The options market tells a different story: the VIX closed at 26.92, still far above calm levels.
Thursday’s VIX jump of nearly 70% ranks among the largest one-day moves ever recorded. SpotGamma founder Brent Kochuba, who described the drop as roughly 5-6% in a Friday-morning discussion, advised against taking significant risk into the weekend.
His caution rests on mechanics rather than mood. Dealer hedging, forced selling by leveraged funds and a crowded event calendar all shape how much staying power a rebound like Friday’s has.
Here is what the positioning data says about why the bounce may fade, which dated events could clear risk, where one strategist sees buy zones and how professionals are discussing hedges.
Why did Friday’s rebound leave the market only half repaired?
Start with the closing numbers from 5 November and 6 November 2026.
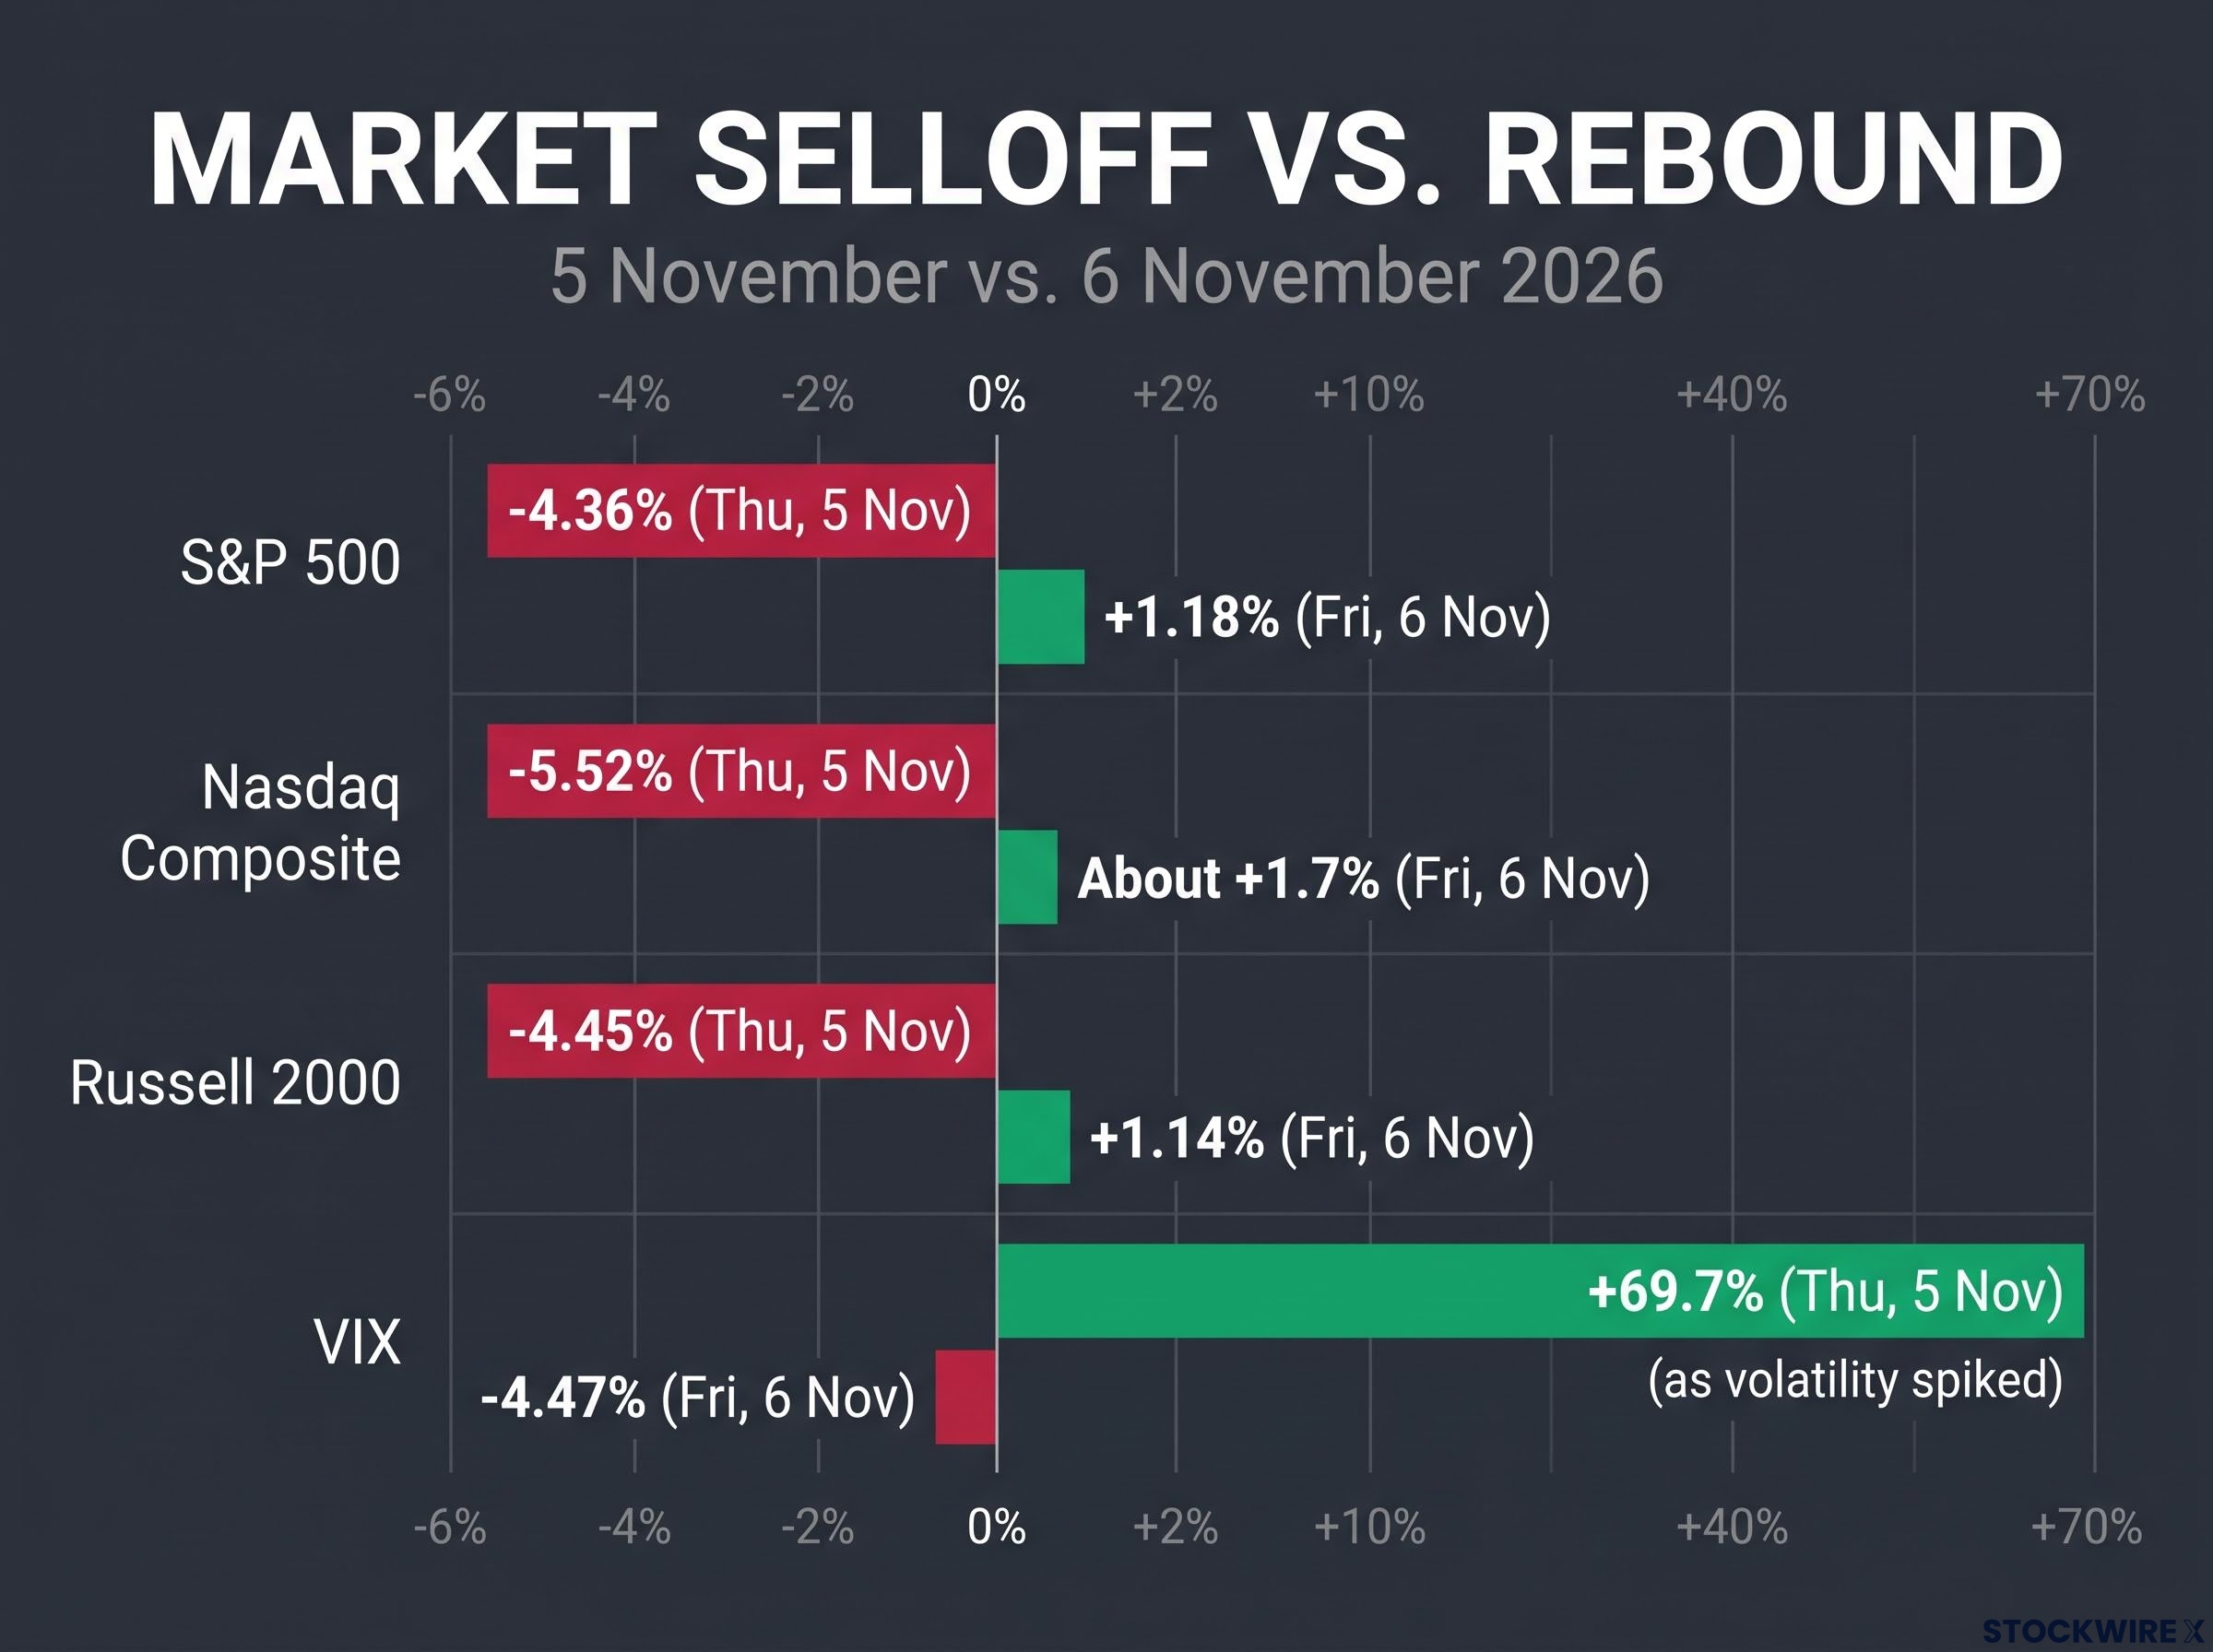
The S&P 500 dropped -4.36% on Thursday but recovered just +1.18% on Friday, while the VIX spiked +69.7% before retreating only -4.47%.
| Index/measure | Thursday | Friday |
|---|---|---|
| S&P 500 | -4.36% to 7,353.73 | +1.18% to 7,420.00 |
| Nasdaq Composite | -5.52% | About +1.7% |
| Dow Jones Industrial Average | -3.44% | +0.49% |
| Russell 2000 | -4.45% | +1.14% |
| VIX | +69.7% to 28.18 | -4.47% to 26.92 |
Look at the gaps. The Nasdaq clawed back less than a third of its loss, the Russell 2000 recovered roughly a quarter, and the VIX barely retreated from what CNBC called its biggest one-day rise since April 2025.
VIX spikes do not all carry the same message; history suggests the classic contrarian buy signal has applied mainly at extreme readings, which is why a close near 27 is better read alongside positioning than on its own.
Kochuba’s explanation is simple. After Thursday, both puts and calls were priced so richly that a bounce became likely almost by default, with volatility easing and short sellers covering positions doing most of the lifting.
Kochuba’s read: The morning rally was a mild, oversold bounce that is likely to be short-lived, and the real question is who the incremental buyers will be once volatility has compressed.
SpotGamma’s published analysis points the same way, identifying de-risking and short covering rather than institutions rebuilding exposure. Single-stock flow ran at only about $130 million, a fraction of what genuine accumulation can reach. Retail investors sold roughly $350 million on Thursday, according to CNBC, which Kochuba framed as the heaviest retail selling since COVID in sentiment terms.
The previous three Fridays had all closed lower, so Friday’s green finish broke a streak. It did not change who is buying.
A rebound powered by short covering has no fresh money behind it, which tells you a green day should not be read as an all-clear.
When big ASX news breaks, our subscribers know first
How do gamma and volatility explain why bounces like this fade?
To see why, picture a dealer’s screen as prices fall. Gamma measures how fast an option’s sensitivity to the share price changes as that price moves. When dealers are in negative gamma, their hedging forces them to sell as the market falls and buy as it rises, which amplifies every move.
Dealer gamma positioning also shifts market liquidity: when dealers move into short gamma, top-of-book depth can thin sharply, so even modest sell orders move the index by several points.
Here is the chain that turns a drop into a fragile rebound:
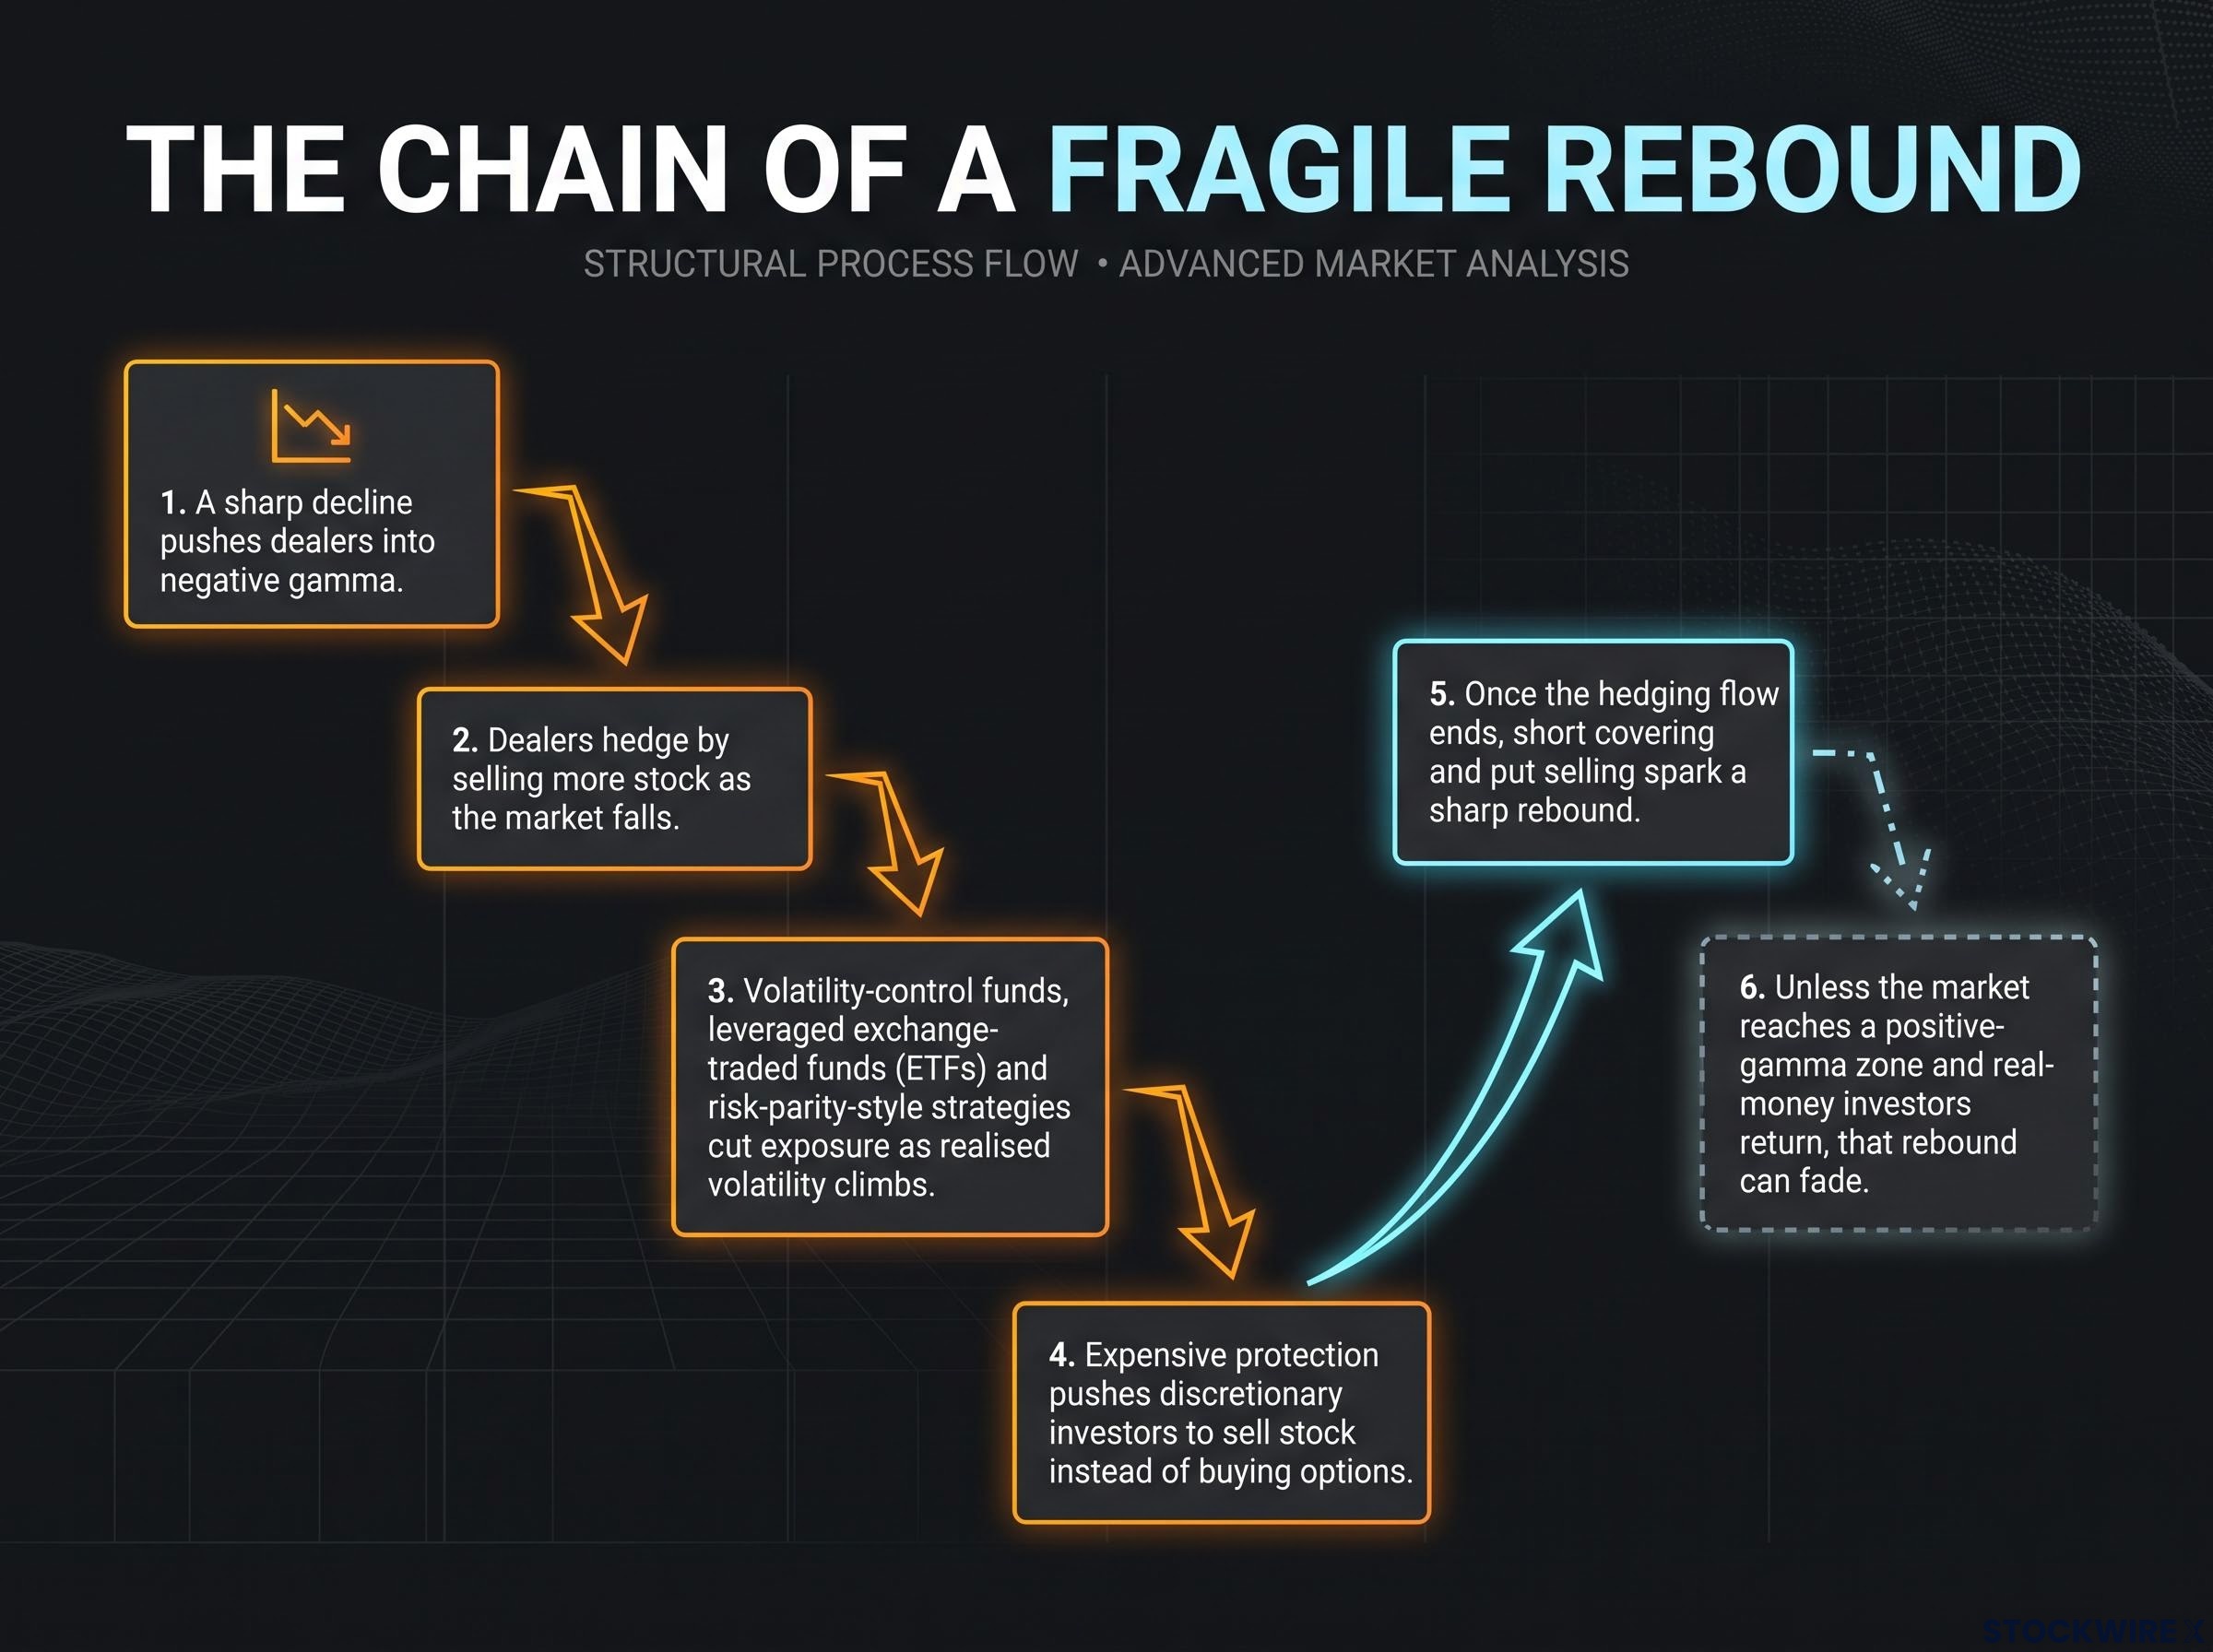
A 6-step process explains how dealer hedging and negative gamma turn a sharp decline into a short covering rebound that can quickly fade.
- A sharp decline pushes dealers into negative gamma.
- Dealers hedge by selling more stock as the market falls.
- Volatility-control funds, leveraged exchange-traded funds (ETFs) and risk-parity-style strategies cut exposure as realised volatility climbs.
- Expensive protection pushes discretionary investors to sell stock instead of buying options.
- Once the hedging flow ends, short covering and put selling spark a sharp rebound.
- Unless the market reaches a positive-gamma zone and real-money investors return, that rebound can fade.
The scale on Thursday was large. Nomura‘s Charlie McElligott estimated leveraged ETFs may have needed to sell about $47 billion into the close, concentrated in technology and AI funds. Nomura also found many investors simply cut stock exposure rather than buying puts, so the market can look less hedged even as investors turn more defensive.
SpotGamma’s 5 November commentary added that forward gamma remained negative and the volatility surface had not normalised. Its key S&P 500 levels:
- 7,600: the risk pivot, below which dealer positioning grows increasingly negative.
- About 7,400: the put-wall area, reached on Thursday, where selling eased.
- 7,750-7,800: the upside zone where a rebound could stall.
What the put wall can and cannot do
A put wall is a strike price carrying heavy put positions, where dealer hedging can slow a decline. It is not a floor: dealers can lose that cushion if investors sell more puts, if prices push through the strike or if correlations rise. Monetising puts and rolling them lower also shifts support down, adding acceleration if the market falls another 3-4%.
Treat levels like 7,400 as zones where selling may pause, not guarantees.
What could happen over the weekend, and why does Monday matter?
That fragility matters most when markets are shut. Kochuba noted that large selloffs often begin on Mondays because weekend liquidity is thin and risk cannot be managed until the open, unlike weekday nights.
Information keeps arriving regardless. Possible triggers include:
- A geopolitical shock
- A policy announcement
- A break in overseas markets
- A delay to the Anthropic IPO
- A new AI financing problem
Any of these could produce a Monday gap before dealers adjust hedges. A gap of that kind could skip past the 7,000-7,100 area entirely.
Two precedents, two different outcomes
On 5 August 2024, the Nikkei 225 fell 12.4%, its worst session since 1987, as the yen carry trade unwound. Leveraged positions funded in cheap yen were forced to close as the currency strengthened, and the VIX moved above 60 intraday. The Bank for International Settlements described the weekend as significant because forced deleveraging built up before Japanese markets reopened. Its relevance here is mechanical, not a forecast of a repeat.
The mid-2026 SpaceX IPO offers the other outcome. The S&P 500 was down about 5-6% heading into the June listing, then stabilised through short covering, dip buying and the passing of issuance worries.
Selloffs can be violent without turning into bear markets. If you hold index exposure, though, the weekend is the one window you cannot adjust, so the time to decide how much gap risk you are comfortable carrying is before Friday’s close.
Which dates could clear risk, and where are the buy zones?
Beyond Monday, the next fortnight is mapped by specific events.
The event calendar
| Date | Event | Why it matters |
|---|---|---|
| Week of 9 November | Anthropic roadshow expected (Reuters) | Tests whether the timetable and valuation hold |
| Week of 16 November | Possible Anthropic pricing | A delay or repricing could prolong the overhang |
| 17 November | Nvidia earnings | Concentrated AI event risk |
| 18 November | VIX expiration | Volatility hedges can roll off |
| 20 November | Monthly options expiration | Closing hedges may ease downside pressure |
Anthropic filed on 26 October, targeting a Nasdaq listing under ANT, with valuation talk of $1.5 trillion to $2 trillion. The schedule is not firm. Kochuba suggested investors may sell other holdings to raise cash for the deal, a thesis he flagged as speculative and outside his expertise.
His broader view is that these events could clear risk as hedges close, with a good chance of a new low within one to two weeks and a bounce window around 15-17 November. Thanksgiving week’s time decay typically erodes puts and VIX calls, which can enable a sharp rally later that week. Implied moves cited on the show put the S&P at 235 points through Thanksgiving versus 256 for November, with VIX implied volatility at 192% for November expiration and 160% for Thanksgiving week.
Options expiration matters because it removes the dealer cushion that pinned prices beforehand; gamma then takes weeks to rebuild, which is why the days after a big expiry can leave markets exposed to shocks.
Bull case, caveats and the 7,000-7,100 zone
Kochuba identifies 7,000-7,100 on the S&P 500 as his buy zone. The evidence on each side:
- Bull case: Thursday’s drop left markets technically oversold; October payrolls rose 165,000 against about 65,000 expected, with unemployment at 4.1%; a CNBC survey found more than three-quarters of advisors recommended checking allocations or staying the course.
- Caveats: negative gamma can overshoot levels; Nvidia and Anthropic concentrate event risk; stronger jobs data lifted the 10-year yield to about 4.87% and raised December Fed hike odds.
The calendar suggests the next two weeks are likely to stay volatile. Any buying plan you consider is better staged around these dates than committed all at once.
Is money leaving equities, and how are strategists hedging?
The harder question is where money went on Thursday. The answer appears to be nowhere obvious.
Cross-asset signals
Saxo’s implied correlation reading reached 15.60, the highest in its 100-session window, meaning stocks increasingly moved together. Long-end yields stayed quiet during the rout, which Kochuba found troubling because a flight to quality would normally pull them lower. By Friday the 2-year sat near 4.52%, the 10-year around 4.87%-4.88% and the 30-year about 5.27%-5.29%.
Gold weakened Friday as yields and the dollar rose, and Kitco reported investors selling it to meet equity-related margin calls. McElligott framed the liquidation as the unwinding of a crowded barbell of long energy and long semiconductors. With no clear haven, the pattern points to money leaving equities rather than rotating within them.
Hedging structures compared
Elevated implied volatility makes outright puts expensive, pushing strategists towards structures that sell some premium to offset cost. Kochuba has pitched S&P 500 put flies near 7,000-7,100 and short-dated call flies or call spreads for bounces, while the show’s hosts suggested collars, near-term flies and Monday butterflies.
Strategists weighing these structures also look at bearish options overlays, which layer spreads and butterflies to offset losses elsewhere in a portfolio, though they hedge index-level moves only and leave single-stock risk uncovered.
| Structure | How it works | Main benefit | Main trade-off |
|---|---|---|---|
| Put spread | Buy a higher-strike put, sell a lower-strike put | Cheaper than an outright put | Protection stops below the short strike |
| Put fly | Buy an upper put, sell two lower puts, buy a still-lower put | Targets a zone such as 7,000-7,100 at lower cost | Pays poorly if the market falls too far or not far enough |
| Call fly | Buy a lower call, sell two higher calls, buy a still-higher call | Cheap way to express a bounded rebound | A strong rally leaves you underexposed |
| Collar | Buy a put, sell an out-of-the-money call against stock | Limits downside; call premium cuts cost | Caps upside |
| Monday butterfly | Short-dated butterfly around a likely Monday settlement zone | Inexpensive weekend-gap hedge | Can expire worthless on a large gap either way |
Even a correct call can lose money, because a post-event volatility collapse can erode long options. Hedging is not one decision: the right structure depends on whether you hold stock, fear a gap or expect a bounded rebound, and its cost is set by volatility you cannot control.
What to watch before the next risk-clearing window
Friday’s rebound was real but thinly supported, built on short covering rather than new buyers. The calendar offers dated catalysts, and the 7,000-7,100 zone is one strategist’s tactical view, not a guarantee.
Three variables will tell you most about whether the bounce holds:
- Monday’s open: whether weekend news produces a gap that bypasses key levels.
- Anthropic’s roadshow and pricing timetable: whether the deal proceeds as reported or slips.
- Nvidia earnings on 17 November: the largest single AI event before options expiration.
The strategist views quoted here are tactical opinions, not forecasts, and options structures can lose their full premium. These statements are speculative and subject to change based on market developments.
This article is for informational purposes only and should not be considered financial advice. Investors should conduct their own research and consult with financial professionals before making investment decisions.