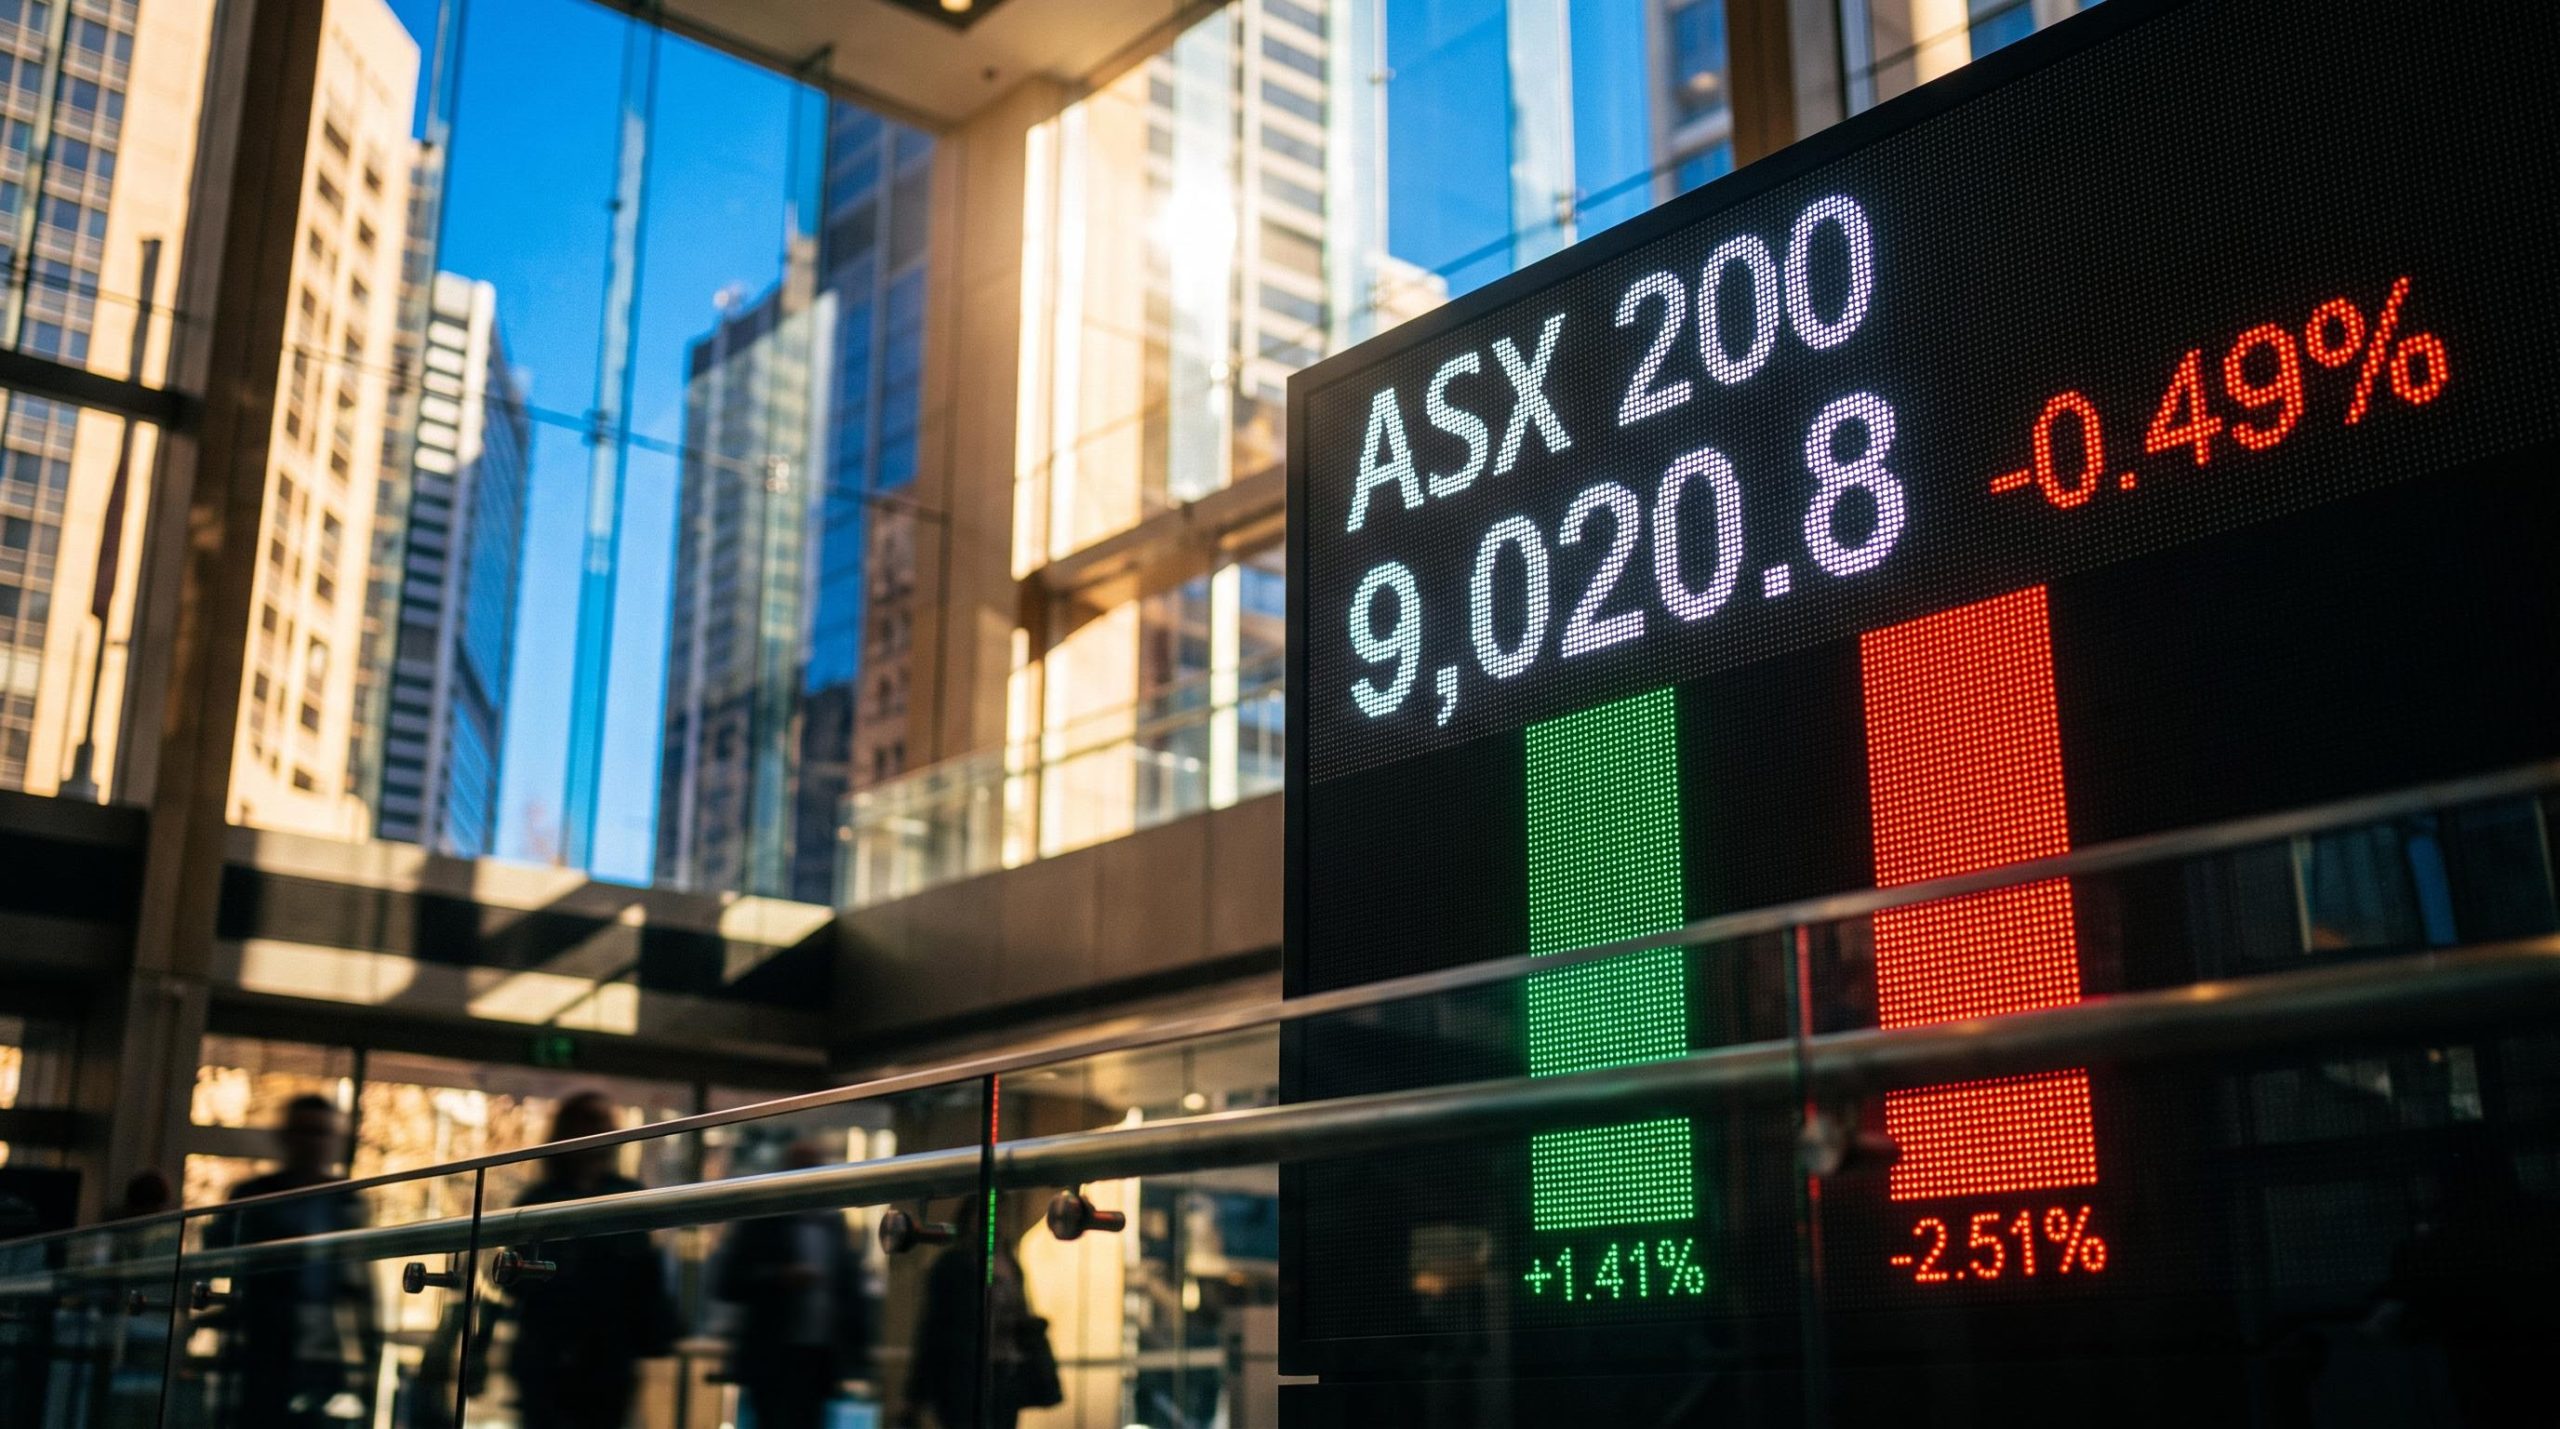
Australian investors have been quietly moving their trading toward US stocks. In the six months to 9 October 2026, 10 of the 20 stocks most traded by Australian Sharesight users were US-listed, up from 8 in the prior six months.
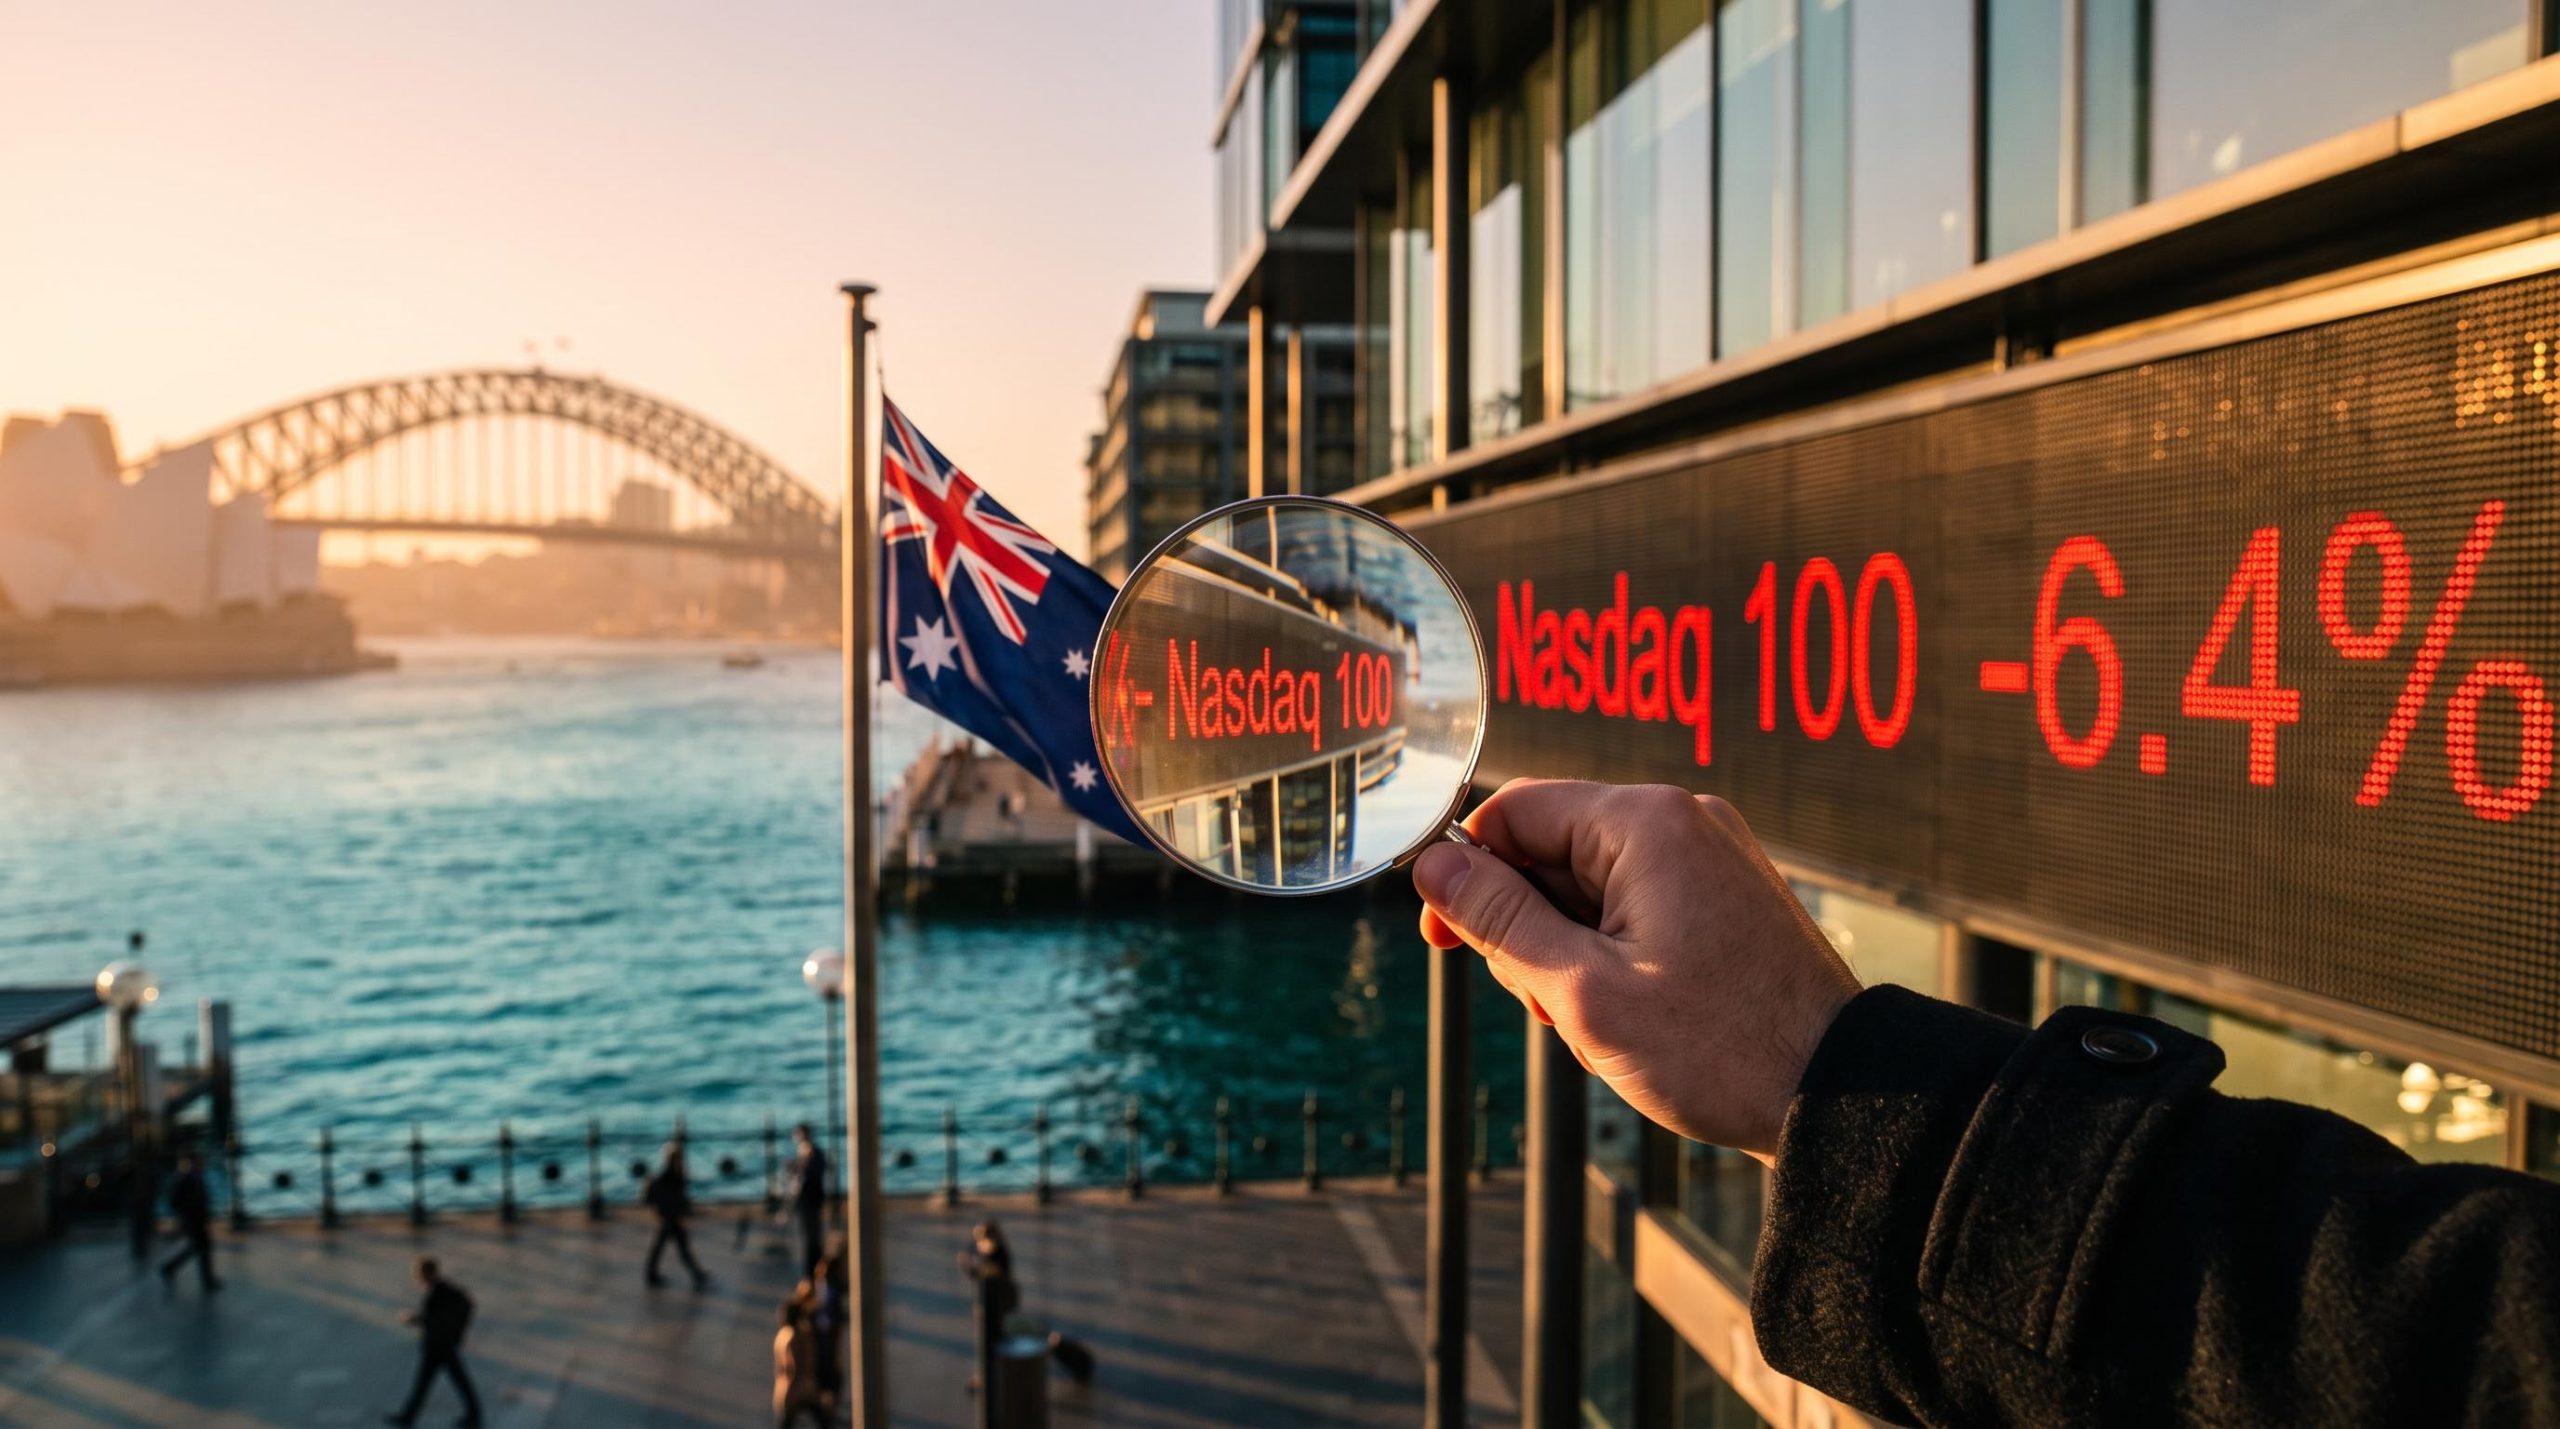
Then this week, the Nasdaq 100 fell 6.4% in a single session. The shift toward offshore shares has collided with the roughest stretch the US market has delivered all year.
The question underneath is less dramatic than the headlines. Australia makes up just 1.5% of global equities, so looking beyond the ASX is close to unavoidable for anyone seeking broad exposure. The real decisions are how to do it, how much it costs, and which risks you take on along the way.
Here is a clear-eyed weighing of the benefits and the costs, so you can judge whether your own offshore allocation fits your income needs, tax position and tolerance for volatility.
What the Sharesight data shows about the shift to US stocks
Start with the leaderboard. According to the Sharesight survey published on 5 November 2026, NVIDIA overtook CSL as the single most-traded stock among Australian users. Alphabet, SpaceX, Microsoft, Tesla and Micron also made the top 10.
The trading split moved the same way. Across the 25 leading ASX and US stocks, US names accounted for 47% of trades, up from 40%.
Buying intent followed. US stocks took 55% of net buying, up from 50%, and 66% of trades in leading US names were buys, compared with 62% for leading ASX names.
| Measure | Latest six months | Previous six months |
|---|---|---|
| US names in top 20 traded | 10 | 8 |
| US share of trades (top 25 ASX and US stocks) | 47% | 40% |
| US share of net buying | 55% | 50% |
Meanwhile, trading in leading ASX names fell 25%. Resources lost the most attention: Woodside Energy trades dropped 44% and BHP trades 23%. Only NAB, Telstra, Fortescue and Westpac among the leading local names drew more buy trades.
The speed is the striking part. SpaceX listed in June and reached sixth place within four months, passing Woodside along the way.
Douglas Morris, Chief Executive Officer, Sharesight: “Home bias is fading because Australian investors can see what is happening offshore.”
Home bias is the tendency to hold far more of your home market than its global weight would suggest. The data tells you your peers are actively rebalancing toward the US. But it measures trading among Sharesight users, not total portfolio holdings, so read it as a sentiment signal rather than a benchmark to copy.
When big ASX news breaks, our subscribers know first
Why are Australian investors buying US stocks? The structural and cyclical drivers
Some of the reasons behind this shift will outlast this week’s sell-off. Others may not, and telling them apart matters more than the trend itself.
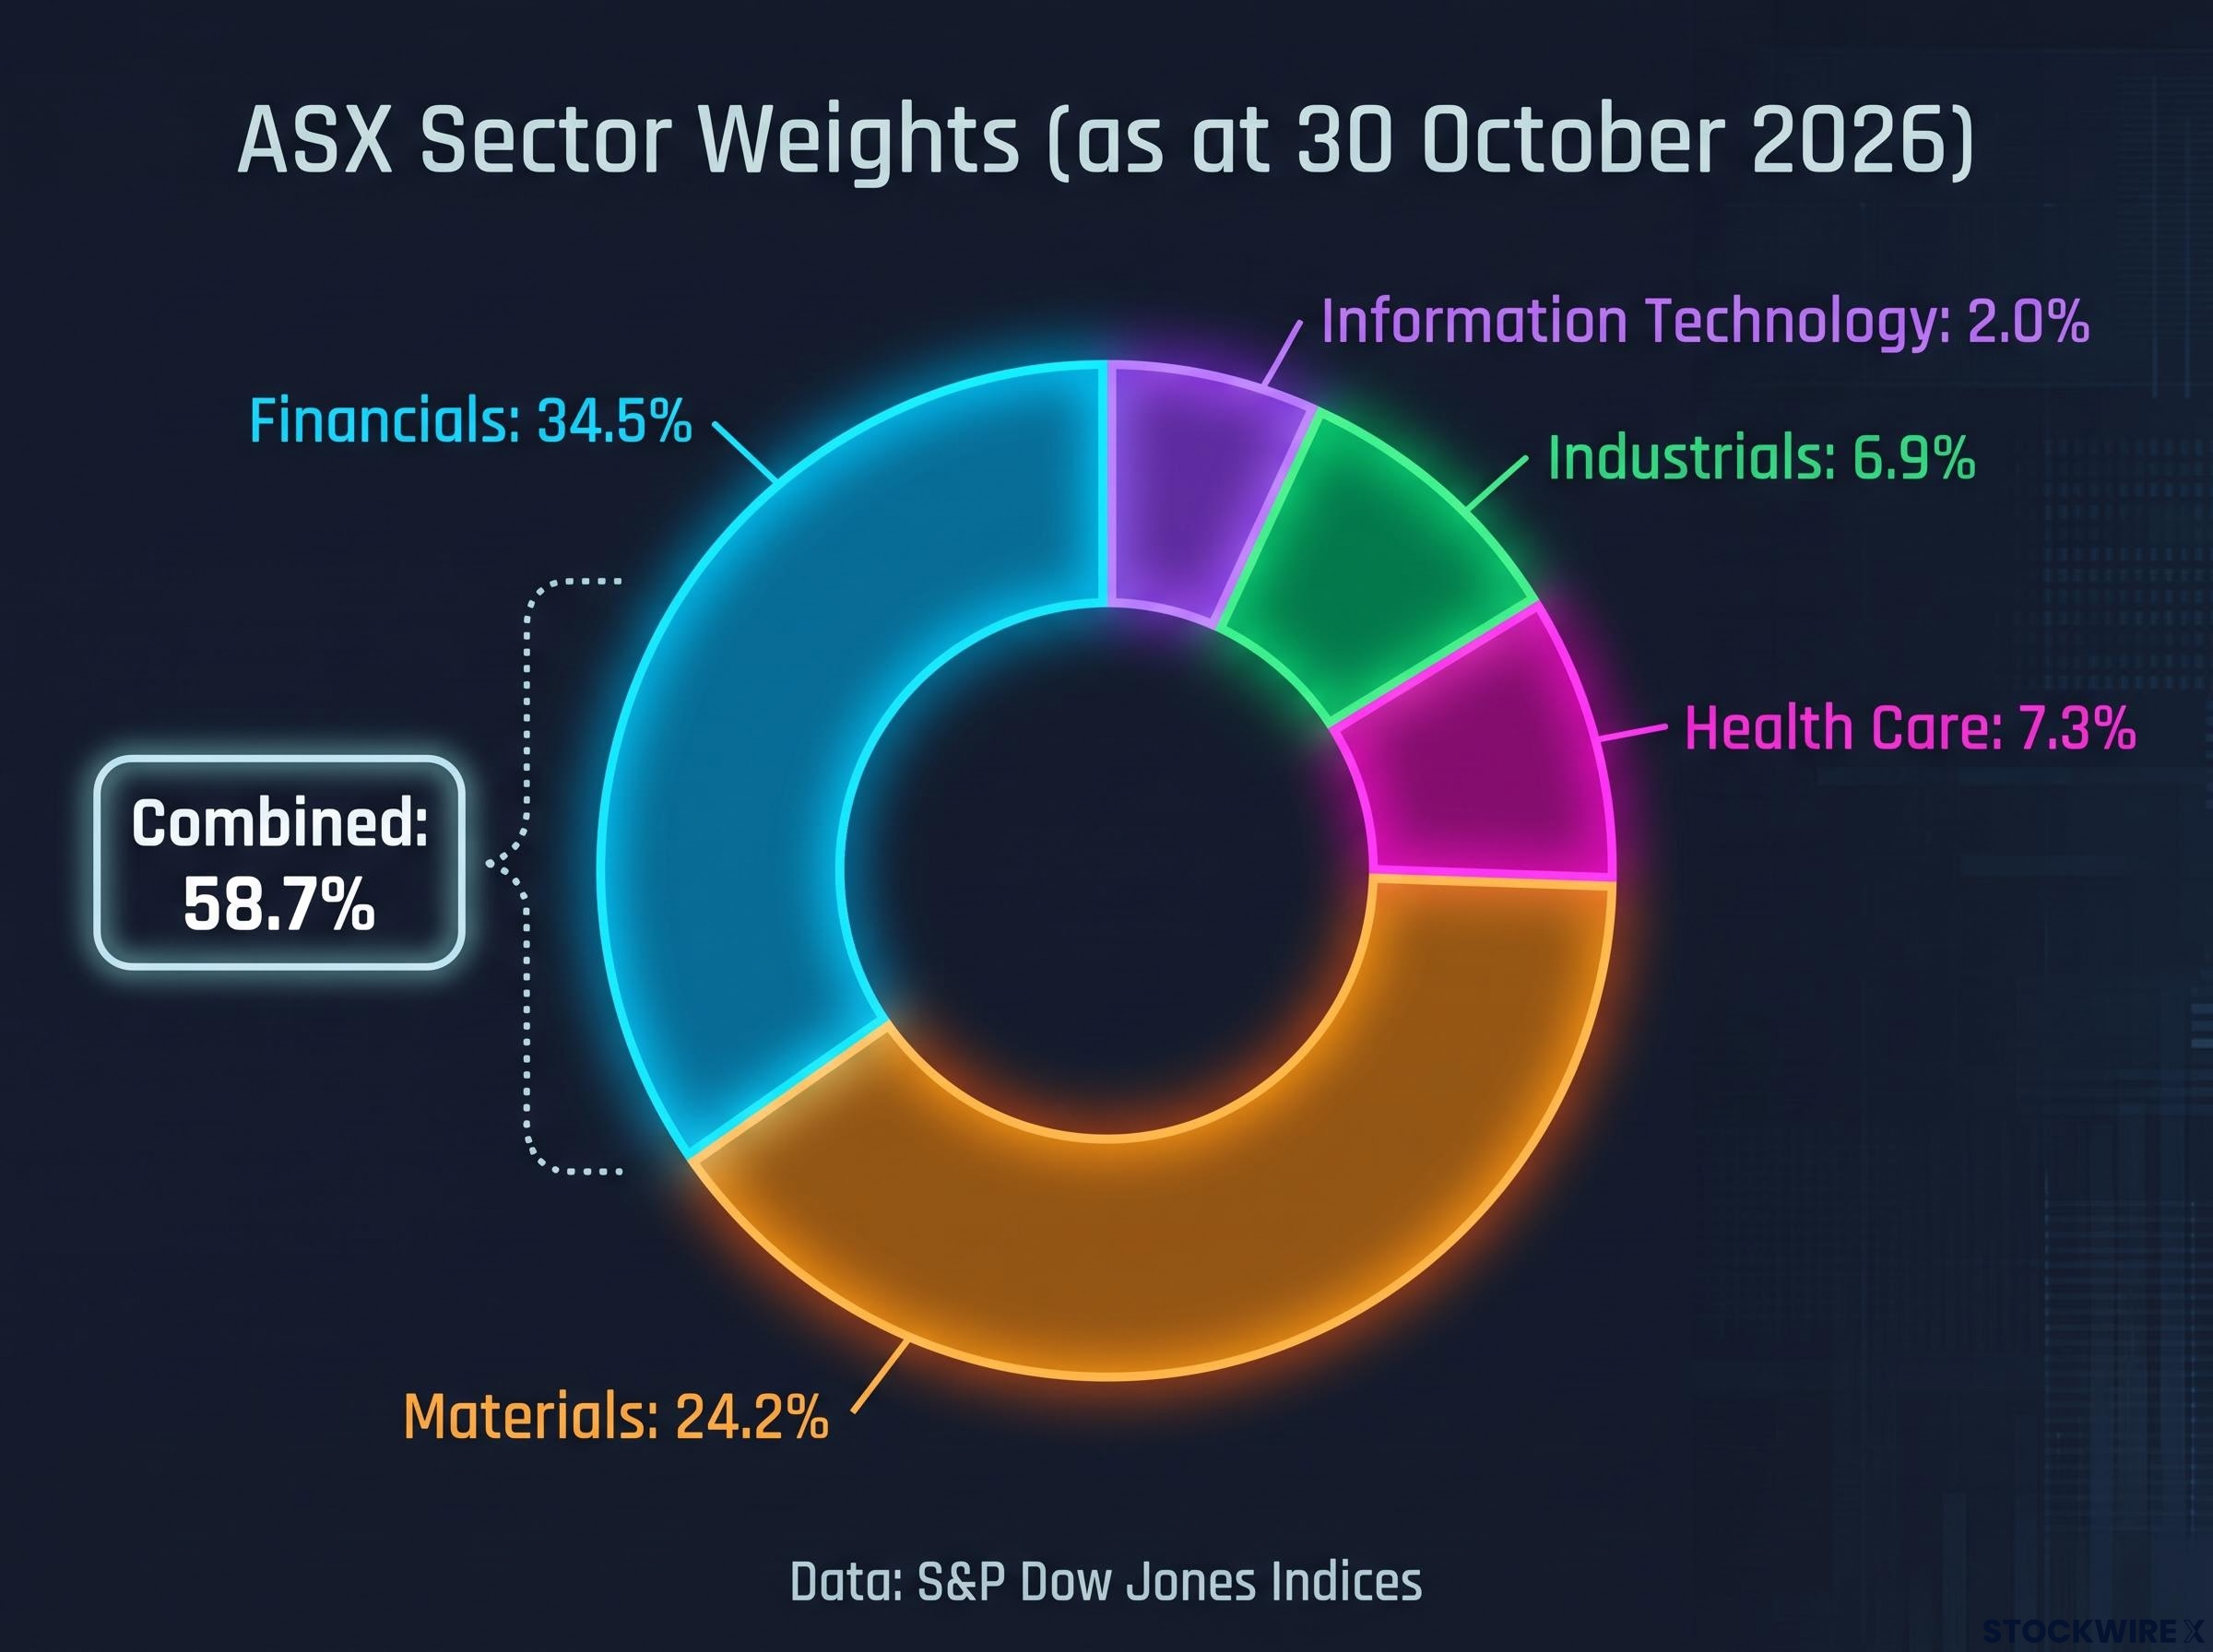
The most durable driver is what the ASX simply does not contain. According to S&P Dow Jones Indices data as at 30 October 2026, the local benchmark leans heavily on two sectors:
- Financials: 34.5%
- Materials: 24.2%
- Health Care: 7.3%
- Industrials: 6.9%
- Information Technology: 2.0%
Financials and materials together make up 58.7% of the index. Some commentary puts the figure at roughly two-thirds, but the dated index data is the more precise number. Either way, the ASX has no mega-cap technology leaders, so AI-related growth largely sits offshore.
Access has also changed for good. Low-cost brokers, fractional trading (buying part of a single share) and app-based platforms now make US shares almost as easy to buy as local ones.
A practical international share allocation can be built with just two funds, a broad developed markets ETF plus a smaller emerging markets complement, which also sidesteps much of the paperwork that comes with holding foreign shares directly.
The cyclical drivers are different. Morris pointed to a largely flat ASX this year against repeated record highs for the S&P 500, alongside four RBA rate rises and strong AI enthusiasm. A directly comparable, dated year-to-date return figure for both indices was not available, so the gap is best described in his qualitative terms.
| Driver | Type | Why it matters |
|---|---|---|
| Few AI and mega-cap tech leaders on the ASX | Structural | IT is only 2.0% of the ASX 200 |
| Easier access via brokers and apps | Structural | Lower cost and friction for US trades |
| Flat ASX versus record US highs | Cyclical | Performance gaps can reverse |
| Four RBA rate rises | Cyclical | Weighed on local sentiment |
| AI enthusiasm | Cyclical | Sentiment tested by this week’s sell-off |
Morris described a division of roles: local shares for dividends, US shares for growth. That habit has deep roots, since dividend imputation, introduced in 1987, long kept Australians focused on fully franked local income.
What this tells you is that the sector gap is a lasting feature of the ASX, while the performance gap may reverse. Base any allocation on the first, not the second.
What offshore investing really costs: currency, withholding tax and franking
Buying a US share looks as simple as buying a local one. The mechanics behind it are not, and they determine how much of the return actually reaches you.
Currency: the second bet inside every unhedged US share
When you buy a US share unhedged, you are also taking a position on the Australian dollar. The RBA recorded AUD/USD at 0.7014 at 4:00 p.m. on 5 November 2026, and the dollar traded around 0.6910-0.6931 intraday on 6 November as the sell-off hit.
A weaker Australian dollar lifts the value of US assets in local terms; a stronger one shrinks it. Take a US share that rises 10%:
| AUD move | US share move | Approximate result in AUD |
|---|---|---|
| Unchanged | +10% | +10% |
| Down 5% | +10% | +15.5% |
| Up 5% | +10% | +4.5% |
A hedged fund uses contracts to largely remove this currency effect, leaving a return close to the underlying US performance minus hedging costs. The trade-off is that you also give up the boost when the Australian dollar falls.
For investors weighing the hedging choice, our dedicated guide to hedged versus unhedged ETFs shows a 13-percentage-point gap between twin funds over a single year.
Withholding tax, franking and paperwork
Withholding tax is tax the US deducts from dividends before they reach you. The standard rate is 30%, but lodging a valid W-8BEN through your broker usually cuts it to the Australia-US treaty rate of 15%. A W-8BEN is a US tax form that certifies you are a foreign investor so you can claim treaty benefits; the ATO notes treaty rates commonly reduce dividend withholding to 15%.
US companies also pay no franking credits. A franking credit is a tax credit attached to Australian dividends for company tax already paid, which can reduce your own tax bill.
Then there is the administration. US markets trade overnight for Australians, so news lands while you sleep. Directly held US shares may also be exposed to US estate tax on death, and because no single universal threshold applies to Australian retail investors, check your own circumstances with a professional.
Put together, a US dividend is worth less to you than a fully franked ASX dividend. And the currency swing can add or subtract more than the dividend itself, so make your hedging choice deliberately.
Does this week’s sell-off change the case for offshore exposure?
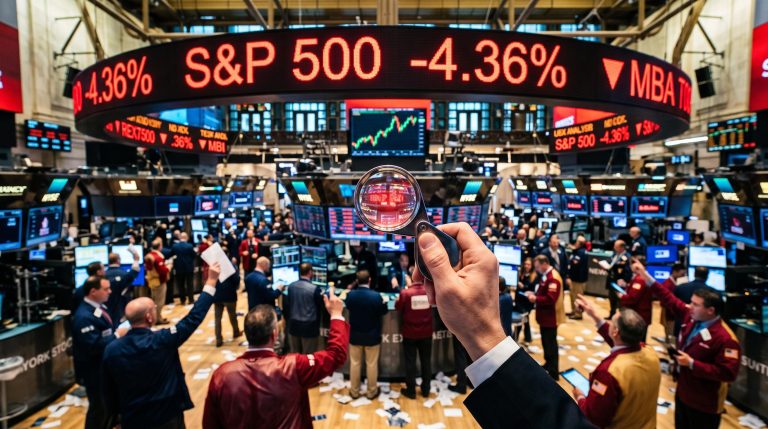
The sell-off delivered the concentration warning in vivid form. The S&P 500 fell 4.4% and the Dow dropped 1,833 points in the sharpest session, while the Nasdaq 100 slid into correction territory.
The session in one number The Nasdaq 100 fell 6.4%, with about US$2.5 trillion erased from the market in a day.
The broader AI and semiconductor rout has cost roughly US$5 trillion in value since 6 October. Disappointing results from Intel and Amazon started it, then worries grew that massive AI spending may not turn profitable quickly enough. Concern that a Democratic midterm win could bring tougher AI regulation added fuel.
This is the risk inside the shift. Buying the most popular US names can swap ASX home bias for a heavy bet on a handful of US tech giants.
The long record, though, paints a wider picture. Morningstar data for the decade to June 2025 shows US equities returned about 15.5% a year, global shares about 12.5%, and Australian shares about 11.1% including estimated franking.
Morningstar’s home bias research also tests how franking credits affect Australian equity returns over 10, 20 and 30-year periods, a longer lens than the single decade comparison and one that income-focused investors should weigh.
| Source | Position | Reasoning |
|---|---|---|
| Morningstar | Strong home bias is understandable but costly | Global diversification outperformed over the decade to June 2025 |
| Vanguard | Home bias is strongest among income investors | Median adviser allocation of 48% to Australian assets versus roughly 35-37% in its diversified funds |
| Betashares | Diversify beyond Australia | Access to companies and themes not listed on the ASX |
| AMP | Offshore exposure is useful, but expect moderation | Stretched US valuations, political risk and AI bubble concerns |
AMP, including chief economist Shane Oliver, points to the 2000-03 tech wreck, when Australia’s low technology exposure helped relative performance. That lesson cuts both ways: thin tech exposure protects in a bust but leaves you short during a tech-led expansion.
Active stock-picking adds another data point. The Morgan Stanley Global Leading Ideas model portfolio, a hypothetical 43-stock portfolio with eight of its top ten holdings US-listed, returned 19.35% a year since its May 2023 inception against 16.34% for its MSCI World ex Australia benchmark, and 9.73% over the past 12 months against 4.29%. A separate report put its return at 20.98% annualised over the three years to May 2026. These figures are in AUD, gross of fees and exclude franking, and they do not prove concentrated active portfolios always win.
Past performance does not guarantee future results. Financial projections are subject to market conditions and various risk factors.
A one-day drop of this size shows you what holding concentrated US tech actually feels like. Before you raise exposure, ask whether you could hold through that kind of fall.
Building a balanced portfolio: income at home, growth offshore
The evidence points away from choosing a side. The stronger approach combines Australian income assets with diversified global growth exposure, rather than concentration in either market.
Local shares still earn their place for specific reasons:
- Franked dividends, which Morningstar data suggests keep Australian equities competitive for investors who can fully use the credits
- A natural match for spending and liabilities in Australian dollars
- Banks, resources and infrastructure businesses that can behave differently from US growth stocks
- Familiar legal and regulatory settings
Yet a portfolio built only on the ASX is a bet on a market that is 1.5% of global equities, with 58.7% sitting in financials and materials. That is concentration too, just a more familiar kind.
Four questions can shape your mix:
- How much income do you need? Higher income needs favour franked local dividends.
- What is your tax position? Franking value depends on your marginal rate and ability to use credits.
- Do you want currency exposure? Betashares notes hedged and unhedged products handle the AUD differently, so pick one on purpose.
- Broad fund or direct US stocks? A global index fund spreads risk; a few direct US names concentrates it and adds paperwork, including estate-tax exposure.
Whatever your mix, a portfolio heavy in either the ASX or a handful of US tech names is a concentrated bet. Your tax residency and risk tolerance will shape the answer, so decide which concentration you are willing to carry.
What to weigh before your next offshore trade
The move toward US stocks among Australian investors is real, and the structural case behind it is sound: the ASX lacks technology depth that no local cycle will quickly fix. But the costs are specific and measurable, from 15% withholding and missing franking to a currency position you may not have chosen.
Three variables deserve your attention from here. AI earnings and capital spending news will set the tone for US tech after this week’s rout. The AUD/USD rate will quietly add to or subtract from every unhedged holding. And any growth in ASX technology depth would change how much of your growth exposure needs to sit offshore.
This article is for informational purposes only and should not be considered financial advice. Investors should conduct their own research and consult with financial professionals before making investment decisions.