
A falling VIX feels like the all-clear. Yet the calmer the front of the volatility curve becomes, the more the gap between three-month and spot volatility may be signalling, and a sudden widening of that gap, sometimes called a VIX contango thrust, has behaved very differently depending on the era in which it fired.
October gave that signal a live test. The Nasdaq fell 5.3% for the month, and the VIX closed October at 19.42, according to Cboe. Traders are now watching the post-midterm window that historically starts in November.
A tastylive study has flagged a possible contango thrust reading in recent sessions. If you are deciding how much weight to give the calm, that makes the signal worth testing now rather than after the fact.
Here is what 84 historical readings say about the following week, month and three months, why the financial crisis distorts the average, and how far the signal can reasonably be stretched in today’s market.
What is the VIX3M minus VIX spread, and why does a sudden widening matter?
On a screen, the spread is one number: three-month volatility minus spot volatility. The VIX measures the volatility the market expects over the next 30 days, priced from S&P 500 options. VIX3M does the same over three months. When VIX3M sits above VIX, the gap is positive, and a jump in that gap in a single day is what traders call a thrust.
Contango versus backwardation in one minute
Contango means longer-dated volatility is priced above near-term volatility. Backwardation is the reverse, with near-term volatility priced higher. According to Cboe, the VIX futures curve has been in contango more than 80% of the time since 2010 and in backwardation less than 20% of the time.
That persistent premium reflects structural contango: spot VIX cannot be bought directly, so futures carry a built-in premium that hedging demand keeps in place.
Backwardation is the unusual state. It shows up when demand for immediate downside protection runs well above normal, usually during a selloff.
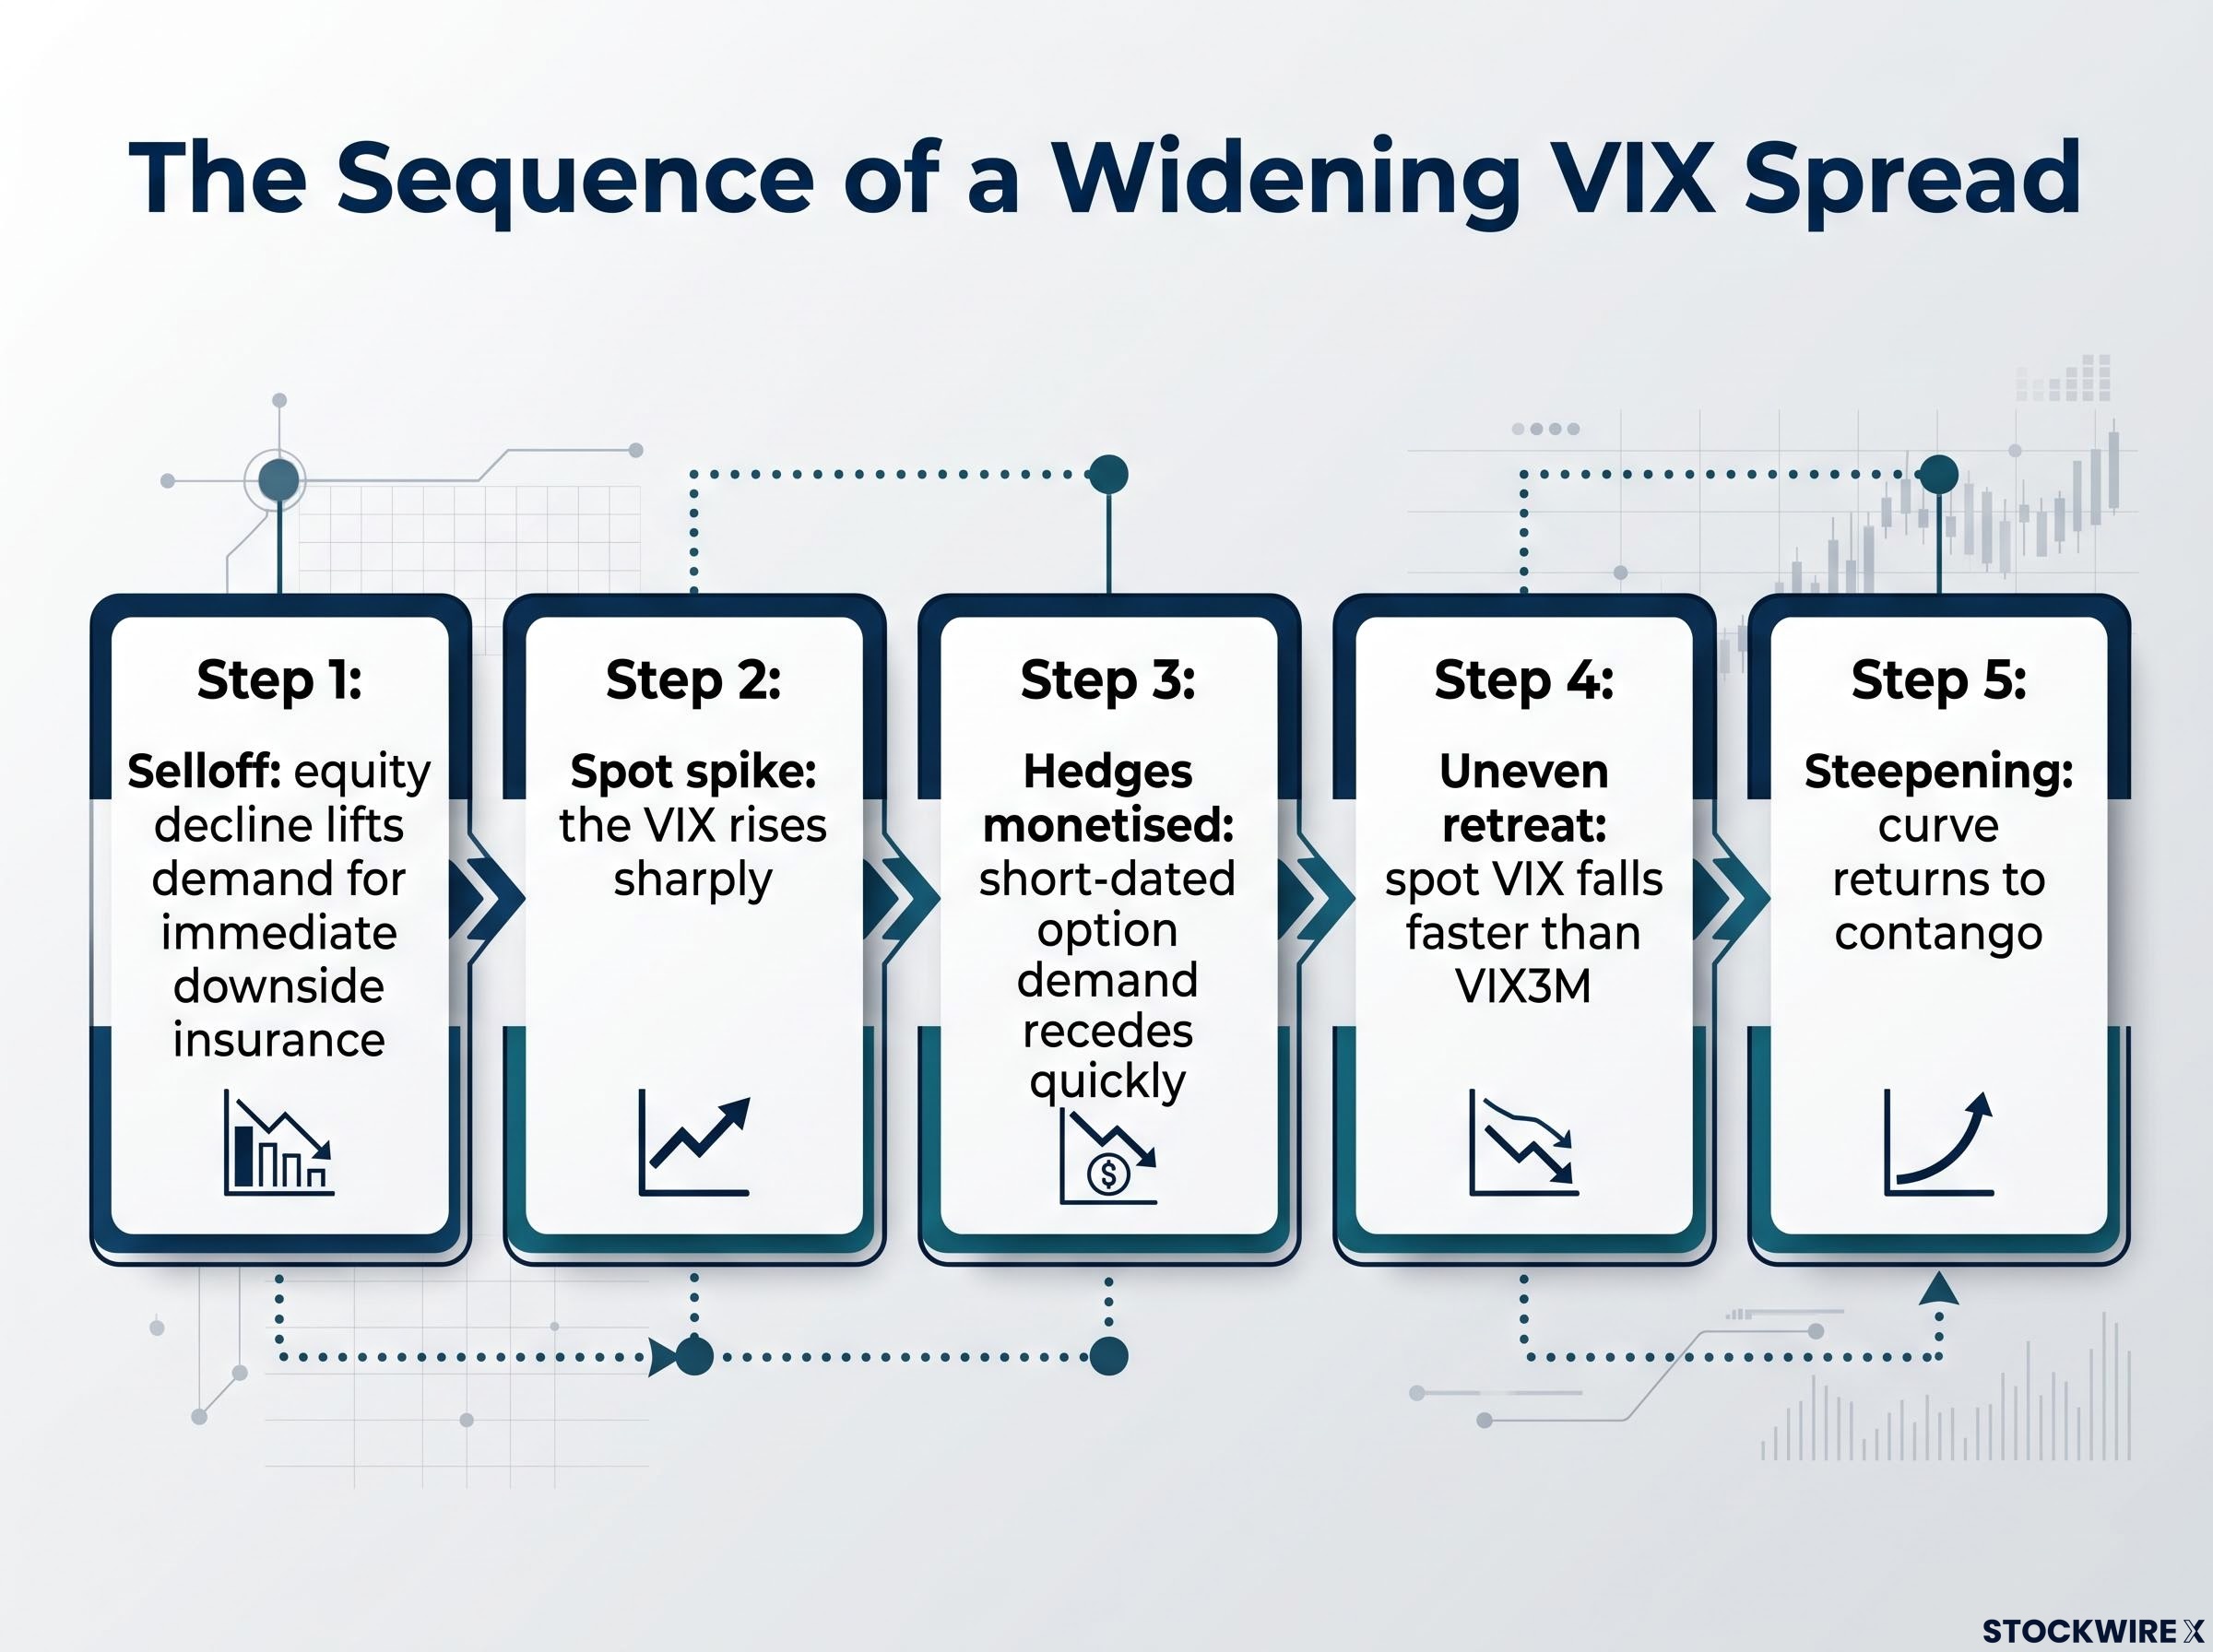
The widening follows a recognisable sequence:
- Selloff: a sudden equity decline lifts demand for immediate downside insurance.
- Spot spike: the VIX rises sharply.
- Hedges monetised: once the catalyst is absorbed, short-dated option demand recedes quickly.
- Uneven retreat: spot VIX falls faster than VIX3M, because three-month options still price uncertainty about earnings, policy and rates.
- Steepening: the curve returns to contango or steepens further into it.
Late October showed the pattern clearly. Saxo reported spot VIX falling faster than the November futures contract, lifting the futures premium from 0.73 to 1.48 points. The VIX3M/VIX ratio moved from 1.05-1.08 on 27 October to 1.12 on 28 October.
By month end, Cboe data showed VIX at 19.42 and VIX3M at 20.78, a spread of 1.36 points, and Saxo put the ratio at just 1.02 on 3 November. On 17 September, a Fed meeting day, a tastylive presenter labelled a 1.09-point jump a “contango thrust.”
Normalisation, not a green light A widening spread shows the market pricing stress as temporary. It does not mean valuation, earnings or macro risk has gone away.
A widening tells you professional hedgers are paying less for immediate protection. That is a statement about fear, not about whether stocks are cheap or the next earnings season is safe.
When big ASX news breaks, our subscribers know first
What do 84 signals since 2007 say about forward S&P 500 returns?
The tastylive dataset counts 84 occurrences of a one-day widening of 1.55 points or more since December 2007. It spans the financial crisis, the European debt crisis, the 2011 US downgrade, Volmageddon, the Q4 2018 selloff, COVID and the 2022 inflation selloff.
The headline result looks unremarkable. Across the full history, the S&P 500 averaged -0.42% a week later (median +0.31%), +0.98% after one month and +3.11% after three months (median +4.12%), finishing higher 63% of the time.
The one-week figures stay thin in every sample:
- Full history: -0.42% average
- 2008-2009: -2.44%
- 2009-2019: +0.47%
- Since 2010: +0.3%
- Since 2020: +0.11%
The picture changes when the crisis years are separated out.
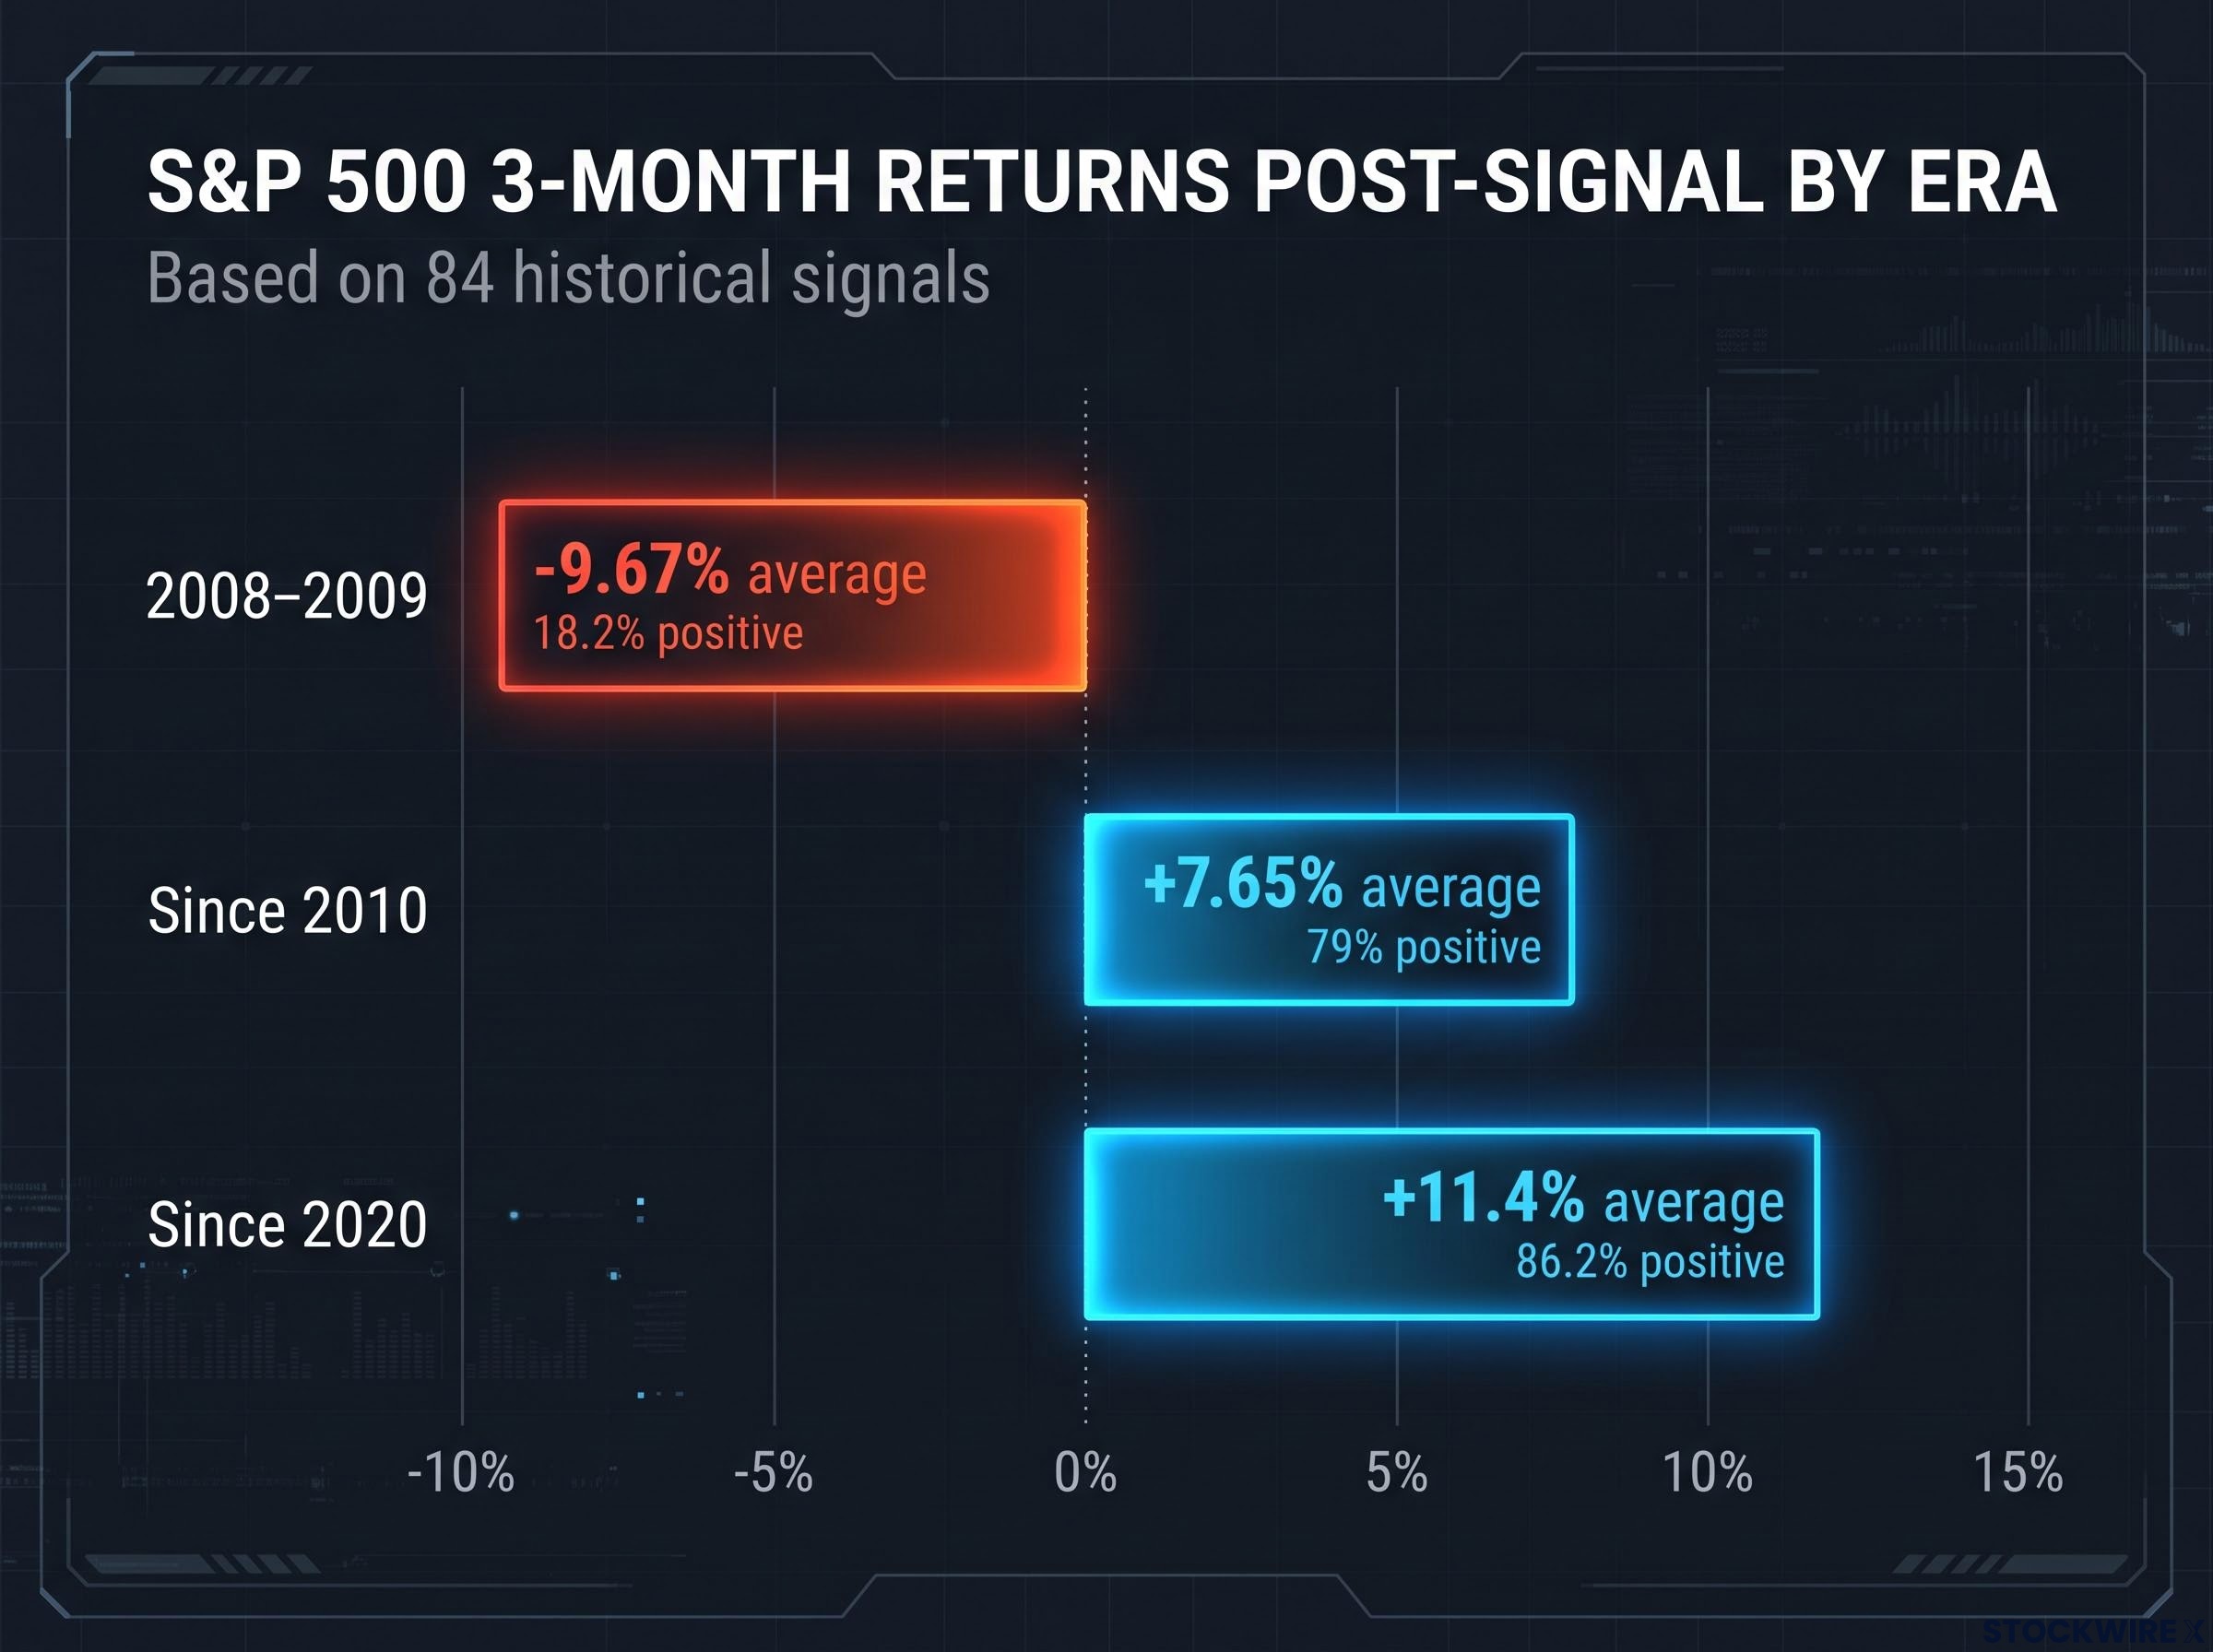
| Sample | Signals | 1 month | 3 months | % positive (3 months) |
|---|---|---|---|---|
| Full history | 84 | +0.98% | +3.11% | 63% |
| 2008-2009 | 22 | -4.27% | -9.67% | 18.2% |
| 2009-2019 | 33 | +1.36% | +4.4% | Just under 73% |
| Since 2010 | 62 | About +2.85% | +7.65% | 79% |
| Since 2012 | 47 | +3.92% | +9.27% | 87.2% |
| Since 2020 | 29 completed | +4.54% | +11.4% | 86.2% |
The 22 signals from 2008-2009 averaged -9.67% over three months, with only 18.2% positive. Move the start date forward and the record improves at each step, peaking at +11.4% since 2020.
Why the financial crisis skews the average
During systemic deleveraging, the curve can re-steepen again and again while bank and credit stress keeps building. Each relief moment fires the signal, and each one fails. Post-crisis spikes have tended to be event-driven, and they burn out once the catalyst passes.
Averages can also be dominated by a handful of large recoveries, such as 2009, 2020 and 2022-23. Broader research points the same way: T. Rowe Price found elevated VIX readings were followed by higher average long-term returns but much wider dispersion, and a 2019 academic study described VIX futures term structure as a possible contrarian timing indicator.
The pattern tells you the signal has historically worked over the medium term, not the next week. Which regime you believe you are in matters more than the signal itself.
Where does the signal fail, and how reliable are these statistics?
The table looks persuasive. The episodes behind it are messier, and Cboe cautions that curve signals do not consistently predict weakness or recovery outside the largest selloffs.
| Episode | What happened | Lesson |
|---|---|---|
| 2008 crisis | Repeated normalisation attempts failed as credit deteriorated; 22 signals, -9.67% average | The strongest warning against mechanical use |
| 2011 debt crisis | Backwardation reflected heavy near-term hedging before an eventual recovery | A tradable low can arrive after a non-linear decline |
| Feb 2018 Volmageddon | Short-volatility losses forced deleveraging | Positioning can overwhelm curve signals |
| Q4 2018 | Backwardation through the selloff, then a sharp rebound | The exact low was not identified |
| 2020 pandemic | Front futures traded above later months as the shock worsened | Systemic shocks can deepen before recovery |
| 2022 rate shock | Normalisation showed acute stress fading | Recovery was uneven |
Three ways to read the same curve
Mean reversion: a rapid drop in spot VIX shows forced hedging has peaked, which can line up with an attractive entry. Temporary relief: the market has paused, and VIX3M stays elevated because the risks remain unresolved. Regime shift: the steepening marks a move from acute panic to slower, persistent volatility rather than a durable bottom.
Statistical weak points
- Small samples relative to the number of market regimes
- Overlapping one-day observations that are not independent
- Threshold sensitivity, since results may shift away from 1.55 points
- Data-mining risk from testing many spreads, holding periods and entry rules
- Selection bias toward memorable successes
- Timing gap: the signal can catch a volatility rebound without catching the equity low
The exact 1.55-point one-day widening could not be found in an accessible primary publication. This is a single-source study.
You should treat the signal as one input that raises the odds of a medium-term rebound in event-driven selloffs, never as a standalone trigger. The cases where it fails are the ones that cost the most.
What does the signal imply for today’s post-midterm market?
On 30 October, the S&P 500 fell 1.8% to 7,580.07 and the Nasdaq dropped 2.9%, according to AP. The VIX hit an intraday high of 23.93 before closing just below 20, and Saxo’s data showed the curve normalising.
The signal itself is not settled. Tastylive tracked a widening of roughly 1.56 to 1.68 points, but Cboe and Saxo data through 4-5 November showed no confirmed widening of that size, and Cboe’s month-end spread was 1.36 points. The reading was flagged by one study and remains unconfirmed in published data.
Sources also differ on the Nasdaq. The tastylive presenter cited a weekly fall near 9%, while AP reported 2% for the week ending 30 October; this analysis uses AP.
Credit: broad calm, CCC stress
Broad high-yield option-adjusted spread (OAS), the extra yield over Treasuries, stood at 3.40% on 3 November, according to TheTrading.Tools. High-yield ETFs HYG and JNK rose 0.12% and 0.11% that day. CCC-and-lower OAS was 13.16%, the 99th percentile of that source’s history since October 2023.
That split points to technology de-risking rather than a generalised credit panic.
19 of 19 Pepperstone and JPMorgan Asset Management report the S&P 500 was positive in all 19 post-midterm 12-month windows since 1950, averaging 15.1%. Nineteen observations is a small sample, not a reliable trading rule.
CNBC data covering 1980-2024 shows smaller near-term gains: 0.2% after one week, 1.1% after one month and 13.7% after one year. BlackRock cites a 14.1% six-month average, and Fidelity counts gains in roughly 95% of 12-month periods since 1938.
| Factor | Reading | Constructive or cautionary |
|---|---|---|
| VIX curve | Normalising toward contango; ratio 1.02 on 3 November | Constructive |
| Broad credit | OAS 3.40%; HYG and JNK stable | Constructive |
| CCC credit | OAS 13.16%, 99th percentile | Cautionary |
| Post-midterm seasonality | 19 of 19 positive, average 15.1% | Constructive, small sample |
| Nasdaq concentration | Down 5.3% in October | Cautionary |
Short term versus medium term
Over the next week, nothing in the evidence assures a rally, and a stall near current levels would fit the record. Over three to twelve months, the picture is constructive but probabilistic. The tastylive presenter estimates a further 5%+ Nasdaq drop roughly 47% of the time in a true crisis, notes that strong 12-month entries have historically come within 5% of an all-time high, and runs a directionally neutral position, one trader’s approach rather than a recommendation.
What this means for you is that conditions favour a patient, medium-term lean over a short-term trade. The CCC divergence and small seasonal samples are reasons to size positions for being wrong.
Earlier in the year, technology de-risking also showed up as sector rotation, when the Nasdaq’s July decline came while the S&P 500 and Dow finished positive.
What the signal changes, and what it does not
The contango thrust points to fading acute stress and a constructive three-month record outside the crisis years. It does not time a low, and it should not stand alone as a rule.
Three variables will tell you whether the backdrop is holding:
- The spread: whether VIX3M minus VIX holds or widens in published Cboe data
- CCC spreads: whether lower-quality credit stress eases from the 99th percentile
- Nasdaq selling: whether technology de-risking stabilises
If you are weighing short-term against medium-term exposure, the evidence leans toward patience over prediction. The signal improves the odds over months, not days. These statements are speculative and subject to change based on market developments, and past performance does not guarantee future results.
This article is for informational purposes only and should not be considered financial advice. Investors should conduct their own research and consult with financial professionals before making investment decisions.