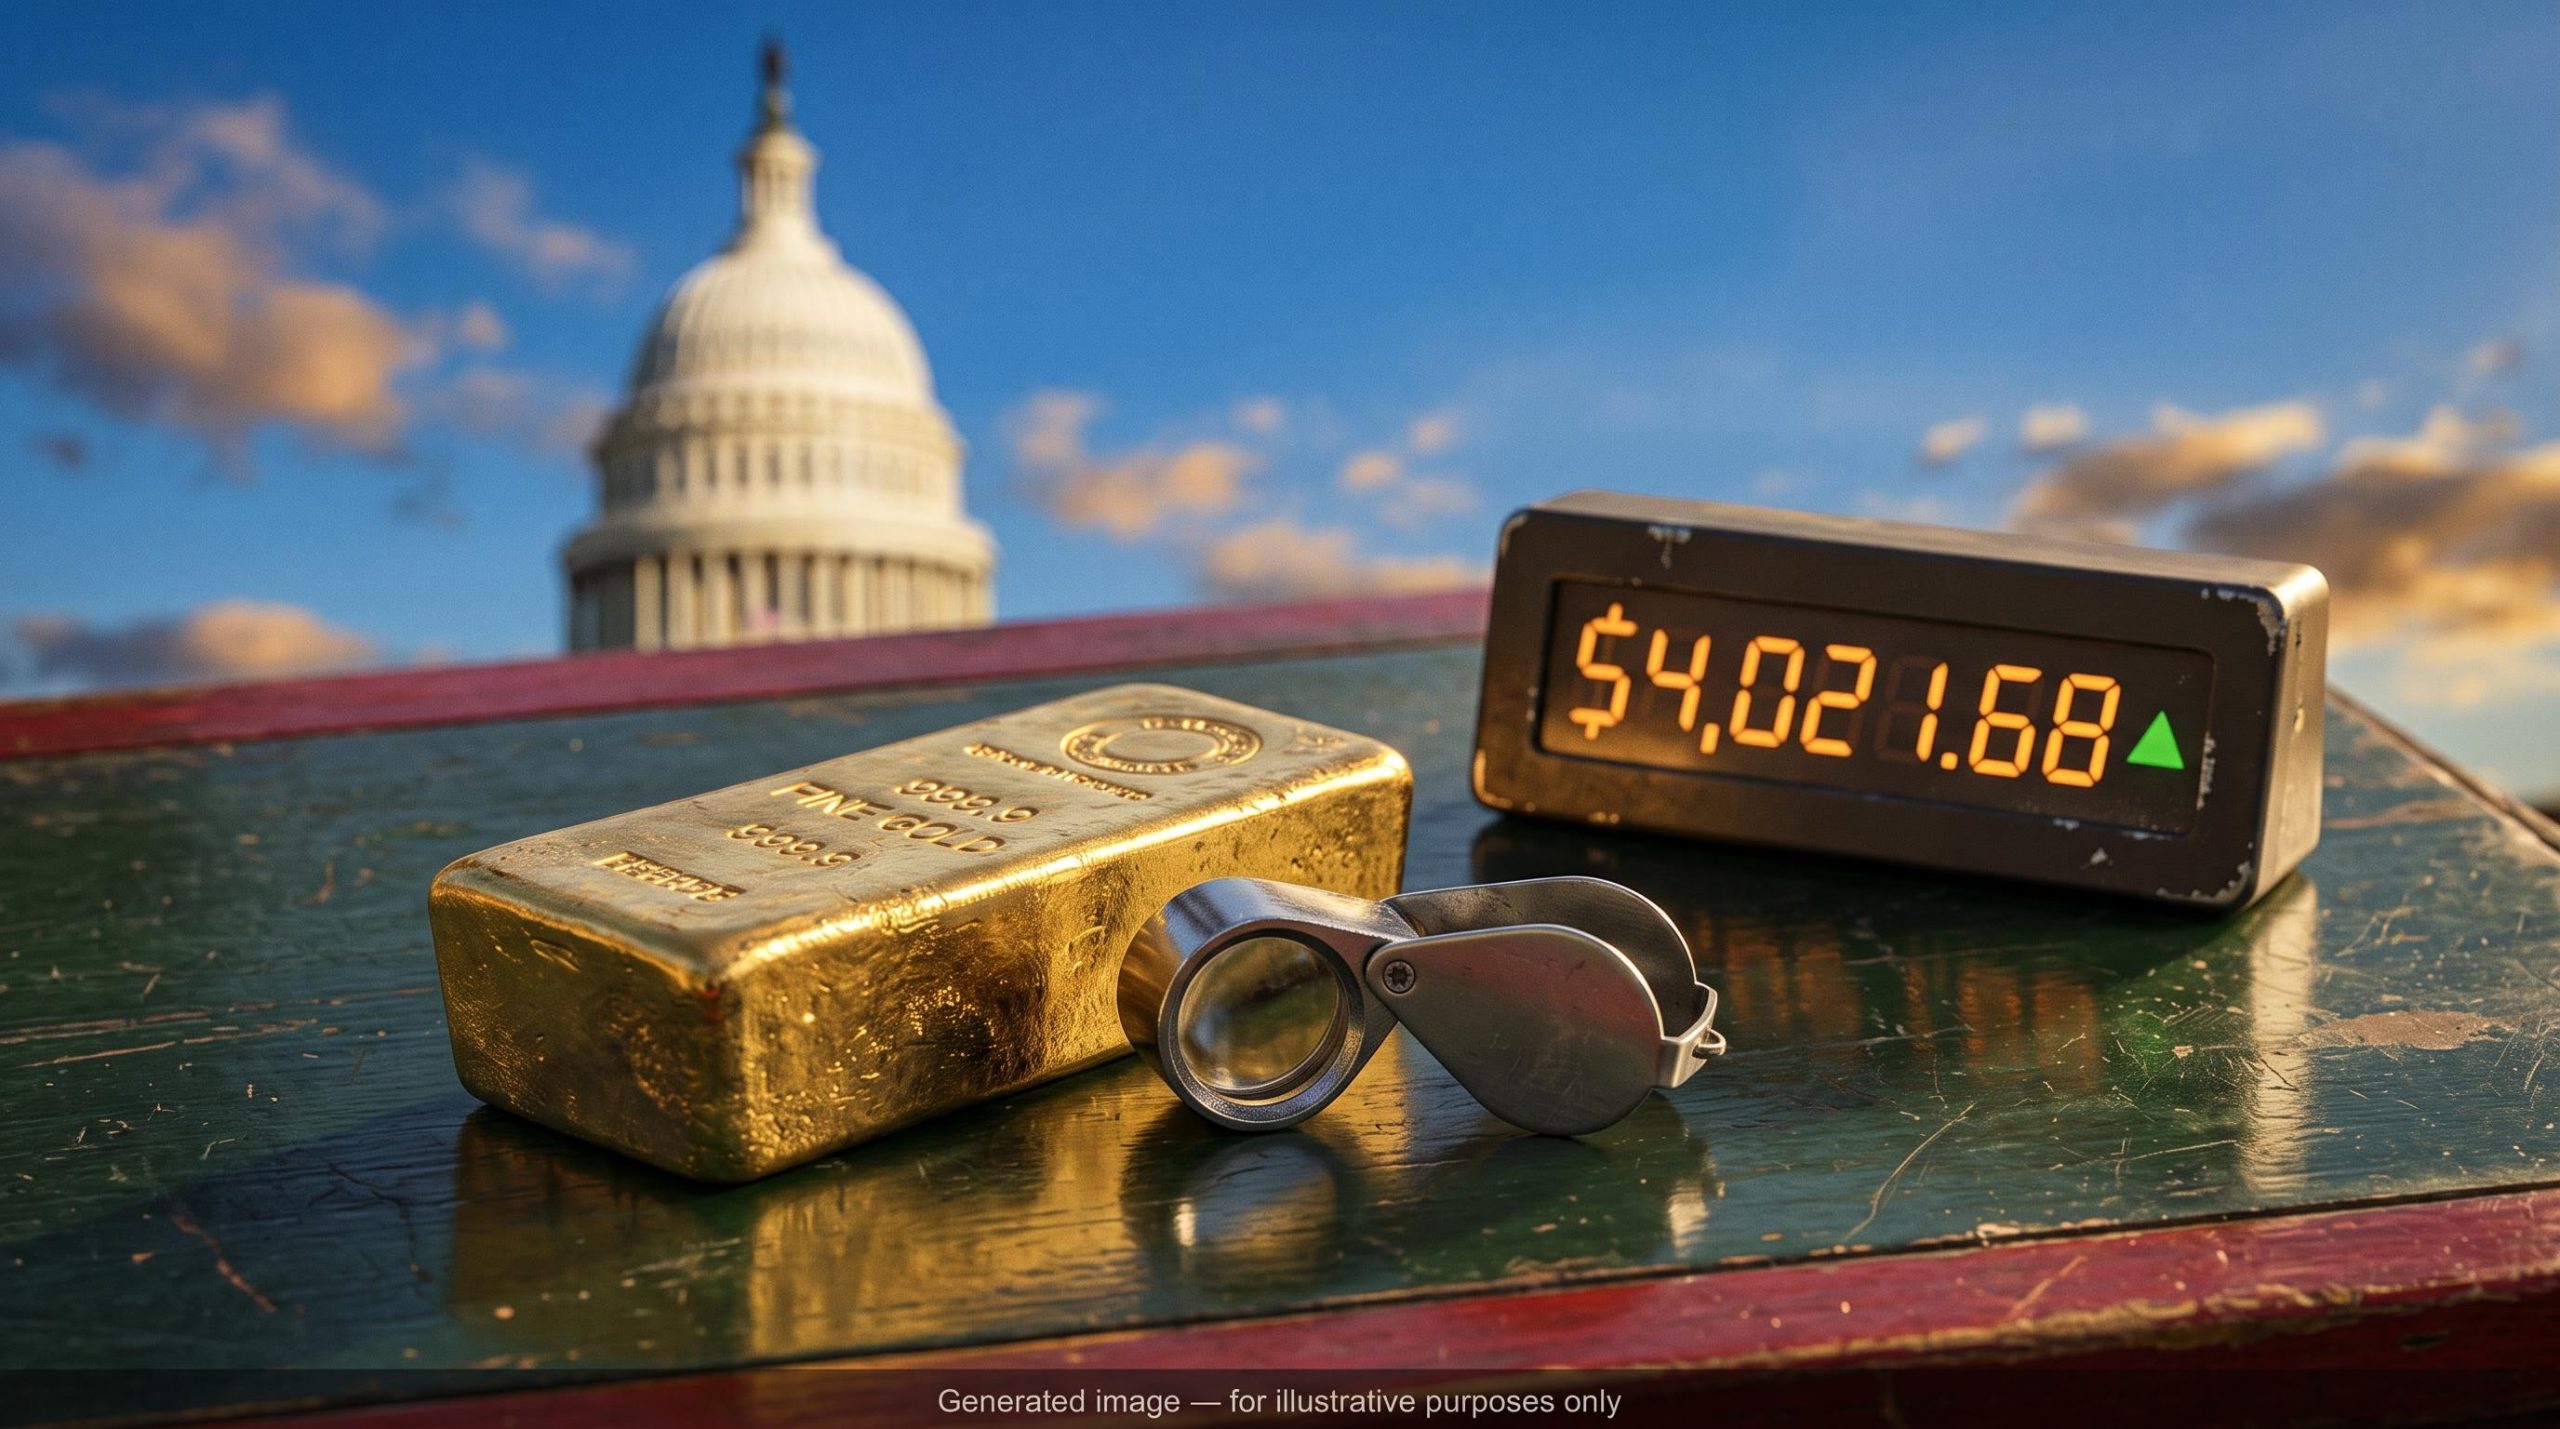
Democrats swept both chambers of Congress on 3 November, and the bond market did not react the way many investors expected. The common assumption was that a populist Congress would mean heavier spending and higher yields. Instead, Treasury yields fell, the dollar slid and the gold price pushed back through $4,000 in the session after the midterms, with spot gold at $4,021.68, up 2.4% on 4 November.
The rebound follows a painful stretch. Gold touched about $3,870 on 30 October, its lowest level in more than a year, so the post-election move is a recovery from a selloff rather than a fresh breakout.
The more important issue is the outcome itself. The same result can be read as bullish or bearish for rates and gold, depending on what you assume about government spending and the artificial intelligence (AI) investment boom.
Here is how to weigh the competing forces: which ones point to higher gold and a weaker dollar, which ones could push yields either way, and what evidence would settle the argument.
Why did gold fall to a one-year low and then rebound after the midterms?
The puzzle is simple to state. Gold lost 10.1% over the six months before the election, according to an election-market review from Futunn and Strategitz. It then bounced about 3.9% from its 30 October low of $3,870.27 in just a few sessions. Several explanations are circulating, and they do not all hold up equally well.
| Market | Latest reported level | Post-election move |
|---|---|---|
| Spot gold | $4,021.68/oz | Up 2.4% |
| 10-year Treasury | 4.89% at one reported close | Down 6 bp after an initial rise |
| 30-year Treasury | 5.279% | Down 4.5 bp from a 5.3448% high |
| US Dollar Index | Exact level not reported | One-month low; sharpest decline in two months |
A basis point (bp) is one-hundredth of a percentage point, so a 6 bp fall takes a yield from 4.95% to 4.89%.
What the evidence supports on the selloff
The panel discussion behind this debate offered three causes: a broad risk-off trade, hedge fund deleveraging, and Middle Eastern selling to defend currencies.
Reuters reporting supports the deleveraging story in broad terms, describing forced selling as investors cut leveraged positions to cover losses in technology stocks. No one has published a quantified hedge fund estimate, however. The Middle Eastern selling claim could not be substantiated at all.
The central bank angle cuts the other way. Bloomberg reported that the World Gold Council (WGC) said central banks were buying at their fastest pace since 2024, which undermines any simple story about official sellers. Reuters also linked earlier weakness to higher energy prices, which lifted expectations that the Federal Reserve would keep rates higher for longer and raised the cost of holding a metal that pays no income.
What drove the rebound
Reuters attributed the post-election gain mainly to the weaker dollar. Traders were also waiting on US payroll data for signals on Fed policy. Concern that a Democratic Congress could disrupt the data-centre buildout pressured technology positions, and that pressure spilled into gold.
Read together, the selloff looks more like a liquidity and rates event than a collapse of the gold thesis. The dip was not a verdict on the long-run case, but it does show how sensitive gold remains to real yields, meaning bond yields after inflation.
Gold’s sensitivity to real yields explains why a rate path matters less than inflation expectations: when nominal yields rise slower than expected inflation, the opportunity cost of holding bullion shrinks, even during an aggressive tightening cycle.
When big ASX news breaks, our subscribers know first
How could debasement and a debt supply glut push gold, yields and the dollar in different directions?
To see why one election can lower yields now while still supporting gold later, it helps to build the mechanism one step at a time.
The debasement chain
Currency debasement means the gradual loss of a currency’s purchasing power. Commentators describe it as a four-step chain:
- Persistent deficits force the Treasury to keep borrowing.
- Rising interest expense adds to future borrowing needs.
- Real value erodes if inflation, nominal growth or easy monetary policy shrinks the debt burden, so dollars and bonds buy less.
- Investors shift toward scarce assets outside government control, such as gold.
None of this requires literal money printing. A weaker dollar can come from lower expected real returns, fading confidence in fiscal discipline, political pressure on the Fed or narrowing US rate advantages.
The second mechanism is supply. The term premium is the extra yield investors demand for holding long-dated bonds instead of rolling short-dated ones. When issuance outpaces demand from banks, pension funds, insurers and foreign reserve managers, that premium rises. J.P. Morgan Private Bank estimated the Treasury would issue more than $30 trillion in bills, notes and bonds in 2026, with AI-related corporate borrowing adding to bond supply.
That is where the panel’s two-sided yield argument comes in. If both Washington and the hyperscalers (the largest cloud and AI spenders) borrow less, competition for savings eases and long-end yields can fall. That would support gold and weaken the dollar.
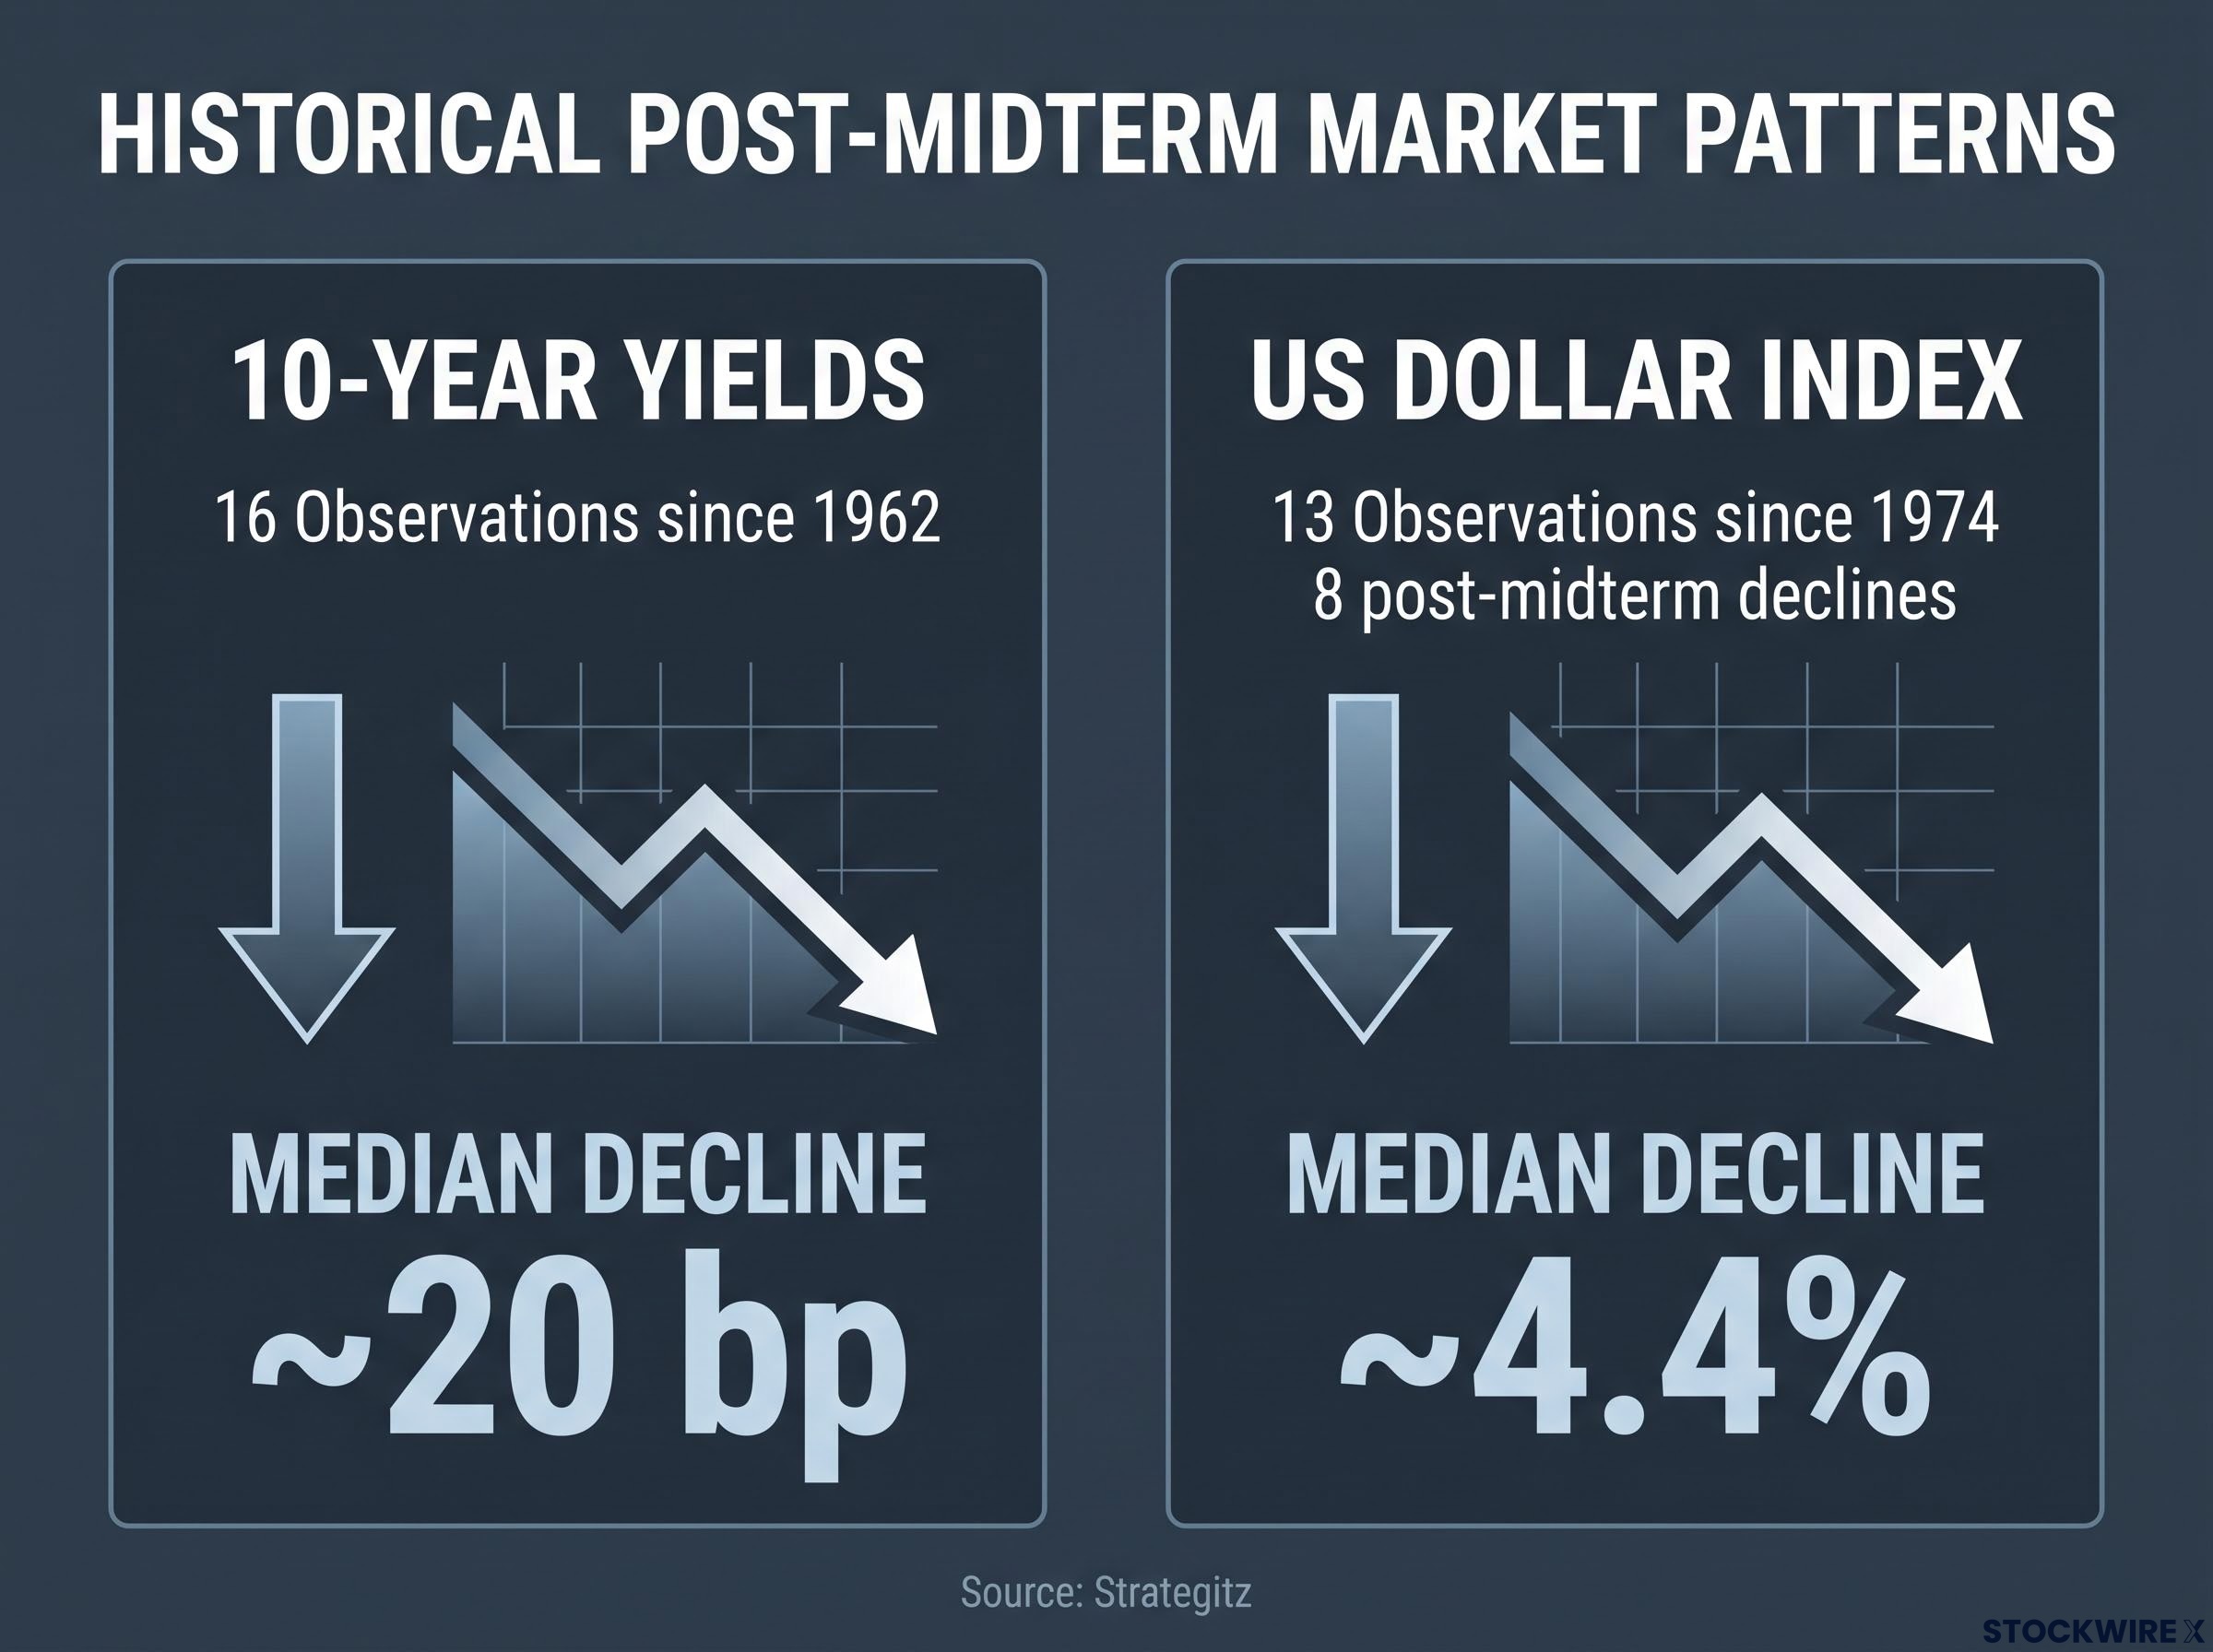
Midterm track record Across 16 observations since 1962, 10-year yields fell in the six months after midterms, with a median decline of about 20 bp (Strategitz).
The dollar has a similar pattern. Across 13 observations since 1974, the dollar index fell in eight post-midterm periods, with a median decline of about 4.4%.
Early midterm results showed the S&P 500 has risen in the 12 months after every midterm since 1950, with party control making almost no difference to the average, a reminder that valuations and Fed policy tend to outweigh the vote itself.
Why gridlock is not fiscal repair
The institutions disagree on what divided government actually delivers.
| Institution | View on gridlock | Implication |
|---|---|---|
| J.P. Morgan Asset Management | Limits new stimulus; the roughly $2 trillion FY26 deficit is unlikely to shrink much | Contained yield pressure |
| Brown Brothers Harriman | Political gridlock is not automatically fiscal gridlock | Issuance and interest costs can lift the term premium |
| Schroders | Unlikely to produce fiscal consolidation | Dollar may weaken initially; a deficit-raising deal would lift long yields |
| World Gold Council | Could block deficit-expanding laws | Supports Treasuries and possibly the dollar |
| Lombard Odier | Limits major tax or spending bills | Lower long yields and real yields support gold |
The panel pointed to 1962-1982 as a populist era. The 1960s and 1970s showed how fiscal expansion combined with pressure for easy money wore away the real value of money.
The takeaway for you is to treat gold as a bet on real yields and fiscal credibility rather than on any single election. The gridlock that eases yields now does nothing to repair the deficit underneath.
Is the economy really leaning on the data-centre buildout?
The panel’s thesis is that US growth rests heavily on data-centre investment. If that is right, any slowdown in the buildout would reach growth expectations, rates and safe-haven demand all at once. Reuters reported that investors feared a Democratic sweep could disrupt both the buildout and the broader technology trade.
Data centre approvals are largely decided by state and local authorities rather than Congress, which may make the AI trade less sensitive to the election result than the Reuters-reported fears implied.
Voters added a second source of friction. Results varied by tracker:
- CNBC: 41 local measures in 10 states, with voters siding against data centres in every contest with results except Harwood, North Dakota.
- Another tracker (WXII): 45 measures, with 44 restricting or rejecting development.
- Edgewater, Florida: approved a ban on new data centres with more than 77% of the vote.
- Ashville, Ohio: rejected a two-facility project with more than 81%.
The October data from the Institute for Supply Management (ISM) complicate the picture. The purchasing managers’ index (PMI) is a monthly survey in which readings above 50% signal expansion.
| Indicator | Manufacturing | Services |
|---|---|---|
| PMI | 55.5% (from 54.5%) | 54.5% (from 54.9%) |
| Backlogs | 54.6%, down 1.8 points | 58.0%, highest since July 2022 |
| Inventories | 51.4%, up 2.8 points | 55.4%, still accumulating |
The panel described weakening manufacturing backlogs and swelling inventories. The backlog drop is real, but manufacturing has now expanded for ten straight months, and inventories moved back into expansion rather than ballooning. Services backlogs sit at a multi-year high.
The dependency exists, but the evidence points to friction rather than collapse. Watch backlogs and local approval trends instead of assuming either an AI-led boom or an AI-led bust.
Will the next crisis get a monetary-only or a fiscal response?
Strip the analysis back and one open question remains. The panel noted that crises have mostly been met by the Fed acting alone, with COVID the exception, when Washington added large-scale fiscal support. Which path the next crisis takes will shape all three assets.
History offers two templates. After 2008, monetary policy did most of the stabilising, real yields fell sharply and gold benefited, while limited fiscal expansion kept inflation in check. During COVID, the Fed and Congress acted together. Gold rallied early, then yields climbed as inflation and issuance took over.
| Response | Gold | Yields | Dollar |
|---|---|---|---|
| Monetary-only response | Supported by falling real yields | Lower, led by easing | Likely softer |
| Fiscal response | Early support, then tested by rising yields | Higher later on inflation and issuance | Contested |
Kevin Warsh has chaired the Fed since 22 May 2026. The central bank held its target range at 3.75%-4.00% in October, and Warsh defended the institution’s independence and its 2% inflation goal. Reports that Treasury Secretary Bessent warned in April of a coming Treasury crisis needing a response facility could not be verified, so they should not be treated as fact.
The FOMC October statement ties the decision to hold rates to the Committee’s commitment to price stability, a framing that matters for gold because it signals how far policymakers will tolerate real yields drifting from the inflation goal.
Price targets show how conditional the bull case is. Goldman Sachs cut its 2026 year-end gold target to $4,900 from $5,400. JPMorgan Global Research sees $6,000 only if rates pricing allows. Past performance does not guarantee future results, and these projections remain subject to market conditions and other risk factors.
The counterarguments deserve equal weight:
- A stronger dollar could come from US growth resilience, safe-haven demand or higher relative yields.
- Gold may look overvalued when real yields are high or positioning is crowded.
- Yields could rise despite gridlock as oil, the expected Fed path, safe-haven flows, defence spending and refinancing needs exert their own pressure.
Hold your gold and rates views as conditional on the crisis response. The practical task is spotting the signals, such as real yields, issuance plans and the tone of the Fed-Treasury relationship, that would show which branch has been chosen.
Weighing the gold price after the midterms: what to watch next
The three-asset picture is now clearer. Gold has a near-term upward bias, while its long-run case depends on deficits and real yields. Yields can move in either direction. The dollar sits at a one-month low, with credible arguments for further weakness and for a rebound.
Remember that the initial fall in yields was only partly about gridlock, since oil, the Fed outlook and safe-haven demand also played a role. The debt problem remains unresolved.
Four signals should tell you which forces are winning:
- Treasury long-end issuance decisions, and whether supply is trimmed
- Real yields, the single biggest swing factor for gold
- Data-centre approval trends and manufacturing backlogs, as a read on AI-led growth
- Any Fed-Treasury response framework, which would reveal how the next crisis is likely to be handled
This article is for informational purposes only and should not be considered financial advice. Investors should conduct their own research and consult with financial professionals before making investment decisions.