The ASX 200 has shrugged off most geopolitical shocks in a matter of weeks. The sell-off that followed the outbreak of the Iran war in early 2026 was different: it took 158 days to recover. That gap challenges a comfortable assumption about how geopolitical shocks play out on the ASX, which is that markets always bounce back fast.
On 9 March 2026, a week into the conflict, the index fell almost 3%, its largest one-day drop in nearly a year. From its late-February level, the fall reached 8.4% at its lowest point.
Investors were already uneasy. In Morningstar’s State of the Australian Investor 2026 survey, more than 52% of respondents named geopolitical tension as a top concern, ranking it first.
Here is what nine shocks since 2001 actually tell you: when a sell-off calls for a portfolio change, and when it is mostly noise.
What did nine geopolitical shocks since 2001 did to the ASX?
Morningstar’s Joshua Groot tracked the STW ETF, which follows the S&P/ASX 200, across nine geopolitical and trade shocks. The analysis uses total returns, which include distributions, measured from the last close before each event, with data to 28 October 2026. Read down the columns before reaching the final row.
| Event | First-day move | Max fall | Recovery | 12-month return |
|---|---|---|---|---|
| Sep 2001 attacks | -4.1% | -10.1% | 43 days | -0.5% |
| Mar 2003 Iraq invasion | +0.8% | None | 0 days | +25.0% |
| Mar 2014 Crimea | -0.2% | -1.9% | 31 days | +14.2% |
| Feb 2022 Ukraine | -2.5% | -2.5% | 8 days | +5.8% |
| Oct 2023 Israel-Hamas | +0.3% | -2.5% | 28 days | +21.4% |
| Apr 2024 Iran-Israel strikes | -0.4% | -2.8% | 25 days | +1.7% |
| Apr 2025 US tariffs | -0.9% | -7.4% | 22 days | +11.7% |
| Jun 2025 US strikes on Iranian nuclear sites | -0.3% | -0.3% | 4 days | +7.2% |
| Mar 2026 Iran war | +0.1% | -8.4% | 158 days | Not yet available |
The base rate Median fall: 2.5%. Median recovery: 25 days.
The pattern is consistent. Seven of the eight events with a full year of data finished higher 12 months later, and when the Iraq invasion began in 2003, the ASX actually closed up. A major geopolitical event does not automatically mean a market fall.
The one negative year, after September 2001, arrived during a broader 2001-2002 global downturn. Its weak result cannot be pinned on the attacks alone.
Where the 2026 sell-off sits in the record
Then comes the outlier. The Iran war’s 8.4% maximum fall ranks second only to September 2001’s 10.1%. Its 158-day recovery is more than three times the previous longest of 43 days, and more than six times the 25-day median.
Groot cautions that rates, earnings, China’s economy, commodity prices, policy and valuations shaped every period, so no single event’s effect can be isolated. Past performance is not a reliable indicator of future performance. What the record tells you is that a headline-driven sell-off has usually been a short interruption for long-term holders, but 2026 shows the length of the recovery is never guaranteed.
When big ASX news breaks, our subscribers know first
Why did the 2026 Iran war sell-off take so long to recover?
The answer lies in what kind of shock it was. Earlier events were mostly brief military or political episodes. The Iran war became a continuing disruption to energy supply and shipping, and it was still unresolved in late October with Brent crude around US$115 a barrel.
The Reserve Bank of Australia (RBA) set out the mechanism in a May speech on inflation and the Middle East conflict.
How the RBA sees it Dearer oil and gas raise transport, production and household costs, and those costs flow through faster when the domestic economy is already running near capacity. A drawn-out shock risks lifting inflation expectations and calling for tighter monetary policy.
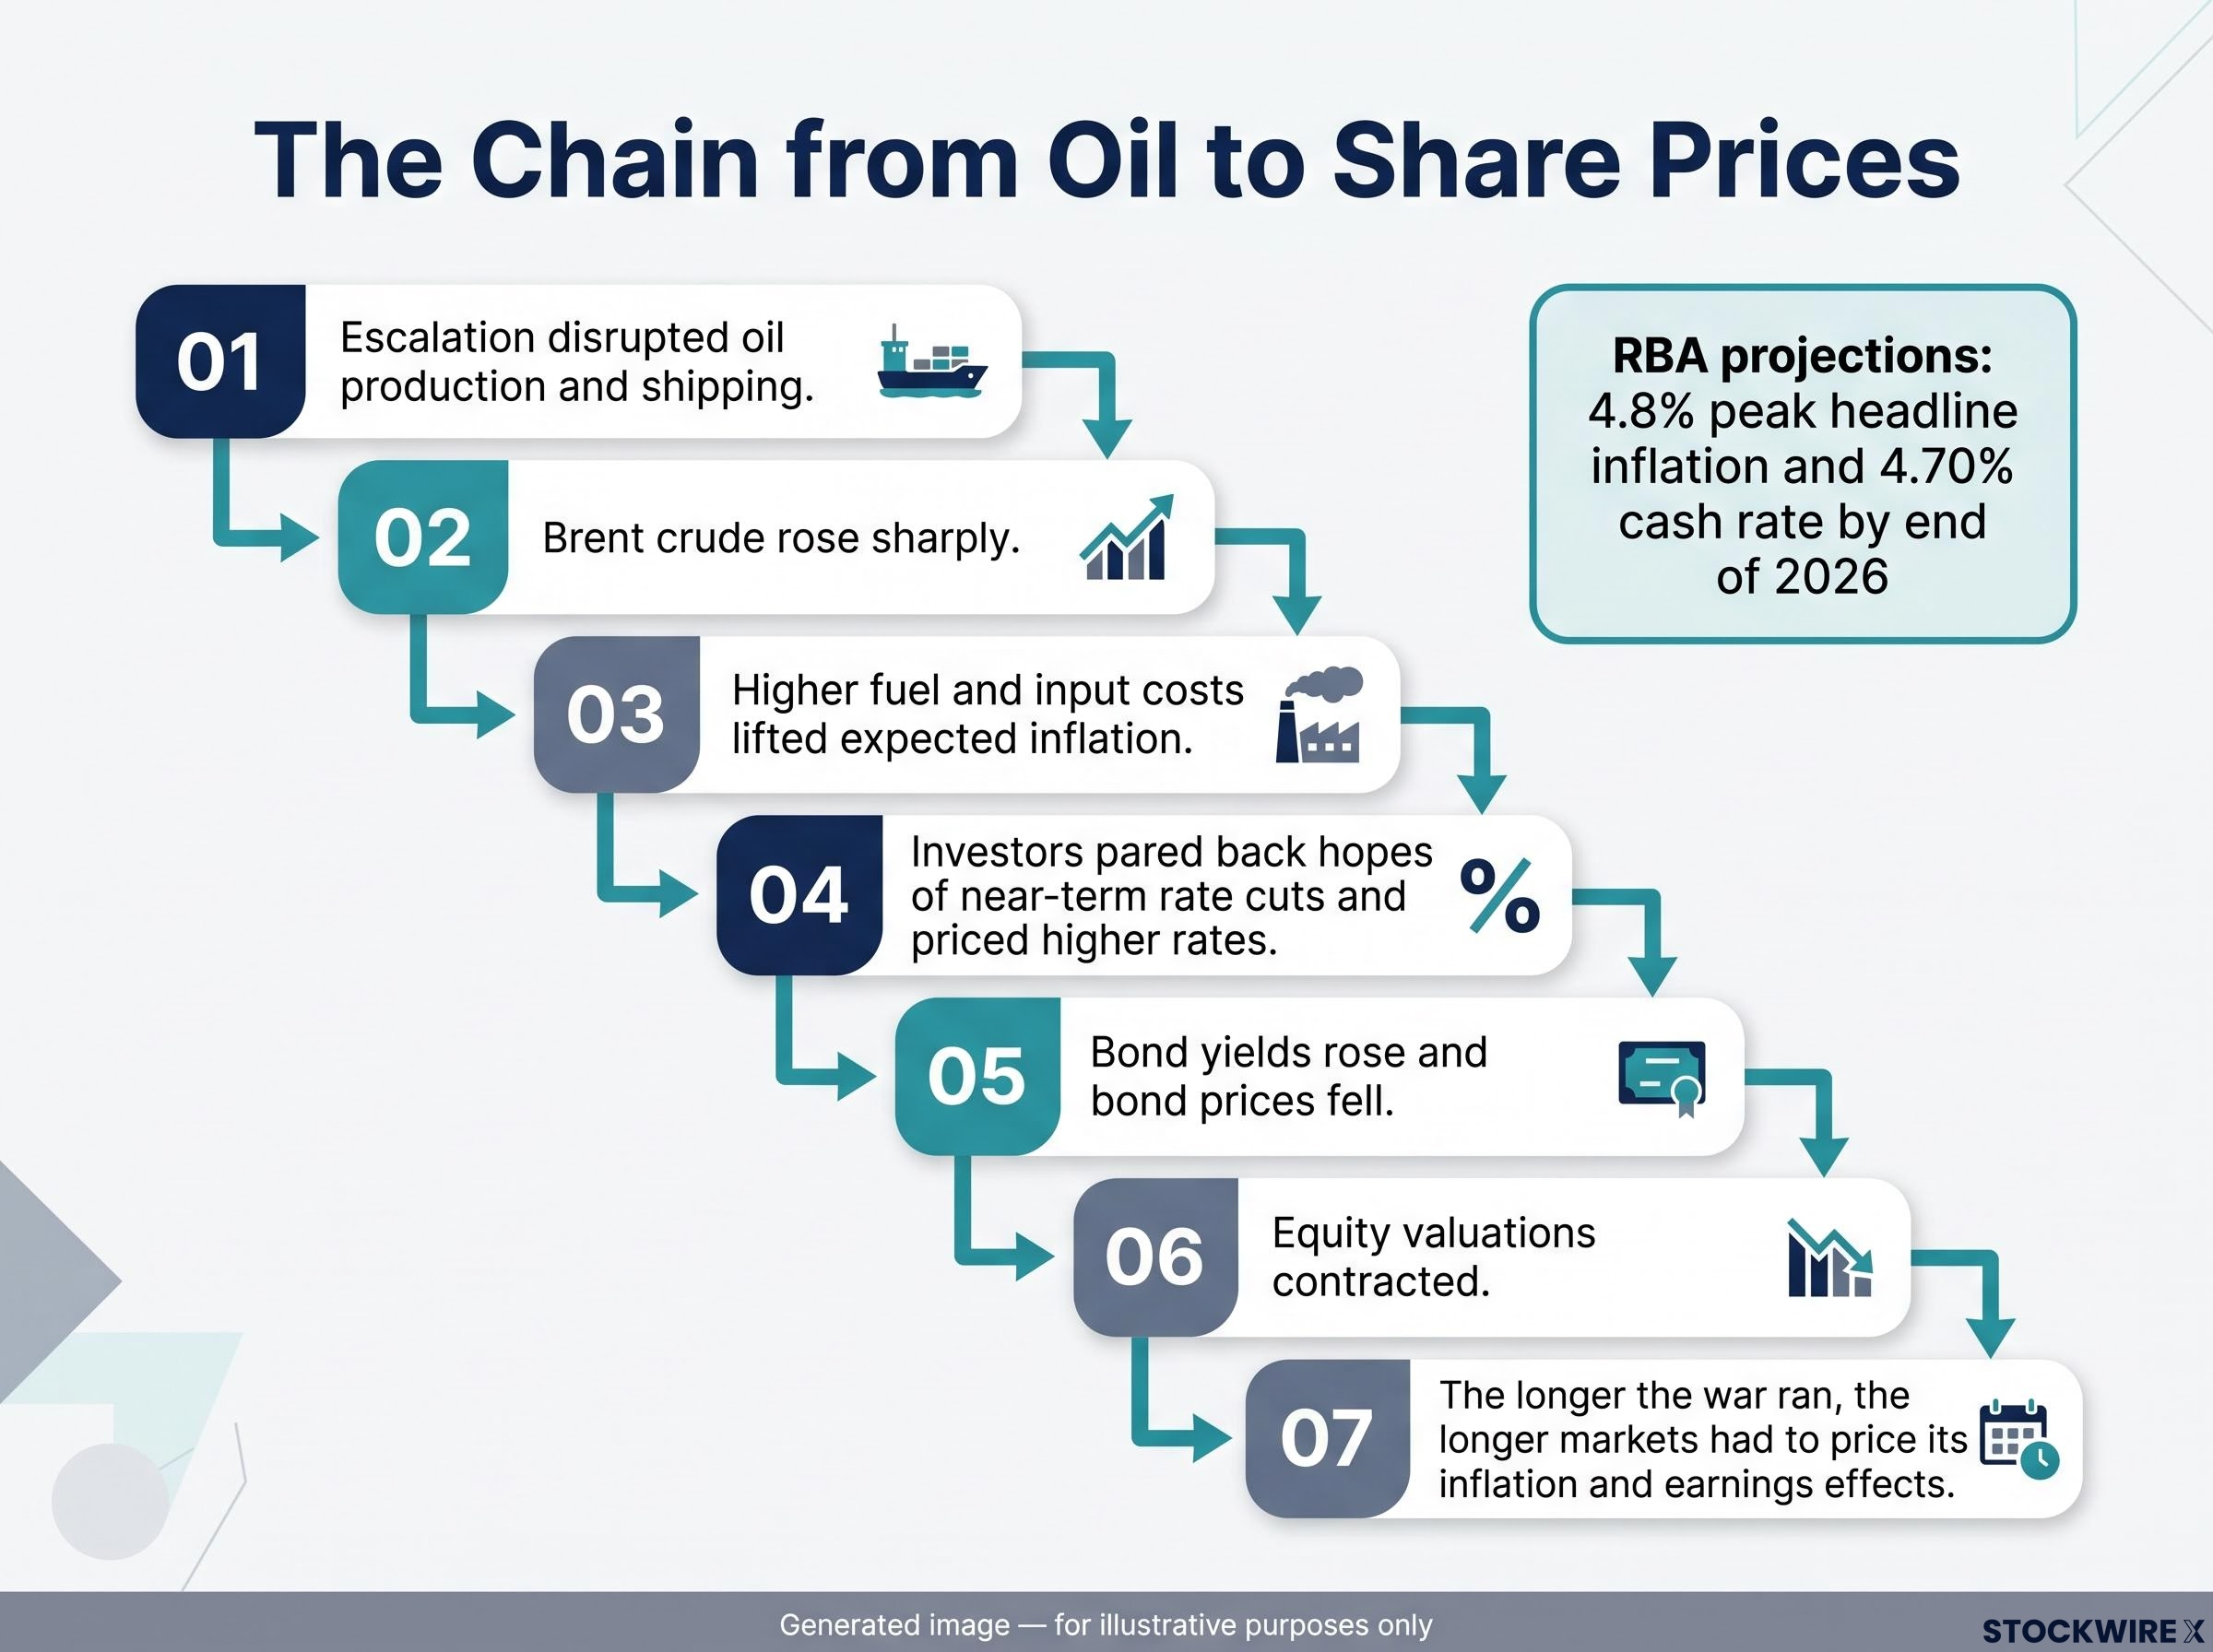
That is what followed. Transport costs climbed 8.7% over the year to September 2026. The RBA’s May outlook projected the cash rate reaching 4.70% by the end of 2026, with headline inflation peaking at 4.8% in the June quarter. In September it lifted the cash-rate target by 25 basis points (a quarter of a percentage point) to 4.60%, a later actual setting rather than a contradiction of the projection.
The chain from oil to share prices runs in seven steps:
- Escalation disrupted oil production and shipping.
- Brent crude rose sharply.
- Higher fuel and input costs lifted expected inflation.
- Investors pared back hopes of near-term rate cuts and priced higher rates.
- Bond yields rose and bond prices fell.
- Equity valuations contracted, especially for long-duration growth stocks.
- The longer the war ran, the longer markets had to price its inflation and earnings effects.
The damage was quick. About $280 billion in market value had gone by 20 March, according to the Australian Financial Review, and the ASX 200 fell 7.8% across March, its worst month since June 2022. A separate Mercer review, using a different period and benchmark, put Australian shares down about 2.0% for the March quarter while energy stocks rose 38.7% and Brent jumped 94.4%.
What this means for you: a shock that feeds into inflation and interest rates takes longer to price than a purely political one. Judge the next event by its economic channel, not its headline.
The oil supply inflation impact tends to outlast the physical disruption itself, because rerouting, war-risk insurance and thin inventories keep energy costs elevated even after export volumes recover, which helps explain why bond yields and equity valuations stayed under pressure.
How did Australian investors behave, and what did it cost them?
The survey set the emotional backdrop. Among more than 1,500 mostly self-directed investors, each able to pick up to three worries, the top concerns were:
- Geopolitical tension: more than 52%
- Inflation: 48%
- Recession risk: 42%
Another 46% said geopolitics had grown in importance over the past year. Yet the trading data from Sharesight, covering 97,000 investors, shows something less dramatic than panic.
| Sell-off | Busiest day | Buys | Sells |
|---|---|---|---|
| August 2024 | 5 Aug 2024 | 18,308 | 9,665 |
| Feb-Apr 2025 tariff and AI fall | 7 Apr 2025 | 23,388 | 12,576 |
| Feb-Mar 2026 Iran war | 9 Mar 2026 | 16,652 | 8,196 |
Buys outnumbered sells by roughly 2:1 on each busiest day. That is almost exactly the normal weekday ratio of about 2.1 buys per sale.
The balance did not move. Participation did.
On 9 March 2026, users placed almost 25,000 trades, nearly 80% above a typical weekday, with about two-thirds of them buys. And across both FY2025 and FY2026, median investor returns fell as trading frequency rose.
Buying the dip has worked recently because markets recovered, but the 2026 rebound took 158 days against a 25-day median. The read you should take is that feeling compelled to act during a sell-off is common, yet more trading has gone hand in hand with weaker returns, and buying after a fall is not the same as timing the bottom.
Feeling compelled to act is common, and the behavioural traps that push Australian retail investors towards overtrading and emotional attachment are structural as much as personal, which is why predefined rules tend to work better than willpower.
What happened to asset classes and valuations when the sell-off hit?
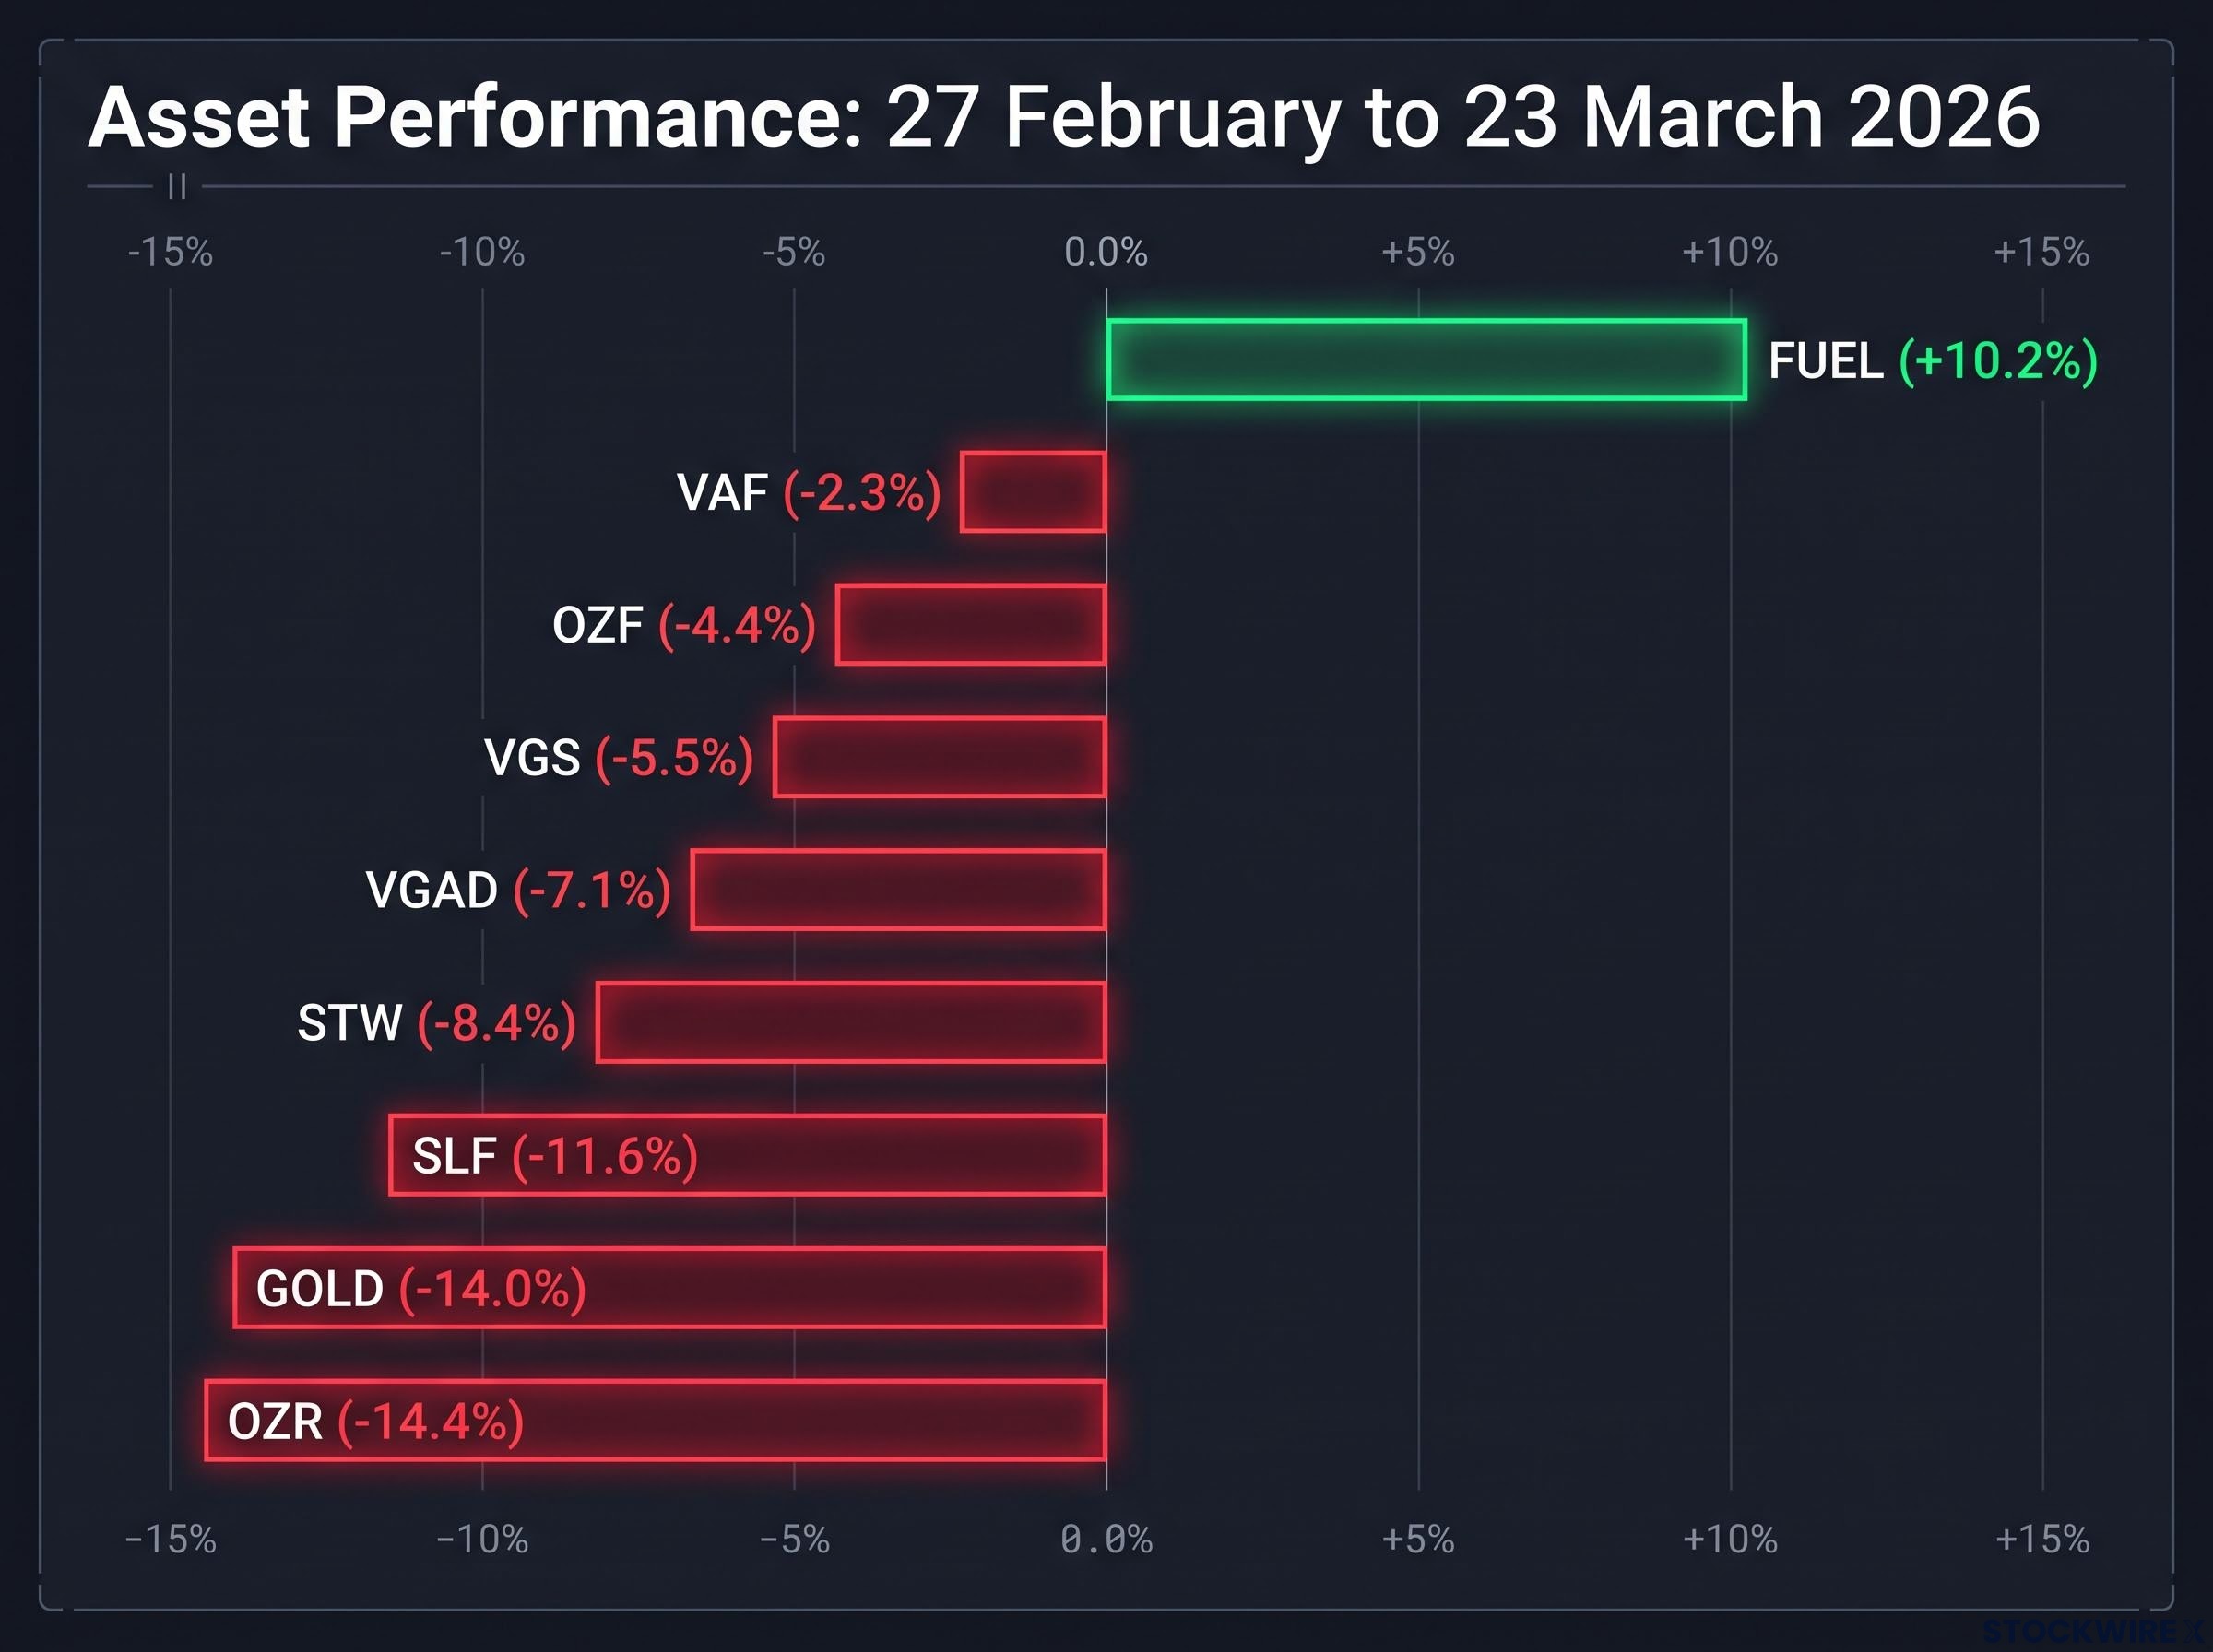
If you assumed gold and bonds would soften the blow, the numbers from 27 February to 23 March 2026 tell a different story. Only one holding in Morningstar’s comparison rose.
| Investment | Total return |
|---|---|
| FUEL (global energy) | +10.2% |
| VAF (Australian bonds) | -2.3% |
| OZF | -4.4% |
| VGS (unhedged global shares) | -5.5% |
| VGAD (hedged global shares) | -7.1% |
| STW (ASX 200) | -8.4% |
| SLF | -11.6% |
| GOLD | -14.0% |
| OZR (Australian resources) | -14.4% |
Why gold and bonds did not cushion the fall
This was not an ordinary flight to safety. Rising oil lifted inflation expectations, pushing up bond yields and real yields (returns after inflation), which hurt gold. A stronger US dollar and investors raising cash added pressure, and a March-quarter review recorded gold about 12% below its high.
Bonds usually gain when growth fears mean lower rates. Here the oil shock threatened weaker growth and higher inflation at once, so markets priced higher rates and Australian bonds slipped. The weaker Australian dollar helped unhedged investors: VGS lost 5.5% against 7.1% for the currency-hedged VGAD.
Did investors overreact? The valuation evidence
Morningstar’s analysts judged that they did. A 4- or 5-star rating means a share price sits below the analyst’s fair value estimate, adjusted for uncertainty. On 31 March 2026, 55% of covered Australian and New Zealand stocks held those ratings, the highest share since April 2025.
The equal-weighted discount to fair value was 11% in March and narrowed to 3% by July. Size-weighted, the market traded at a 10% premium by July, and in April the deep discounts sat mostly among smaller companies. Diversification only protects you if your holdings respond to the actual shock, and the bargains that appeared were concentrated and short-lived.
How should you decide when a portfolio change makes sense?
Start with three questions about your own money. What is the goal? How long until you need it? How much of a fall can you live with along the way? Your time horizon is simply the gap between today and when you will spend the money.
ASIC MoneySmart, in guidance updated on 14 May 2026, says to define your goal, the amount and the time frame before investing. It treats up to two years as short term, three to five as medium term, and more than five as long term.
| Time horizon | Suitable asset types | Reason |
|---|---|---|
| 0-2 years (short) | Savings accounts, term deposits, government bonds | Lower risk; a sell-off should not force a sale |
| 3-5 years (medium) | A diversified mix leaning towards lower-risk assets | Less time to wait out a long recovery |
| 5+ years (long) | Diversified growth assets such as shares | Short-term volatility has time to pass |
Morningstar’s advice runs the same way: keep what you need to spend over the next several years outside the market. Vanguard Australia, writing on 17 March 2026, urged investors not to react to short-term swings when their plan has not changed.
Try this exercise this week. Sort your money into those three buckets and ask whether a 158-day recovery would force you to sell anything. If it would not, a headline is not a reason to act.
The long view According to Vanguard, $10,000 invested in Australian shares on 1 July 1996 grew to $132,931 by 30 June 2026, against $32,459 in cash.
Vanguard’s managing director Asia-Pacific, Daniel Shrimski, said long-term wealth depends more on staying diversified and invested than on predicting the next event. Concern is reasonable; your decision should hinge on whether a fall threatens money you need soon, not on how alarming the news looks.
For newer investors wanting to build habits before the next shock, our dedicated guide to investing for Australian beginners explains what realistic first-year expectations look like.
What the 158-day recovery changes, and what the long record still says
The base rate still holds. Across nine shocks, falls were usually shallow, recoveries were usually measured in weeks, and seven of eight full years ended higher.
What 2026 adds is a lesson about duration. When a conflict runs through oil, inflation and interest rates, markets need longer to price it, and recovery stretches from weeks into months.
Morningstar expects geopolitical volatility to continue, so the time to set horizons and cash buffers is before the next shock, not during it. Protect near-term spending, stay diversified, and avoid turning a temporary fall into a permanent loss.
Past performance does not guarantee future results. Financial projections are subject to market conditions and various risk factors.
This article is for informational purposes only and should not be considered financial advice. Investors should conduct their own research and consult with financial professionals before making investment decisions.