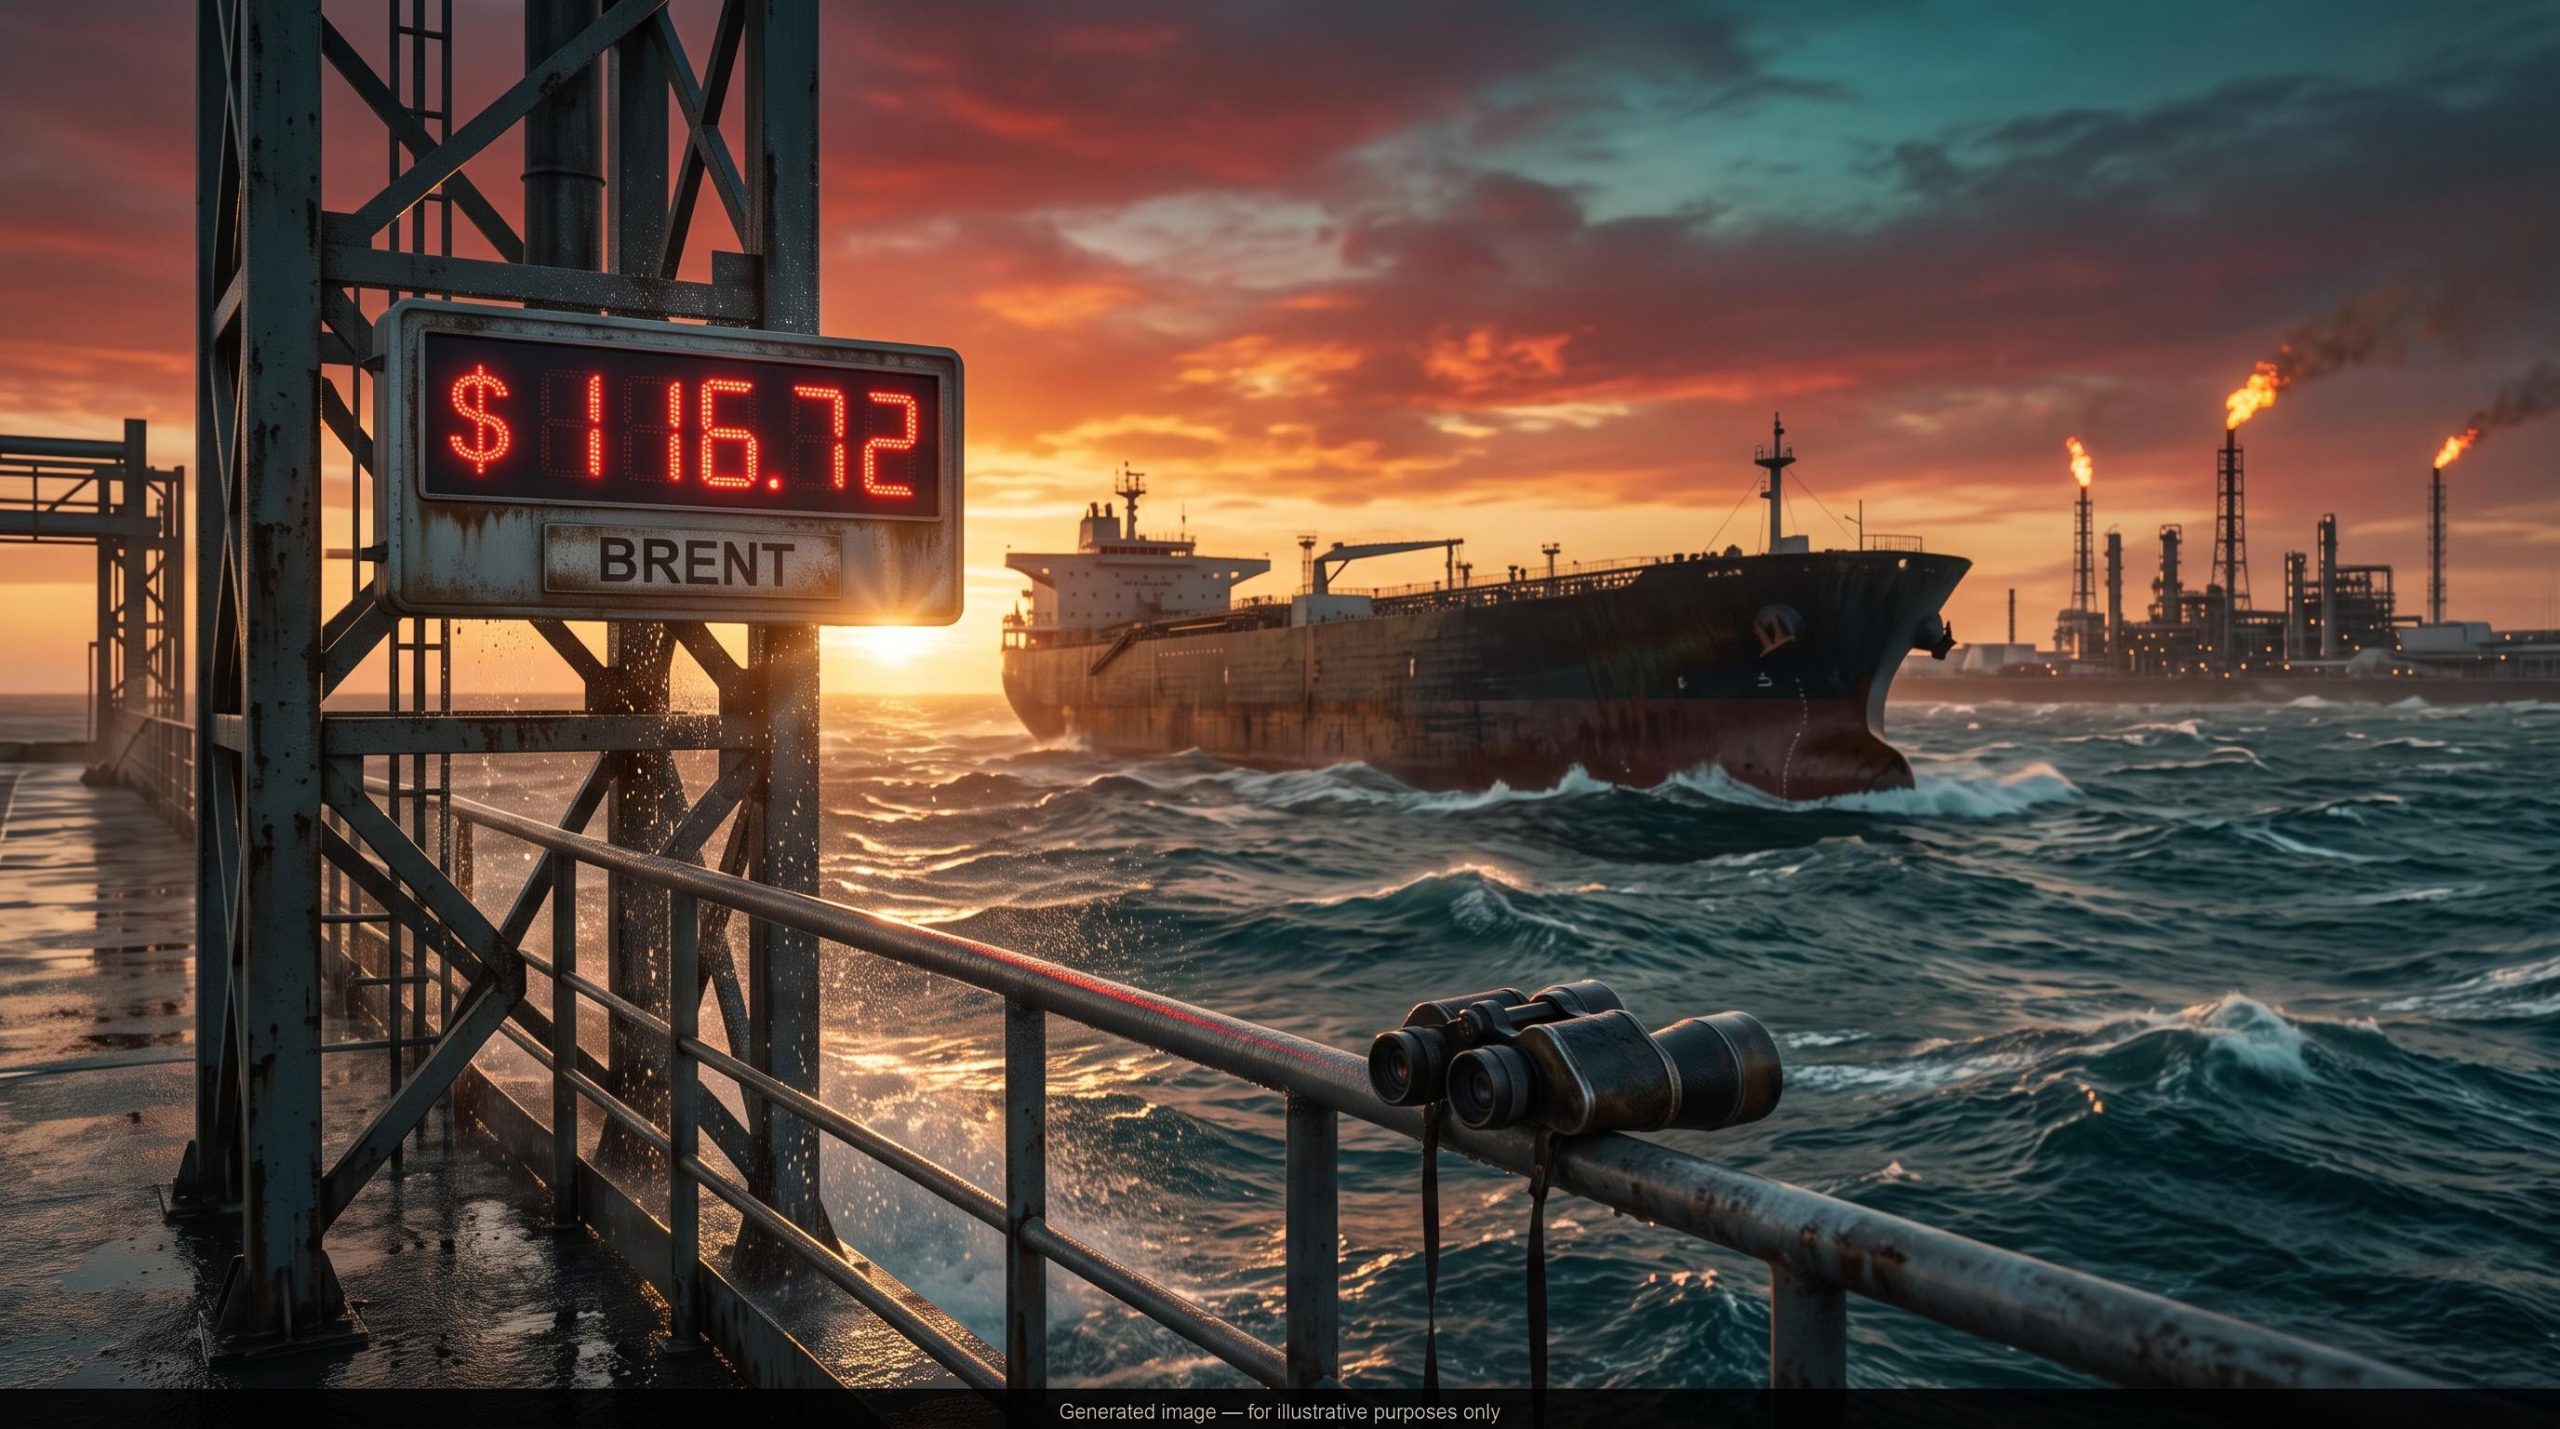
Brent crude settled at $116.72 a barrel on 23 October 2026, its highest close since 29 April. In the same stretch, oil reportedly flowed through the Strait of Hormuz in rising volumes. When physical supply improves and futures still climb, the market is paying for something other than missing barrels, and that puzzle sits at the centre of any serious oil price forecast right now.
The trigger is the calendar. The US midterm elections fall on 3 November, and reports that the US and Israel are weighing fresh strikes on Iran after voting ends have pushed traders to buy protection in advance.
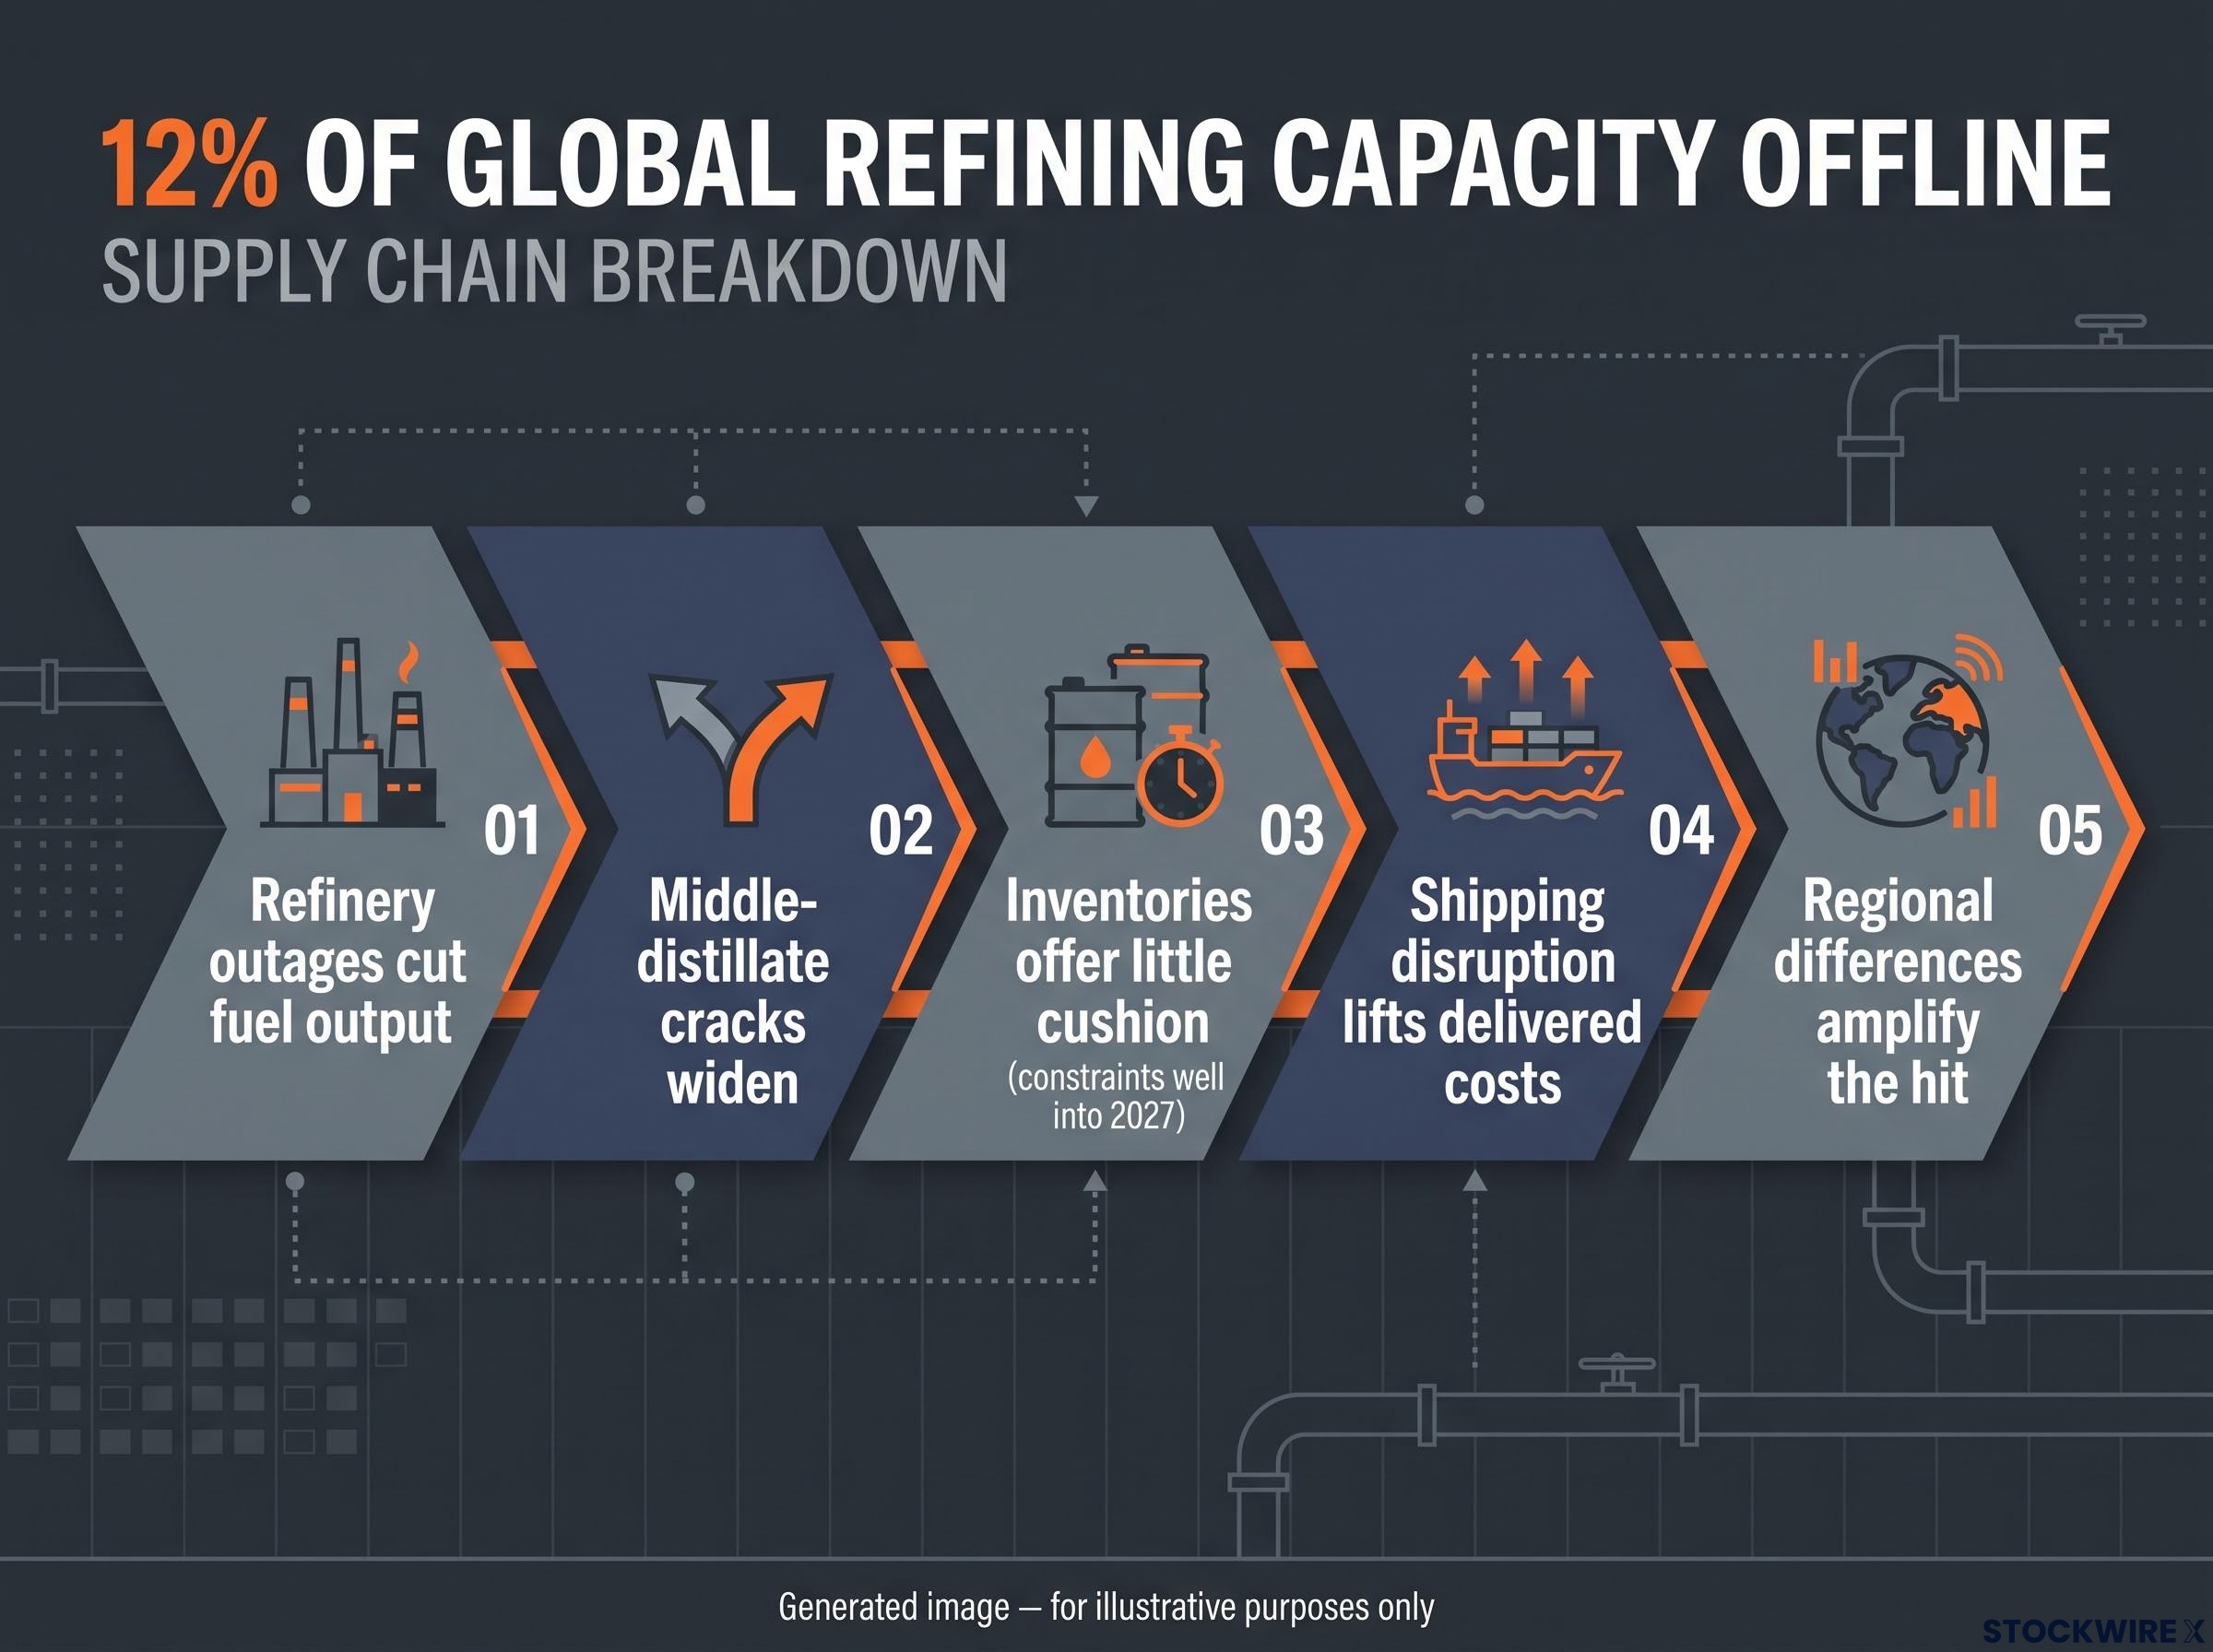
The damage is also travelling beyond crude. Nearly 12% of global refining capacity is offline, so the strain is showing up in diesel, marine fuel and European inflation data, not just in a headline barrel price.
Here is how a geopolitical risk premium moves from crude into diesel, inflation and the thinking of the European Central Bank (ECB), and which signals would tell you whether that premium is justified or fading.
Why did Brent hit $116 and what is the post-midterm scenario?
On 23 October, Brent rose 3.1% to $116.72, touching an intraday high of about $117.45. West Texas Intermediate (WTI), the US benchmark, gained 3.8% to $103.27, a six-month high. CNBC tied the move to reports of possible US and Israeli strikes on Iran once the midterms are over.
That is the print. The harder question is what scenario it is pricing.
Rabobank’s escalation case
Bas van Geffen, Senior Macro Strategist at Rabobank, sets out the broadest version of the conflict. In his team’s base case, Washington, Israel and a larger coalition of Arab and European states most likely hit Iran and the Houthis and move to protect Saudi Arabia. Tehran and the Houthis would then probably respond against Gulf states and perhaps Egypt.
Rabobank’s timeline: The bank’s strategists say hostilities, at fluctuating levels of intensity, could run through to the close of Q1 2027.
The conditional counter-view
Other voices treat that outcome as possible but contingent:
- SEB (Bjarne Schieldrop): Higher Hormuz export volumes may prove temporary, and Iran could escalate before 3 November.
- Goldman Sachs: Brent above $120 requires Gulf output to stay about 4 million barrels a day below pre-war levels.
- Energy Information Administration (EIA): Rising Middle East production and flows should limit how long the spike lasts.
- Richard Hunter (Interactive Investor): Strike reports alone triggered a sharp reaction because the conflict has run far longer than markets expected.
The flow data reinforces the split. Futures stayed elevated while Hormuz shipments reportedly increased, which suggests part of today’s price is insurance against disruption. Treat the headline number as a risk estimate rather than a count of lost barrels, because insurance can be cancelled quickly if de-escalation arrives.
Goldman Sachs has put a number on the geopolitical risk premium, estimating that just over $20 of Brent’s price is fear rather than scarcity, which helps explain why its December target sits well below the futures market.
When big ASX news breaks, our subscribers know first
Why are diesel and marine fuel moving faster than crude?
If the crude premium is partly insurance, the refined-product shortage is not. October reporting showed diesel rising faster than Brent, and Rabobank flagged diesel and marine fuel oils as its main concerns, lifting its refined-products forecasts (the exact figures were not published).
The key distinction is simple. Crude oil can be available while the fuels made from it are scarce, because refineries sit between the two. Rabobank estimates nearly 12% of global refining capacity is offline because of the Iran and Ukraine wars.
The same decoupling explains why diesel prices stay high even as Hormuz crude flows recover, with refined-product exports from the Gulf running at only a fraction of pre-conflict levels.
The five-link chain
- Refinery outages cut fuel output. Lost processing capacity hits diesel and marine fuel hardest, even when crude keeps flowing.
- Middle-distillate cracks widen. Middle distillates are the mid-weight fuels, such as diesel and very low sulphur fuel oil (VLSFO), produced in refining. A crack spread is the gap between the price of a refined product and the crude used to make it; when it widens, refiners’ output is scarcer than their input.
- Inventories offer little cushion. Rabobank expects steeper drawdowns if both conflicts escalate, and the International Energy Agency (IEA) warns distillate constraints could persist well into 2027.
- Shipping disruption lifts delivered costs. Rerouting around Hormuz and the Red Sea adds sailing time, fuel burn, freight and insurance.
- Regional differences amplify the hit. Europe and other import-dependent markets pay more for replacement cargoes.
Verified current global diesel and VLSFO price levels were not available in the research, which is itself a reminder that the most telling signals are often less visible than Brent.
Structural versus cyclical
The structural weakness is the concentration of refining and shipping capacity in exposed regions. The cyclical shock is the current outage, inventory drawdown and precautionary buying. Rabobank argues only simultaneous de-escalation in both conflicts would lower prices and let inventories rebuild.
If you track energy exposure, watch product cracks and inventories rather than crude alone. They show whether the shock is reaching the fuels that businesses and households actually buy.
How does energy inflation reach the ECB, and what did Lagarde say?
Those fuel costs are already visible in European prices. Eurostat data shows euro-area headline inflation climbed to 3.8% in September 2026, with energy alone contributing 1.71 percentage points.
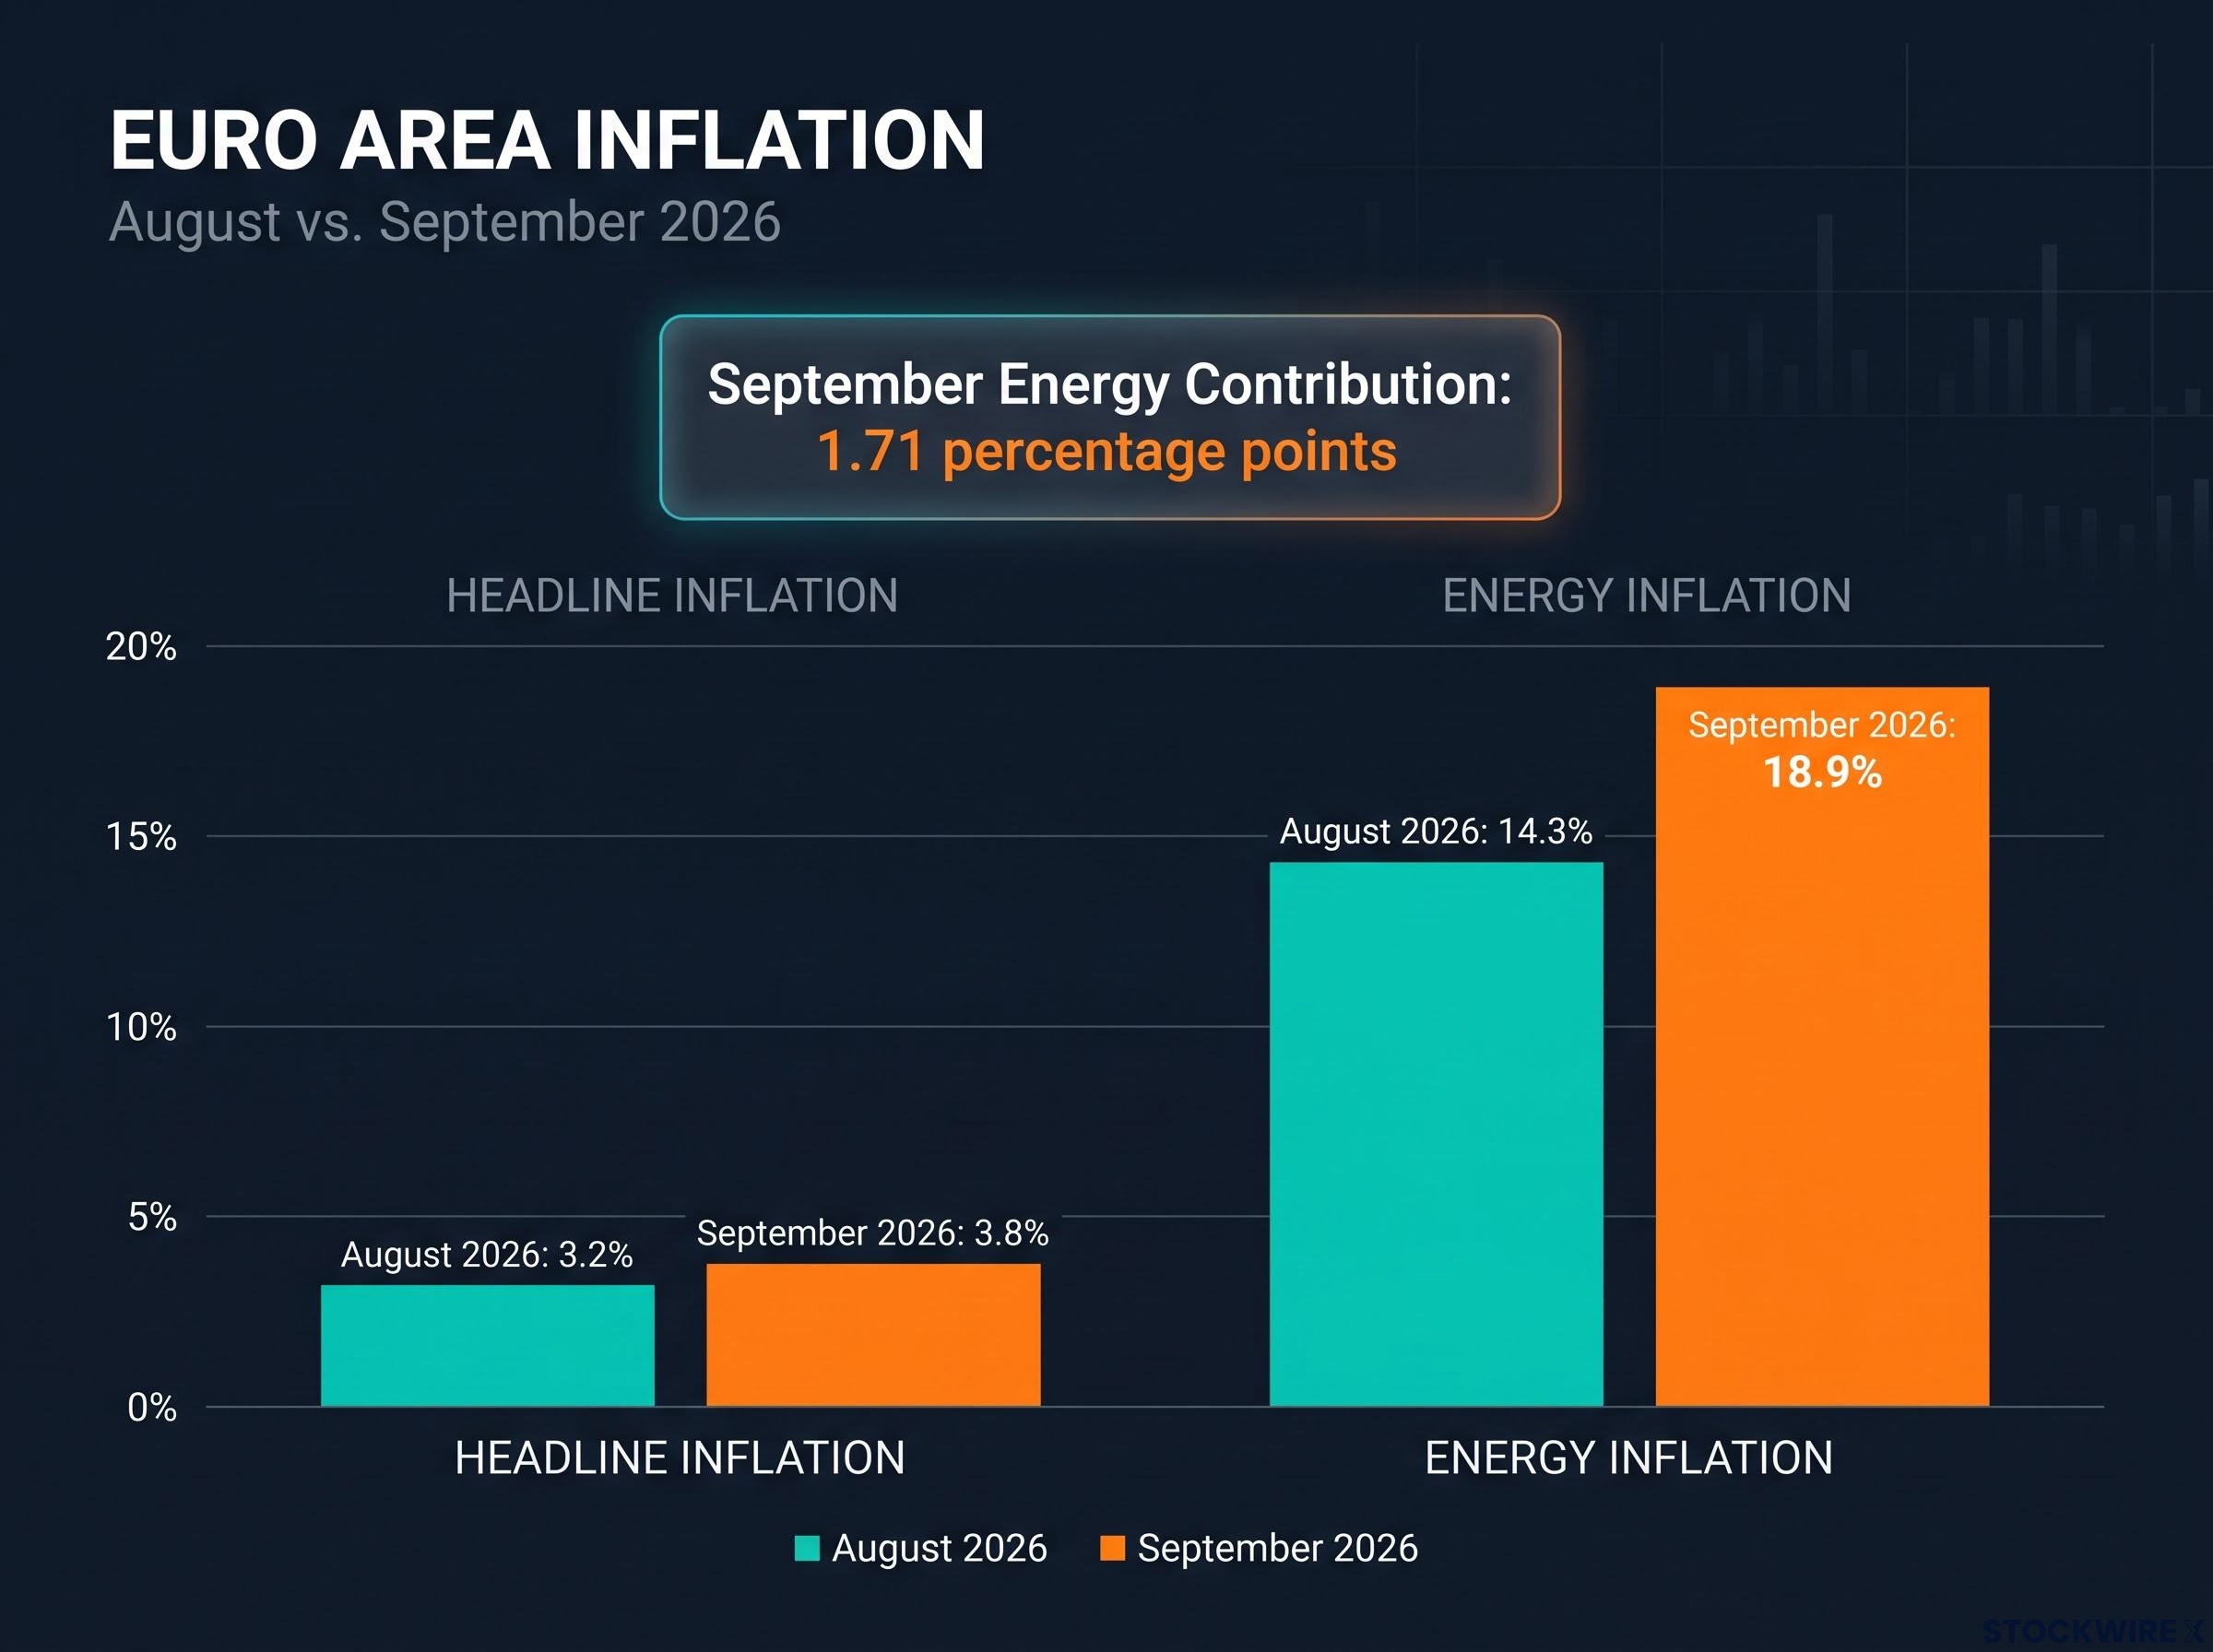
| Indicator | August 2026 | September 2026 | Change |
|---|---|---|---|
| Headline inflation (y/y) | 3.2% | 3.8% | +0.6 percentage points |
| Energy inflation (y/y) | 14.3% | 18.9% | +4.6 percentage points |
The ECB’s 29 October statement acknowledged that energy prices have moved above the path assumed in its September projections, so headline inflation will probably stay well above target over coming quarters. It described upside risks to inflation and downside risks to growth.
Yet the bank also pointed to calm underneath. Underlying inflation has held broadly stable, and wages have not yet responded in any material way. Second-round effects, where higher energy costs feed into wages and wider prices, have not shown up beyond what the ECB already expected.
Lagarde’s warning: President Christine Lagarde cautioned that the longer energy prices remain elevated, the greater the risk of indirect and second-round effects.
Governments can soften the blow through strategic stock releases, fuel subsidies or tax cuts, though that shifts the burden onto budgets and delays the demand adjustment that usually cools prices. The euro area is simply the clearest worked example; other import-dependent economies face similar freight and replacement-cost pressure.
A central bank caught between rising headline inflation and weakening growth will set rates according to how long the shock lasts. Wage data and underlying inflation are the real trigger points to watch, not next month’s energy print.
What do the forecasts say, and what could prove them wrong?
Duration is also why forecasters cannot agree on where Brent is heading.
Where forecasters disagree
| Institution | Brent view | Timing | Key condition |
|---|---|---|---|
| Goldman Sachs | $90 (Dec 2026); $80 average in 2027 | 11 October 2026 | Above $120 if Gulf output stays about 4 million b/d below pre-war levels |
| Morgan Stanley | $105 (Q4 2026); $100 (Q1 2027) | 12-13 October 2026 | Raised from $100 and $95 |
| EIA | $105 average (Q4 2026); about $87 (Q2 2027) | October outlook | Higher Middle East output limits the spike |
| IEA | Around $107 at report time | 14 October 2026 | Distillate constraints into 2027 |
Morgan Stanley and the EIA cluster near $105 for late 2026, while Goldman sees $90 by December. All of them expect easing into 2027, so the disagreement is about how fast the premium unwinds, not whether it does.
What history and caveats suggest
Precedent points both ways. The 2019 Abqaiq attack spiked crude, then the premium reversed once restoration looked credible. In 2022, refined products tightened far faster than crude, and the 2024 Red Sea attacks lifted freight and bunker costs with no crude loss at all.
Hormuz supply disruption fears have driven sharp swings before, including in May, when Brent fell 4.5% on collapsing nuclear talks even though physical flows through the strait stayed uninterrupted.
The main counter-arguments to sustained high prices:
- Demand weakness: Expensive fuel squeezes households and industry, which the EIA expects to cap gains.
- OPEC+ limits: Gulf spare crude cannot replace damaged refineries or disrupted shipping lanes.
- De-escalation: A US-Iran understanding could trigger a rapid correction across crude, diesel and bunker fuel.
- Premium already priced: Futures above $110 do not prove a shortage of equal scale.
The persistent inflation damage comes when a shock outlasts inventories and spreads into products, freight and wages. The $90-to-$105 spread tells you nobody has a reliable number while the conflict path is unresolved, so plan around scenarios and duration instead.
Past performance does not guarantee future results. Financial projections are subject to market conditions and various risk factors, and these statements are speculative and subject to change.
What the premium changes, and what it does not, for energy inflation
The rally is a risk premium sitting on top of a genuine refining shortfall. The premium can vanish quickly; the shortfall cannot, and its inflation impact depends on duration rather than any single price.
The signals worth your attention are concrete:
- US and Israeli posture after 3 November
- Hormuz and Red Sea flows
- Diesel and bunker crack spreads
- Refinery restarts
- Euro-area wage and underlying inflation data
If both the Middle East and Ukraine conflicts ease together, prices can fall and inventories can rebuild. If either escalates, the strain shifts further into the fuels and wages that central banks cannot ignore.
This article is for informational purposes only and should not be considered financial advice. Investors should conduct their own research and consult with financial professionals before making investment decisions.