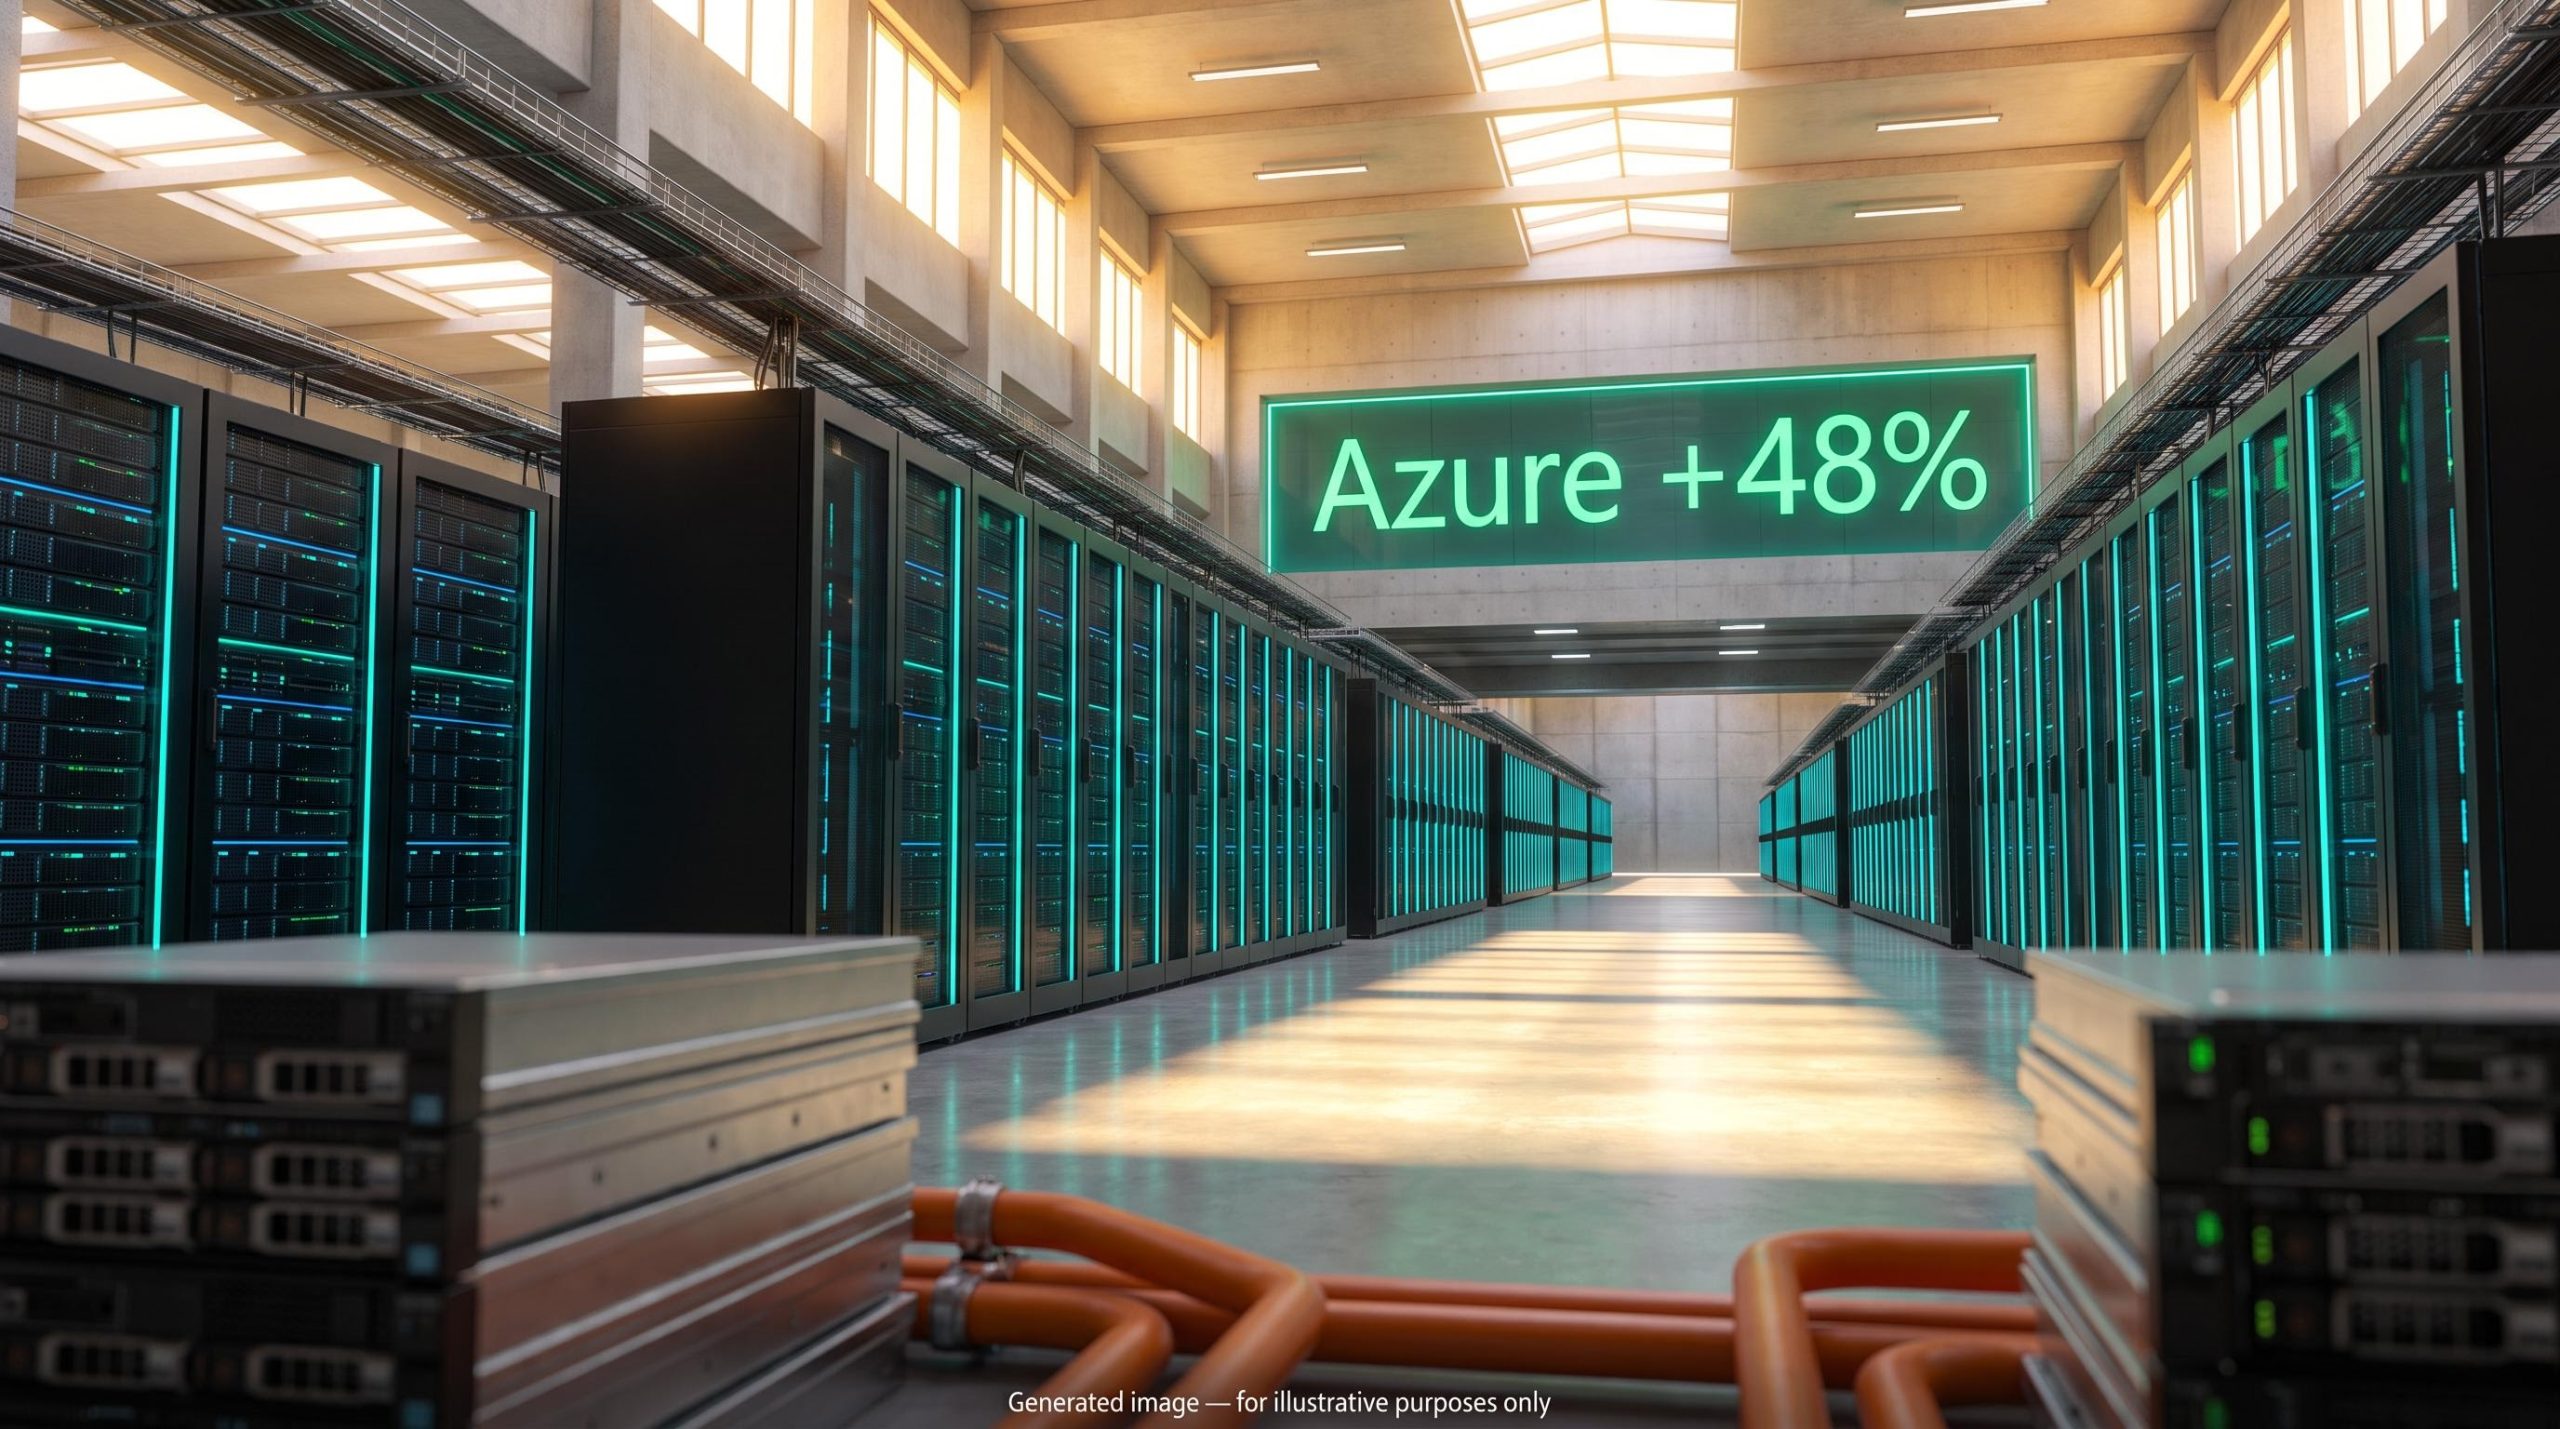
Microsoft’s Azure cloud business grew 48% in the September quarter, and management guided to 49-50% for the December quarter. The fiscal Q1 earnings show the platform speeding up even as its base grows larger.
Microsoft reported on 28 October 2026 for the quarter ended 30 September 2026. Revenue reached $92.3B, up 19%, and adjusted earnings per share (EPS) came in at $4.89, up 18%.
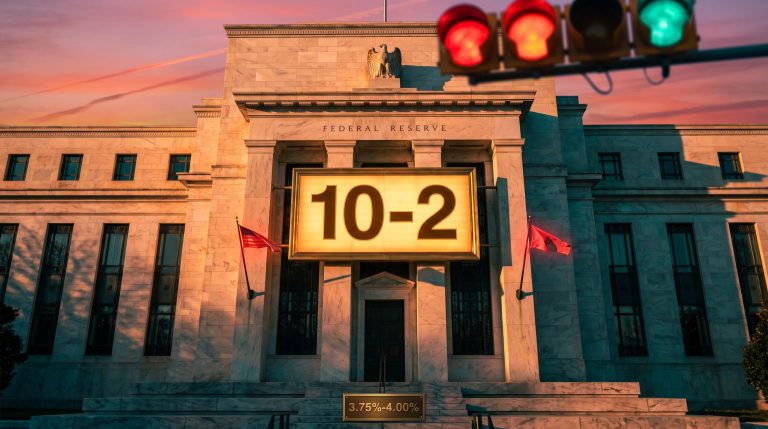
The timing mattered. One day later, on 29 October, a sector-wide tech and AI selloff hit, triggered largely by Alphabet’s results. Investors are now scoring AI spenders on whether the spending produces cash, not just whether cloud revenue grows. That shifts the question from “was the quarter strong?” to “does the quarter pay for itself?”
The sections below set Microsoft’s operating results against Morningstar’s unchanged $600 fair value and a share price near $530, so you can judge how much of the story the stock already reflects.
Is enterprise AI demand turning into lasting revenue?
What the beat actually was
Revenue cleared consensus of roughly $90.6-90.7B by about $1.6B, and adjusted EPS beat estimates of about $4.72-4.73. Morningstar, citing FactSet, still called the revenue beat marginal.
The real surprise sat inside the cloud. For the first time, Microsoft disclosed Azure revenue in dollars: $33.165B, up 48% against guidance of about 44-45%.
| Metric | Q1 FY2027 | YoY | Context |
|---|---|---|---|
| Microsoft Cloud revenue | $63.9B | +30% | Includes Azure and M365 cloud |
| Operating income | $45.915B | +21% | Outpaced revenue growth |
| Agents and Infra segment | $76.795B | +25% | New FY2027 segment |
| Devices and Consumer segment | $15.484B | -3% | The only shrinking segment |
| Commercial RPO | $677B | +73% | About 30% recognised within 12 months |
Four signals behind the Azure number
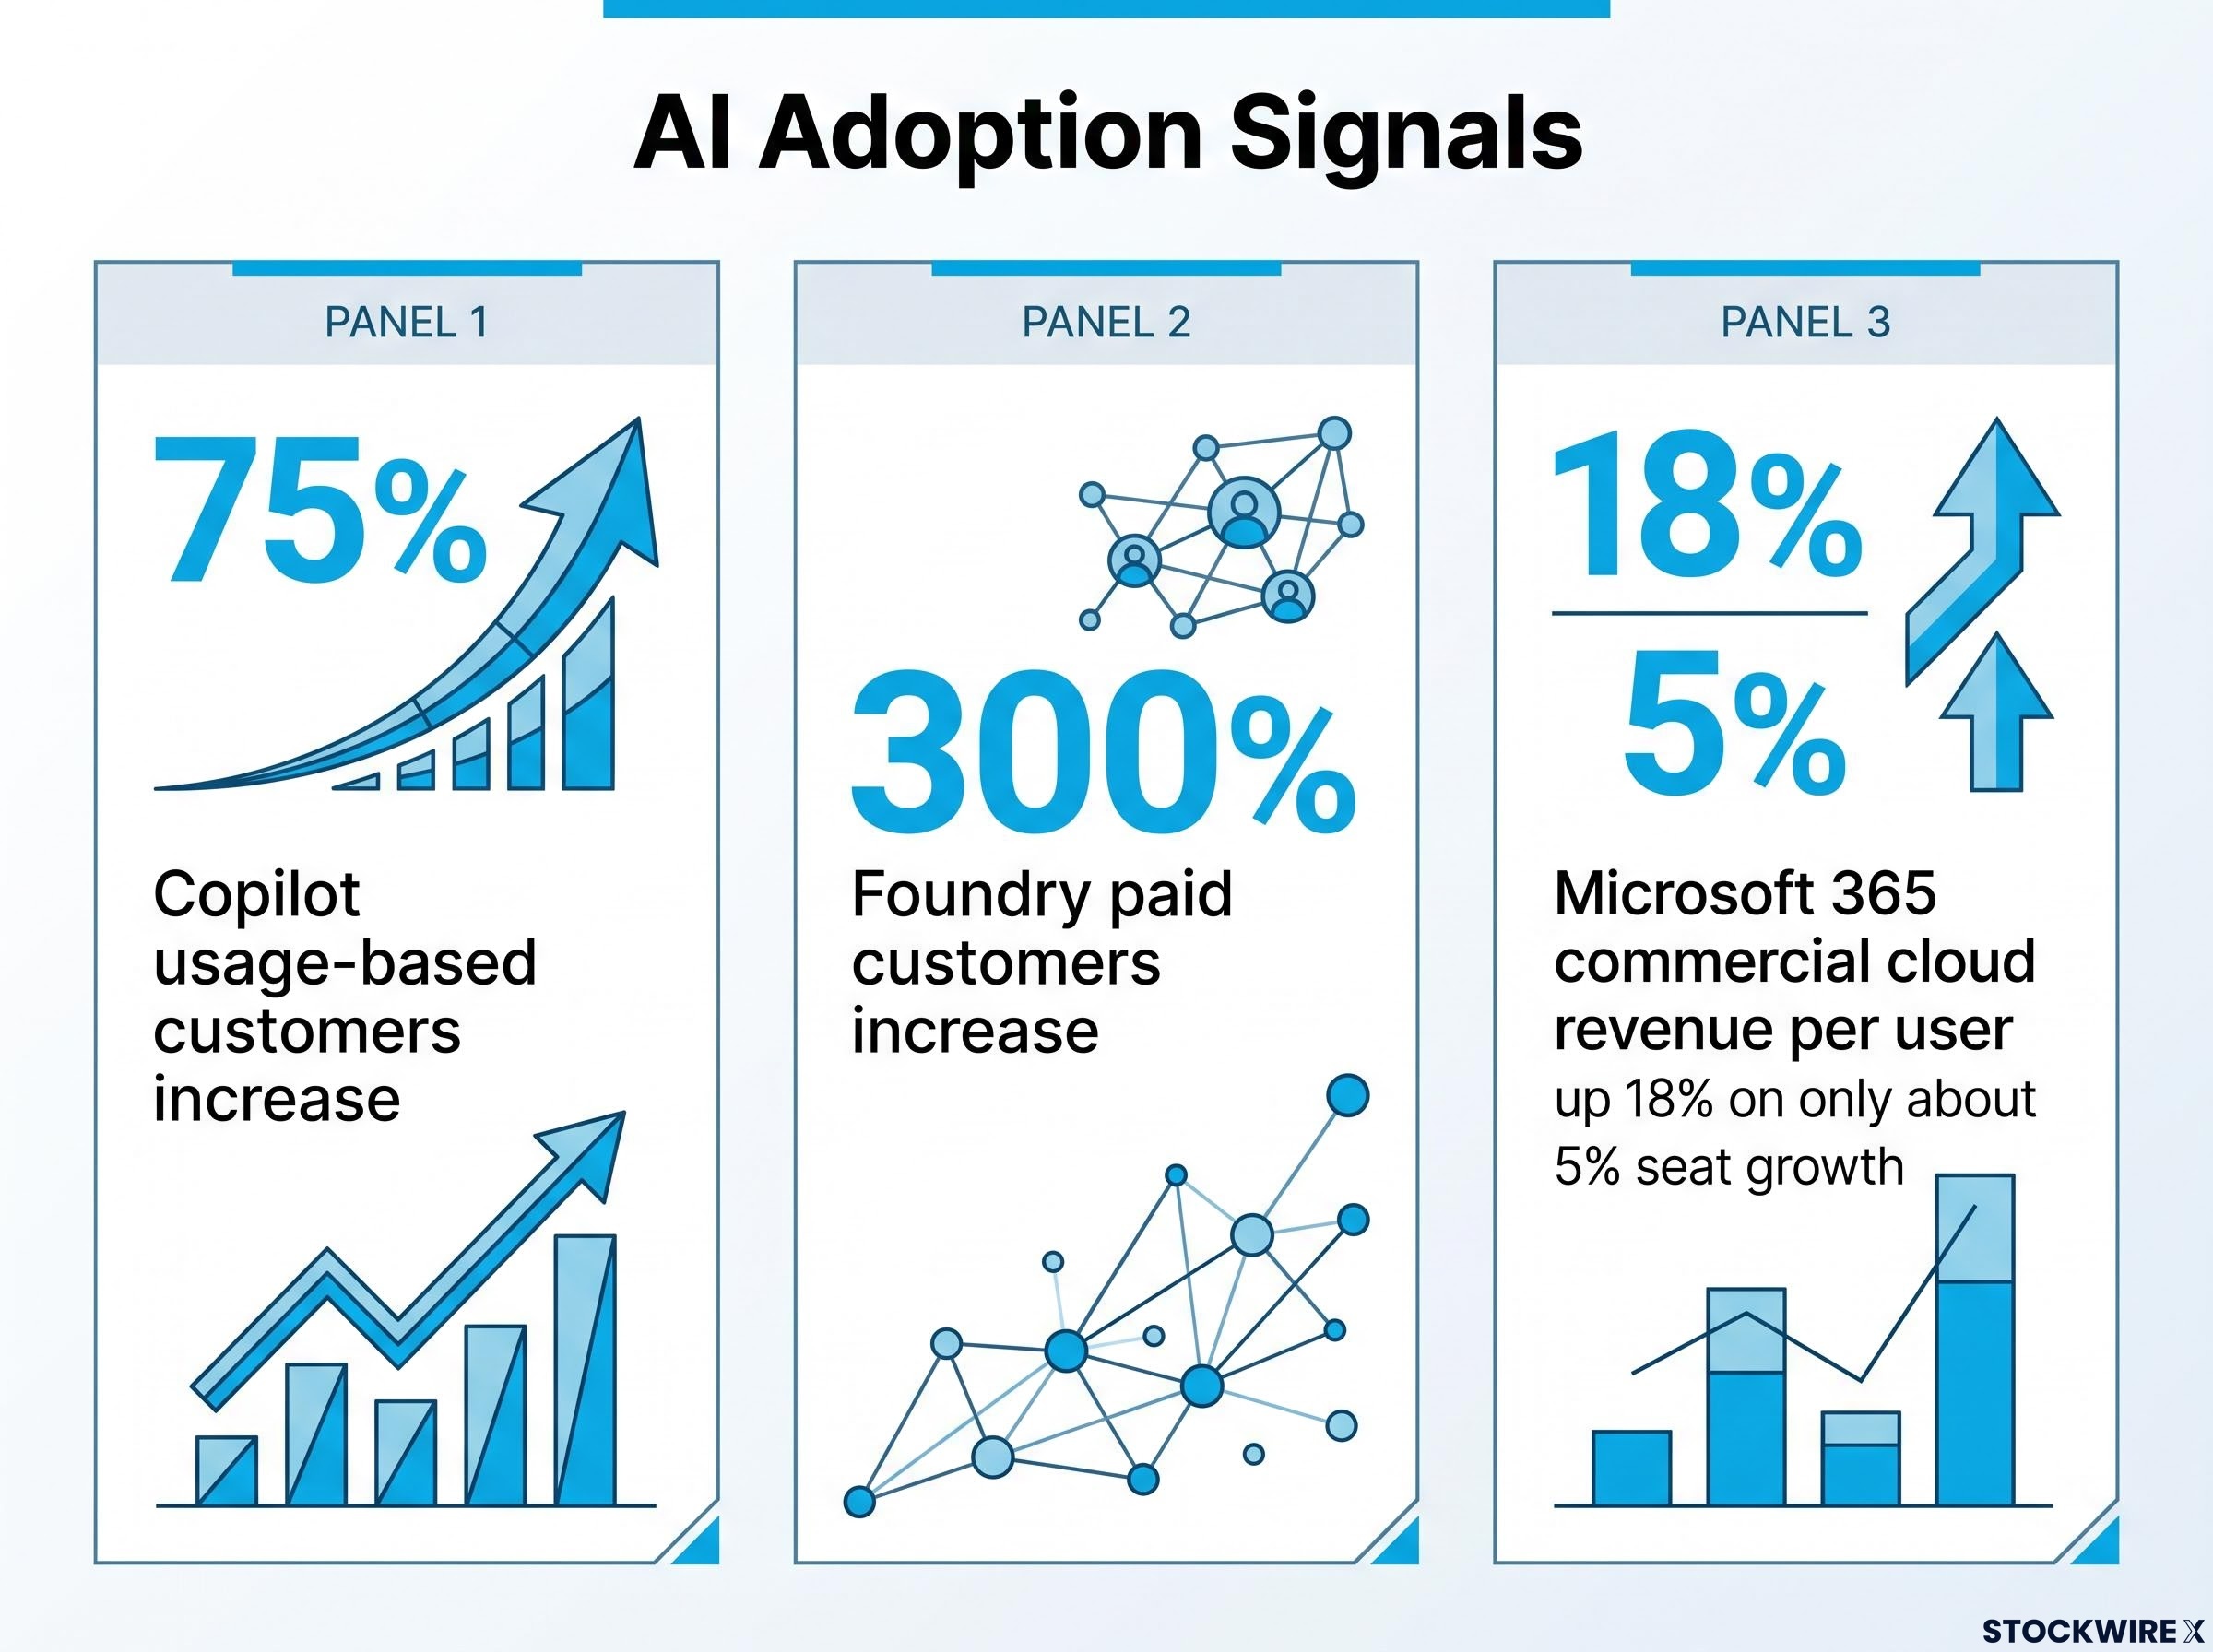
Azure consumption itself is the first signal, driven by AI workloads and CPU monetisation. The other three show customers moving from trials to paying for use:
- Copilot: usage-based customers up about 75%
- Foundry: paid customers up more than 300%
- Revenue per user: Microsoft 365 commercial cloud up 18% in constant currency on only about 5% seat growth
That last gap is the one to hold onto. Customers are paying more per user, which is the clearest sign this AI revenue is recurring rather than experimental. Morningstar reads it the same way, arguing that enterprise relationships are converting AI demand into lasting revenue.
One caveat applies. Commercial remaining performance obligations (RPO), meaning contracted revenue not yet recognised, total $677B, but that is backlog rather than near-term sales. Microsoft also has not disclosed what Copilot contributes to margins.
Microsoft’s $677B commercial RPO is part of a broader pattern, with more than $2.3 trillion of contracted backlog sitting across the major cloud providers, which shifts the risk question from demand to whether capacity can be built fast enough.
Capex of $170 billion: how much strain can the cash flow take?
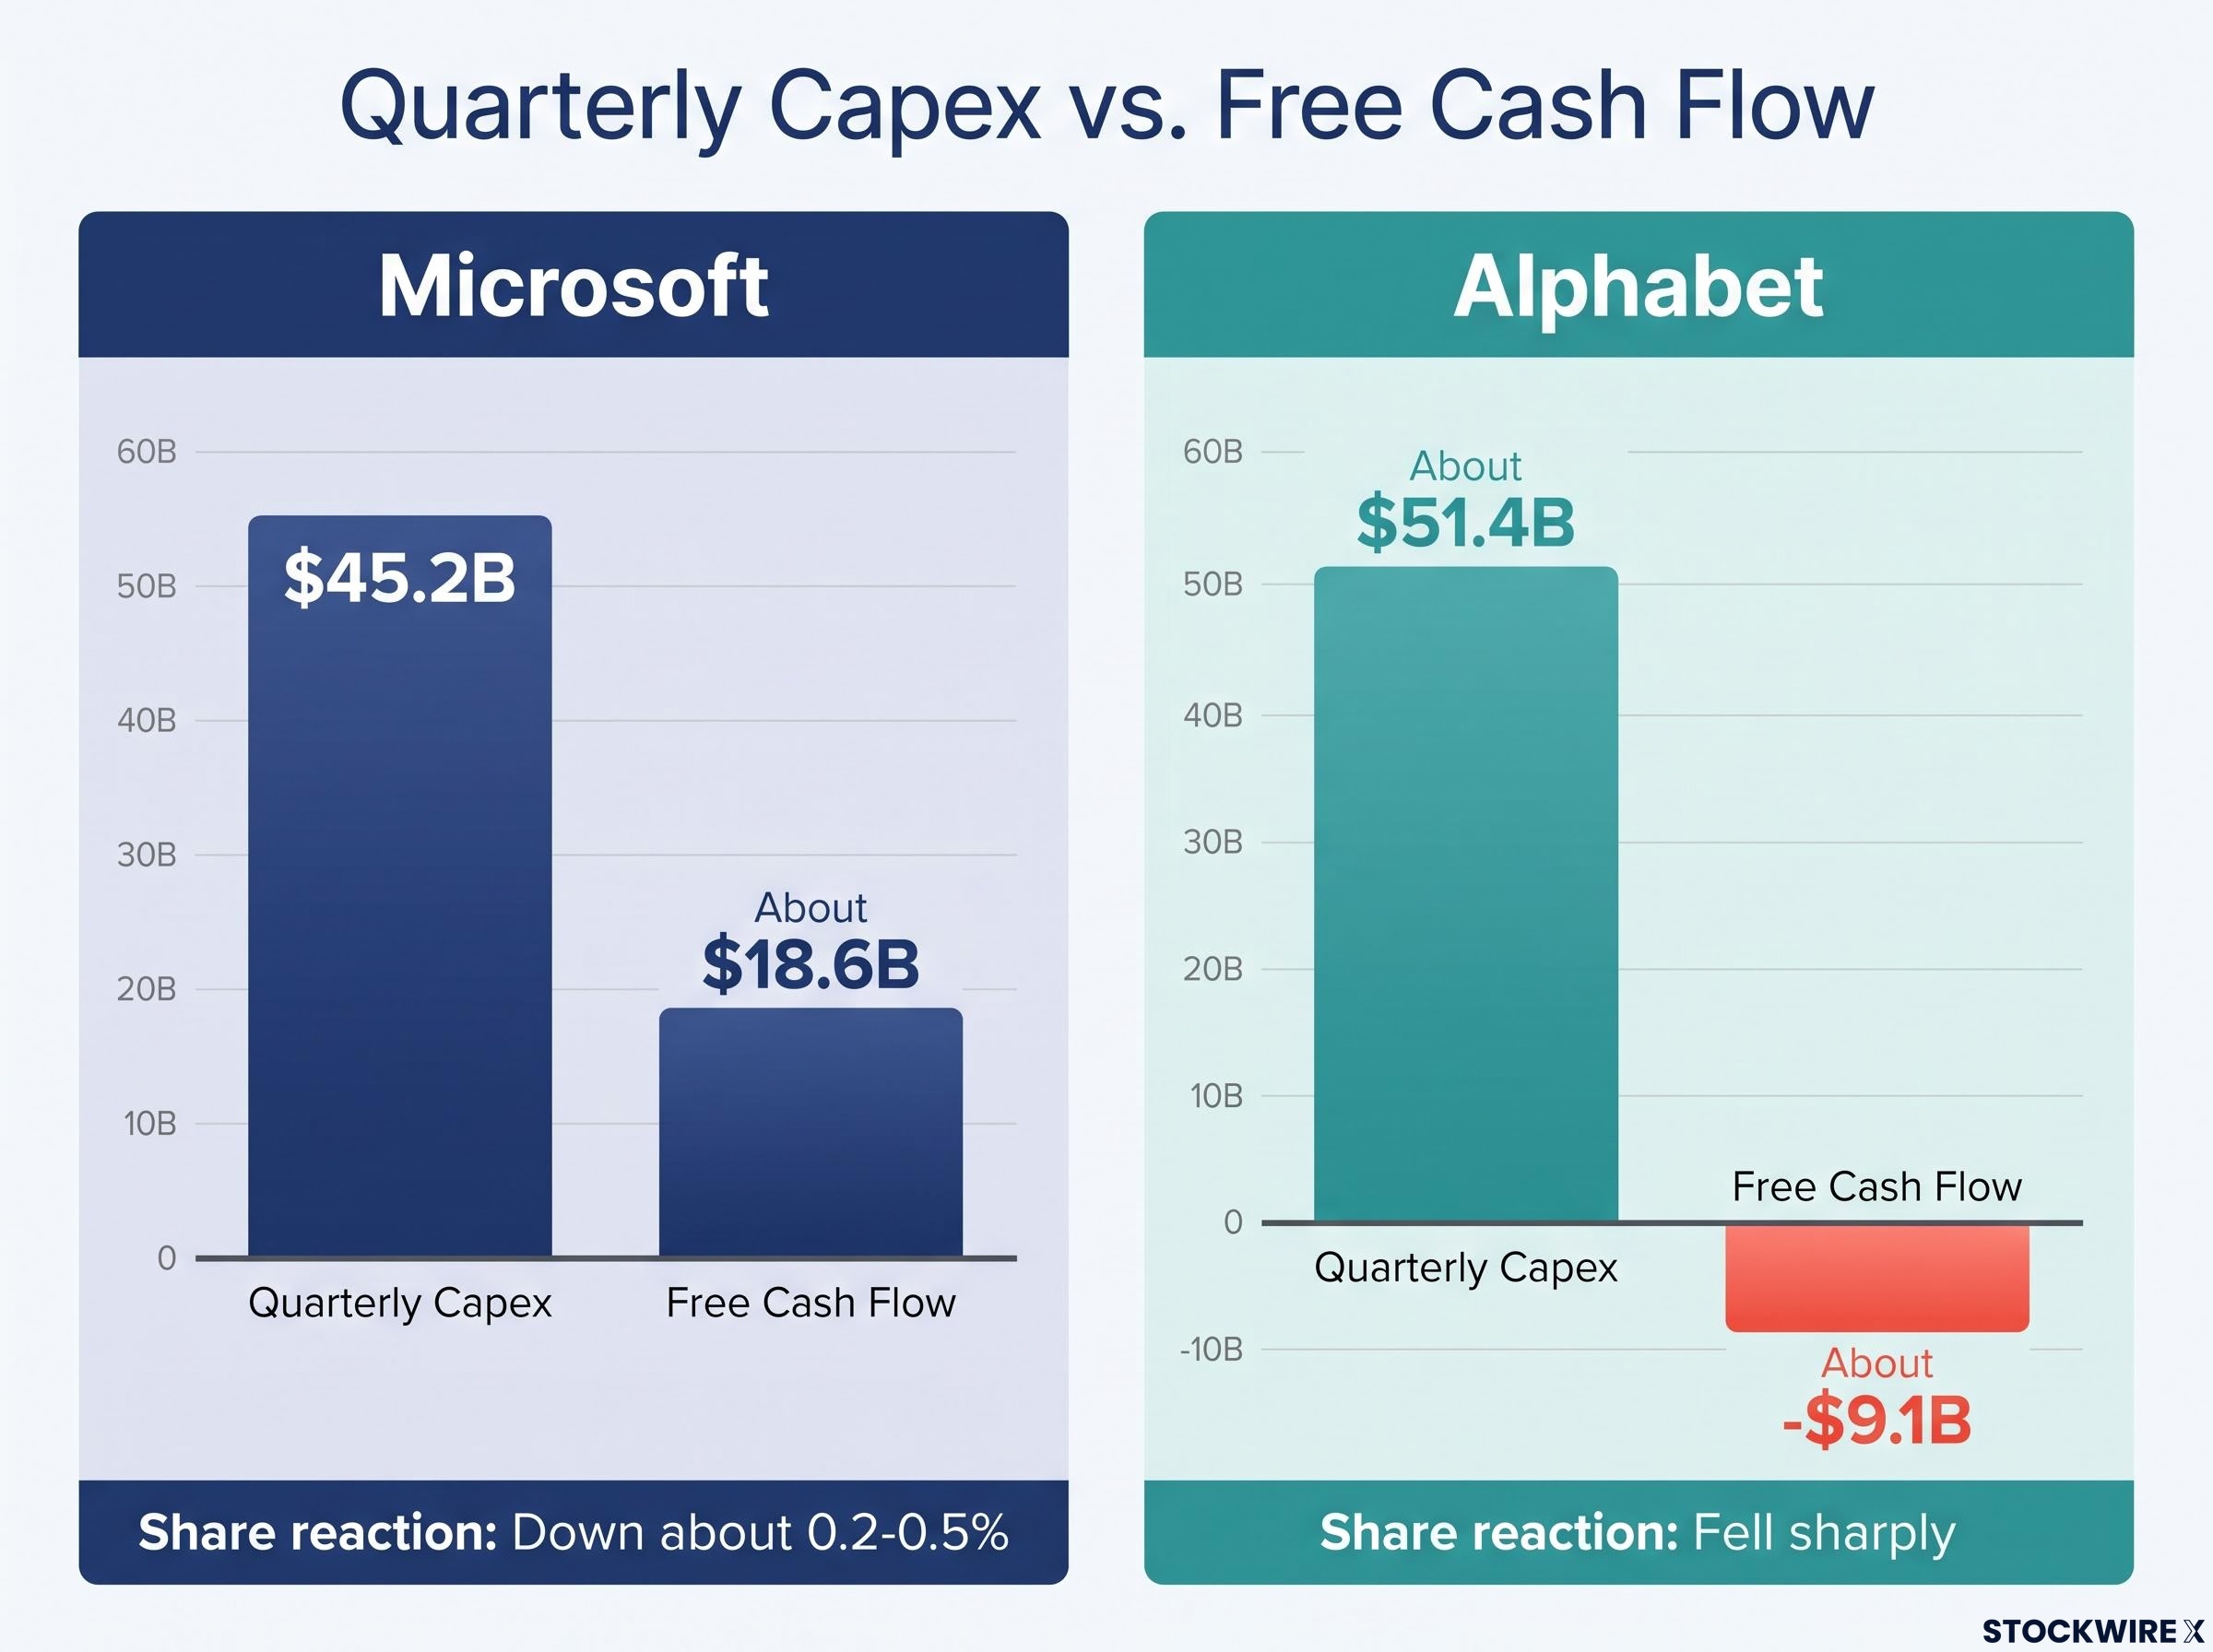
The reassuring number comes first. Free cash flow, the cash left after operating costs and capital spending, was positive at about $18.6B, although down year on year.
Capital expenditure (capex), spending on data centres and equipment, came in at $45.2B including finance leases, about 30% above the prior year and below a StreetAccount estimate of about $50.7B. On a property-and-equipment basis it was about $39.4B. CFO Amy Hood attributed the shortfall to delayed third-party capacity deliveries, not a pullback.
The bill is still rising:
- Q1 actual: $45.2B including finance leases
- Q2 outlook: more than $50B
- FY2027 outlook: about $170B, weighted to the second half
The calendar-2026 outlook had already been trimmed from about $190B to about $175B on lease-accounting and delivery-timing changes. Morningstar expects cash-flow pressure to intensify but stay positive through FY2027, and it raised its capex forecasts, which lifted its revenue projections.
Microsoft’s $170B FY2027 outlook sits inside a wider build-out, with hyperscaler AI capex across Amazon, Microsoft, Alphabet and Meta running at record levels and the revenue-to-capex ratio emerging as the key sustainability metric.
| Measure | Microsoft | Alphabet |
|---|---|---|
| Quarterly capex | $45.2B | About $51.4B |
| Free cash flow | About $18.6B | About -$9.1B |
| Share reaction | Down about 0.2-0.5% post-market on 29 October | Fell sharply |
That contrast explains why 29 October treated the two differently. Microsoft shares rose about 3-4% after hours on 28 October, then held near $527-530, faring better than AI-linked peers amid valuation worries, capacity timing concerns, the Federal Reserve decision and weaker risk appetite.
The real test The selloff was a sector-wide check on whether AI revenue justifies capital intensity, not a verdict on Microsoft’s quarter.
Positive but shrinking free cash flow means you should watch whether Azure growth outruns rising depreciation, because that ratio decides whether the spending earns its return.
What does Morningstar’s $600 fair value say about the stock now?
Where the price sits
Eric Compton, CFA, published Morningstar’s view on 29 October, after coverage moved to a new analyst:
- Fair value: $600, unchanged
- Rating: 4 stars
- Economic moat: wide, meaning durable competitive advantages
- Uncertainty: medium
- Latest price: $530.14
Morningstar modestly raised its revenue and EPS forecasts. The stock sits within about 12% of fair value and is up roughly 50% from its March and June lows. The note also says shares trade in the “3-star range” despite stating a 4-star rating, an inconsistency that sits with Morningstar.
The note’s reference to Azure at “approximately 45% currently” reflects guidance or expectations, not the reported 48%.
A price this close to fair value means the stock is no longer cheap on Morningstar’s numbers. You are being paid mainly for execution on cash returns, not for a mispricing.
What could break the thesis
The disagreement is not whether demand exists but how fast it converts into high-return free cash flow. GAAP EPS of $4.92 also includes an OpenAI-related gain, against adjusted EPS of $4.89, a reminder that the investment can distort reported profit.
| Risk | Cautious view | Counterargument |
|---|---|---|
| Capex burden | About $170B in FY2027 could pressure margins and cash flow for years | Positive free cash flow, Azure growth and backlog |
| Capacity constraints | Delayed GPUs could hamper the 49-50% Azure guide | Efficiency gains offset part; capacity expected in second half |
| Competition | AWS and Google Cloud offer their own models and chips | Integrated stack lowers adoption friction |
This is analyst commentary, not personal advice.
What the quarter changes, and what still needs proving
The operating results strengthen the case that AI demand is turning into recurring revenue. The capex path keeps cash returns as the open question.
Three checkpoints will test the thesis: whether Q2 Azure lands within the 49-50% guide, whether delayed capacity arrives in the second half, and whether free cash flow stays positive through FY2027. Your decision rests less on whether Microsoft can grow and more on whether that growth keeps paying for the build.
Investors exploring where AI capex flows downstream will find our detailed coverage of semiconductor cycle investing, which sets out a five-indicator framework for timing exposure.
This article is for informational purposes only and should not be considered financial advice. Investors should conduct their own research and consult with financial professionals before making investment decisions. Past performance does not guarantee future results. Financial projections are subject to market conditions and various risk factors.