
USD/IDR closed at Rp18,183 on 28 October, just Rp7 shy of the 2026 high of Rp18,190. A strong dollar is part of the story, but it is not the part most currency watchers are missing. Much of the pressure shaping the Indonesian Rupiah outlook comes from an equity index decision that has not been made yet.
On 15 October, MSCI proposed moving Indonesia from Emerging Market to Standalone status. The consultation runs until 30 April 2027, and nothing is final until mid-2027.
Markets have not waited. OCBC analysts Sim Moh Siong and Christopher Wong remain wary of the currency as foreign equity selling, Brent near US$110 and a firm dollar all push in the same direction.
Here is how to separate the structural drivers from the cyclical ones, what the chart levels say, and which signals would tell you whether pressure is easing or building.
Why is a pending index decision hitting the rupiah now?
A proposal is not a decision. Yet within a day of MSCI’s announcement, Jakarta’s stock market had suffered a record rout and the rupiah was sliding toward its high for the year.
The reason sits in what MSCI said, and how specifically it said it.
What MSCI is concerned about
MSCI argued that continued Emerging Market status was no longer appropriate, citing five problems:
- Weak transparency around beneficial ownership (who ultimately owns and controls shares) and shareholding structures
- Concentrated ownership and insufficient free float, meaning too few shares are available for public trading
- Allegations of coordinated trading or trading cartels
- Doubts about genuine price formation and market integrity
- The need for evidence of consistent regulatory implementation and enforcement
The index provider said it would proceed unless it sees meaningful improvement. The consultation closes on 30 April 2027, with a final decision due no later than 30 June 2027.
What authorities have done so far
The Financial Services Authority (OJK) and the Indonesia Stock Exchange (IDX) have not been idle:
- OJK cut the share-ownership disclosure threshold from 5% to 1%
- OJK strengthened free-float rules and created a list of highly concentrated shareholdings
- OJK held 16 structured sessions with MSCI between February and October 2026
- IDX will exclude stocks with high ownership concentration from its main Jakarta index from 2 November 2026
The problem is that most of these steps predate the proposal, and MSCI still judged them insufficient.
MSCI’s free float objection rests on a trust problem: with opaque beneficial ownership and concentrated holdings, the index provider cannot verify how much stock genuinely trades, which is why policy announcements alone carry limited weight.
No regional playbook Aletheia Capital‘s Angus Mackintosh called the proposal unusual, noting no clear Asia-Pacific precedent for a direct Emerging-to-Standalone move driven mainly by transparency concerns. He warned it could weaken the currency and raise Indonesia’s cost of capital.
The reform list shows authorities responding. The currency, however, is pricing enforcement credibility. That means you should not read new announcements alone as a turning point.
When big ASX news breaks, our subscribers know first
How does MSCI risk turn into rupiah selling?
If the threat starts in the stock market, how does it end up in the exchange rate? The answer is a chain of forced and voluntary decisions, each feeding the next.
- Index deletion: passive funds, which mechanically track an index, must sell securities removed from MSCI Emerging Market benchmarks.
- Active-fund pressure: managers measured against those benchmarks face tracking-error risk (the gap between their returns and the index) and may cut holdings.
- Liquidity and valuation: forced selling depresses prices and widens trading spreads, prompting further reductions.
- Cross-asset contagion: investors cutting equities may trim wider Indonesian exposure, including government bonds.
- Currency conversion: foreign sellers convert rupiah proceeds into dollars, pushing USD/IDR higher.
- Feedback loop: a weaker rupiah deepens foreign investors’ losses and raises hedging costs, which prompts more selling.
That final step is why the currency becomes the shock absorber. Each round of selling makes the next one more likely.
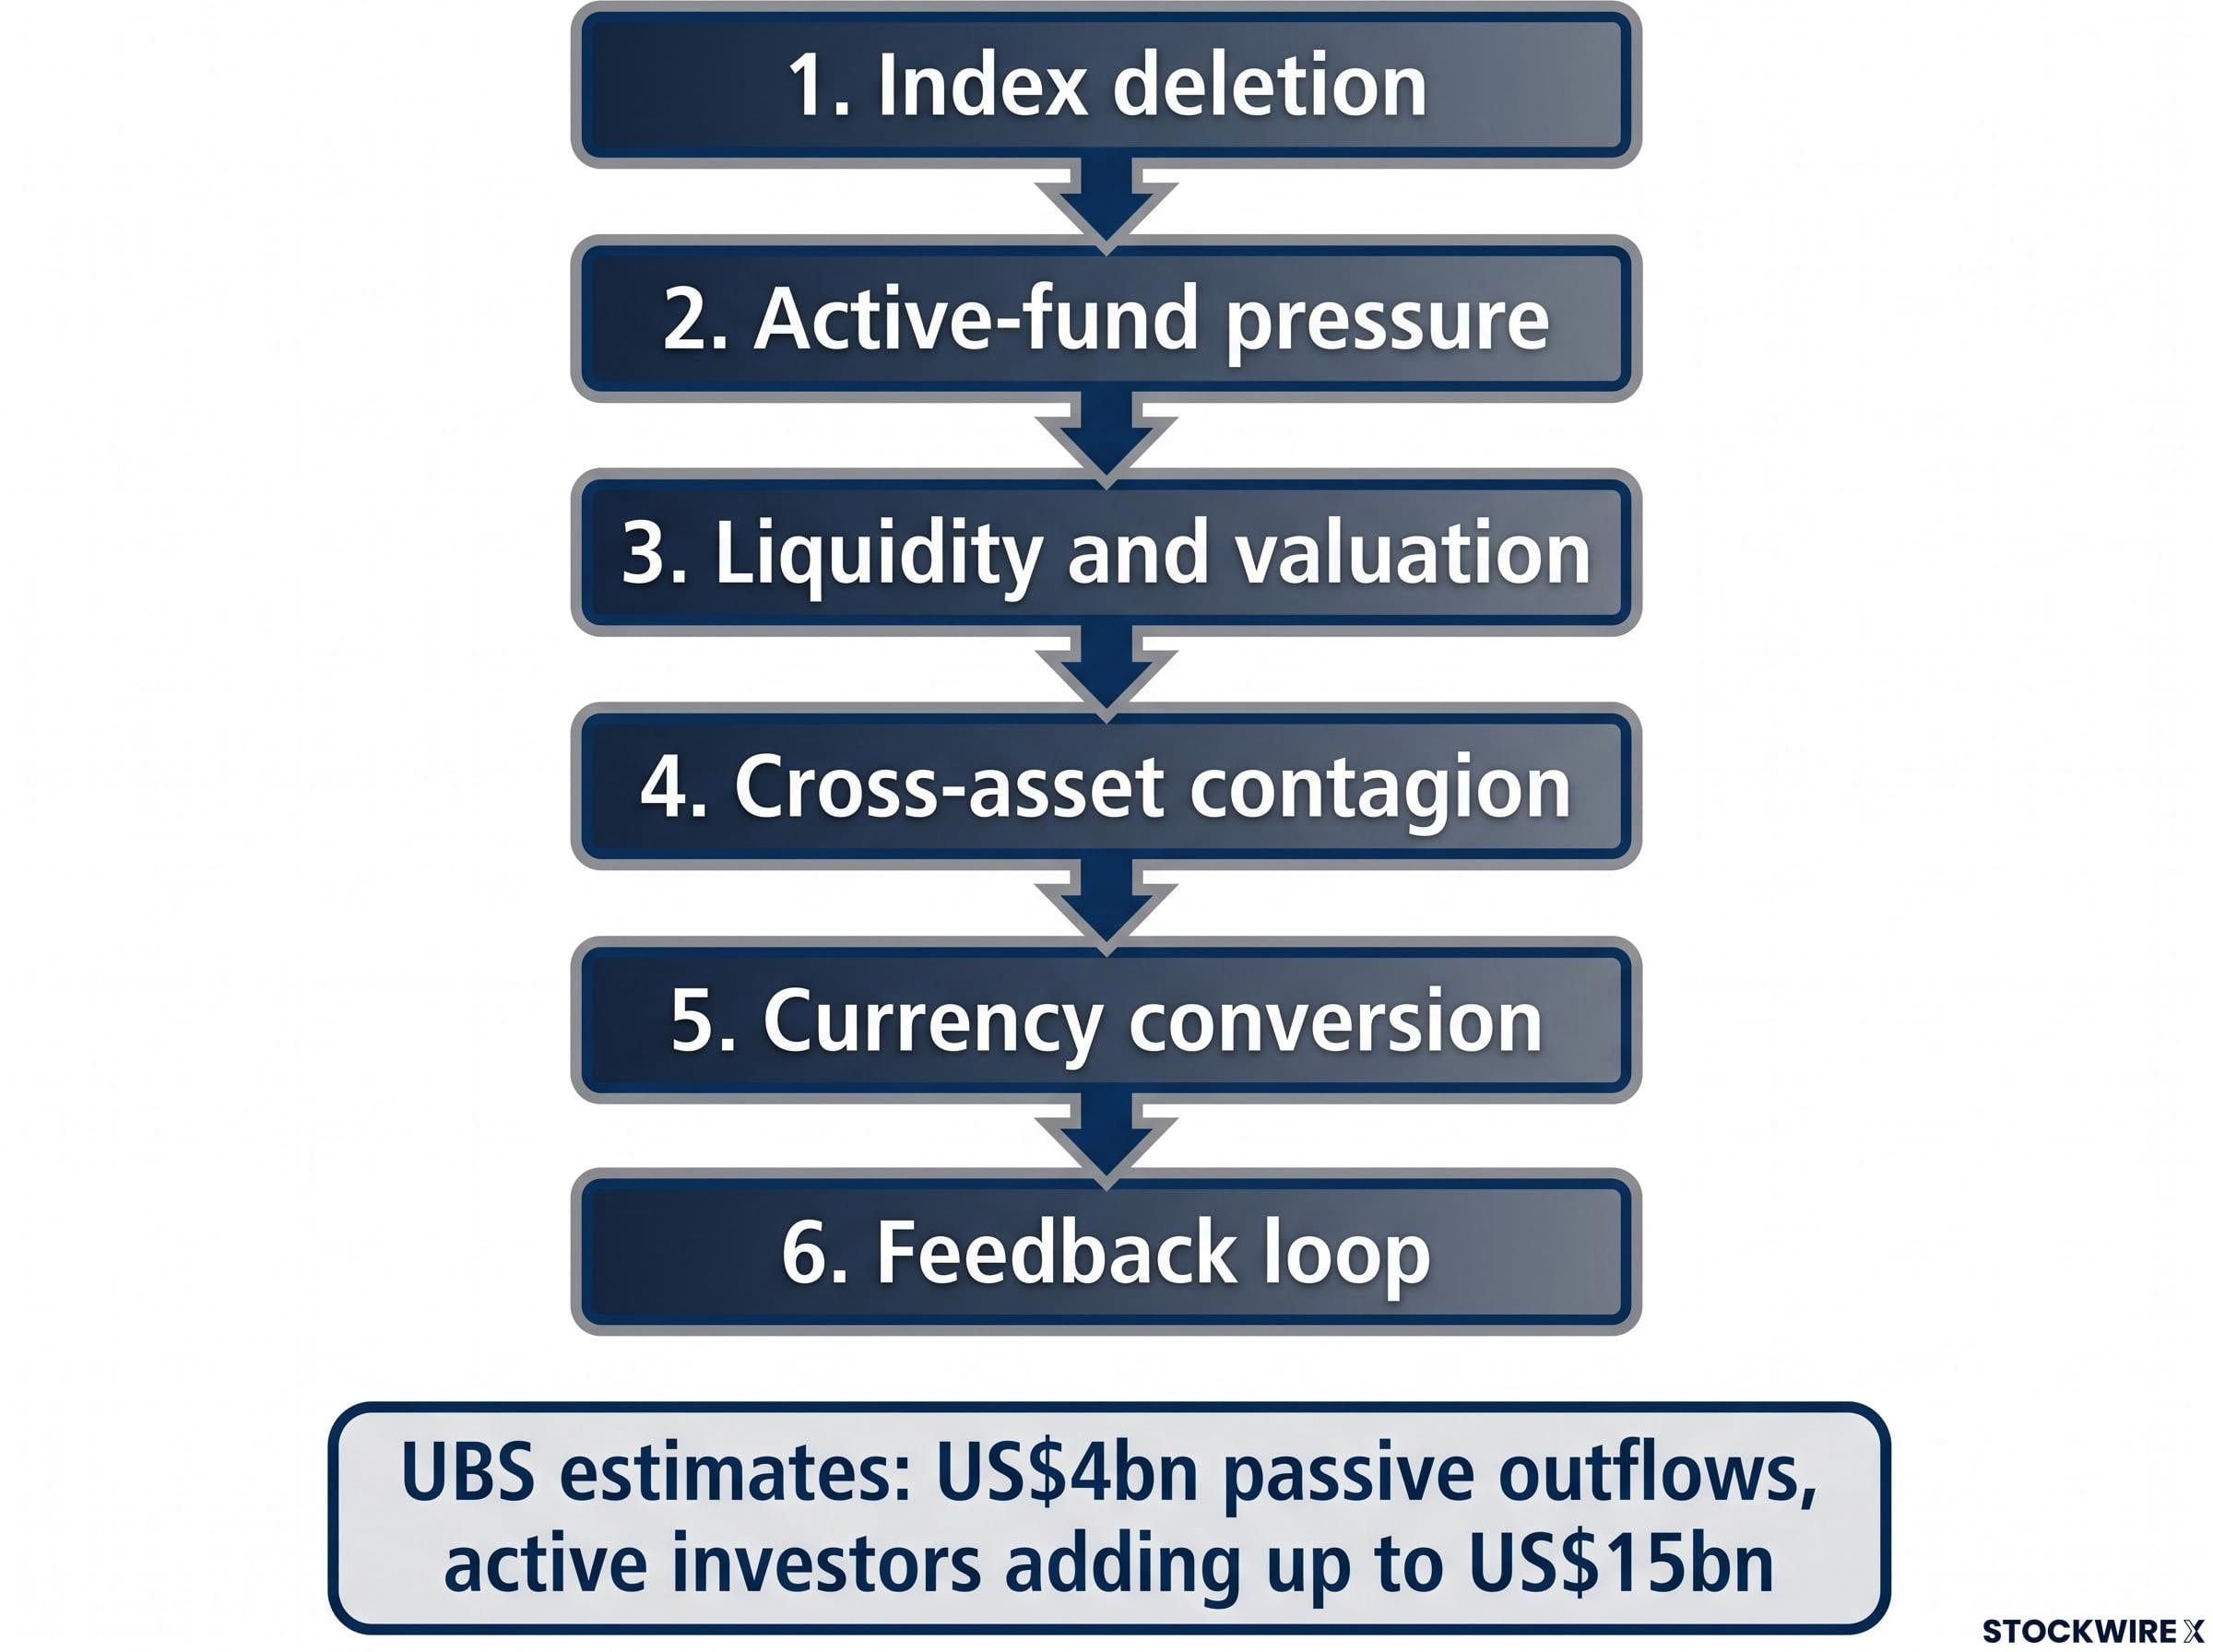
Sizing the exit UBS estimates a completed downgrade could trigger roughly US$4bn in passive outflows, with active investors potentially adding up to about US$15bn.
Two parallel pressures sit alongside the equity channel. With Brent at US$110.21 on 29 October (per Katadata), Indonesia’s energy import bill rises, worsening the current account and lifting dollar demand. A firm dollar compounds this by drawing capital toward US assets.
Past reclassifications offer rough guides, though each differs from Indonesia’s case.
| Market | Move | Effective date | Key driver |
|---|---|---|---|
| Argentina | Emerging to Standalone | 1 November 2021 | Capital controls |
| Russia | Emerging to Standalone | 1 March 2022 | Sanctions and market closure |
| Nigeria | Frontier to Standalone | 1 February 2024 | Accessibility and liquidity deterioration |
The lesson for you is that a currency can weaken on flows tied to an equity benchmark. Track equity flow data as a currency indicator, not just interest rate differentials.
The MSCI decision on South Korea in June showed how index judgments can trigger sharp, algorithm-driven selling, with a sidecar halt and a near 6% one-day KOSPI fall, even where the wider rally stayed intact.
What do the flow data and bond market say so far?
The equity numbers are stark. Foreign investors had sold a net US$4.88bn of Indonesian stocks year-to-date as of 19 October, according to Reuters, putting the country on track for its largest annual foreign equity outflow in at least 16 years.
The Jakarta Composite Index (JCI) fell more than 8% at the open on 16 October, triggering a 30-minute trading halt.
Bonds tell a more mixed story. The 10-year government bond yield climbed to 7.4% on 19 October from 7.169% three days earlier; rising yields mean falling prices. Yet Samuel Sekuritas reported on 13 October that bond flows had swung from a Rp0.3tn outflow in September to a Rp5.5tn inflow in October, though that was before the MSCI shock.
| Indicator | Figure | Source/date |
|---|---|---|
| Foreign net equity selling YTD | US$4.88bn | Reuters, 19 Oct 2026 |
| JCI opening fall | More than 8%; 30-minute halt | Jakarta Globe, 16 Oct 2026 session |
| 10-year yield | 7.4% vs 7.169% | Reuters, 19 Oct 2026 |
| Foreign bond flows | Rp5.5tn inflow Oct vs Rp0.3tn outflow Sep | Samuel Sekuritas, 13 Oct 2026 |
The data is dated, and no cumulative foreign bond-flow figure was available for the post-shock period. That gap matters.
OCBC’s key watch point is whether equity selling spreads significantly into government bonds. The mixed picture suggests this is not yet a full exit from Indonesia, so a reversal in bond flows would be the clearest sign the situation has escalated.
What does the USD/IDR chart say, and can Bank Indonesia hold the line?
The flows explain the pressure. The chart shows how stretched that pressure has become.
The technical setup
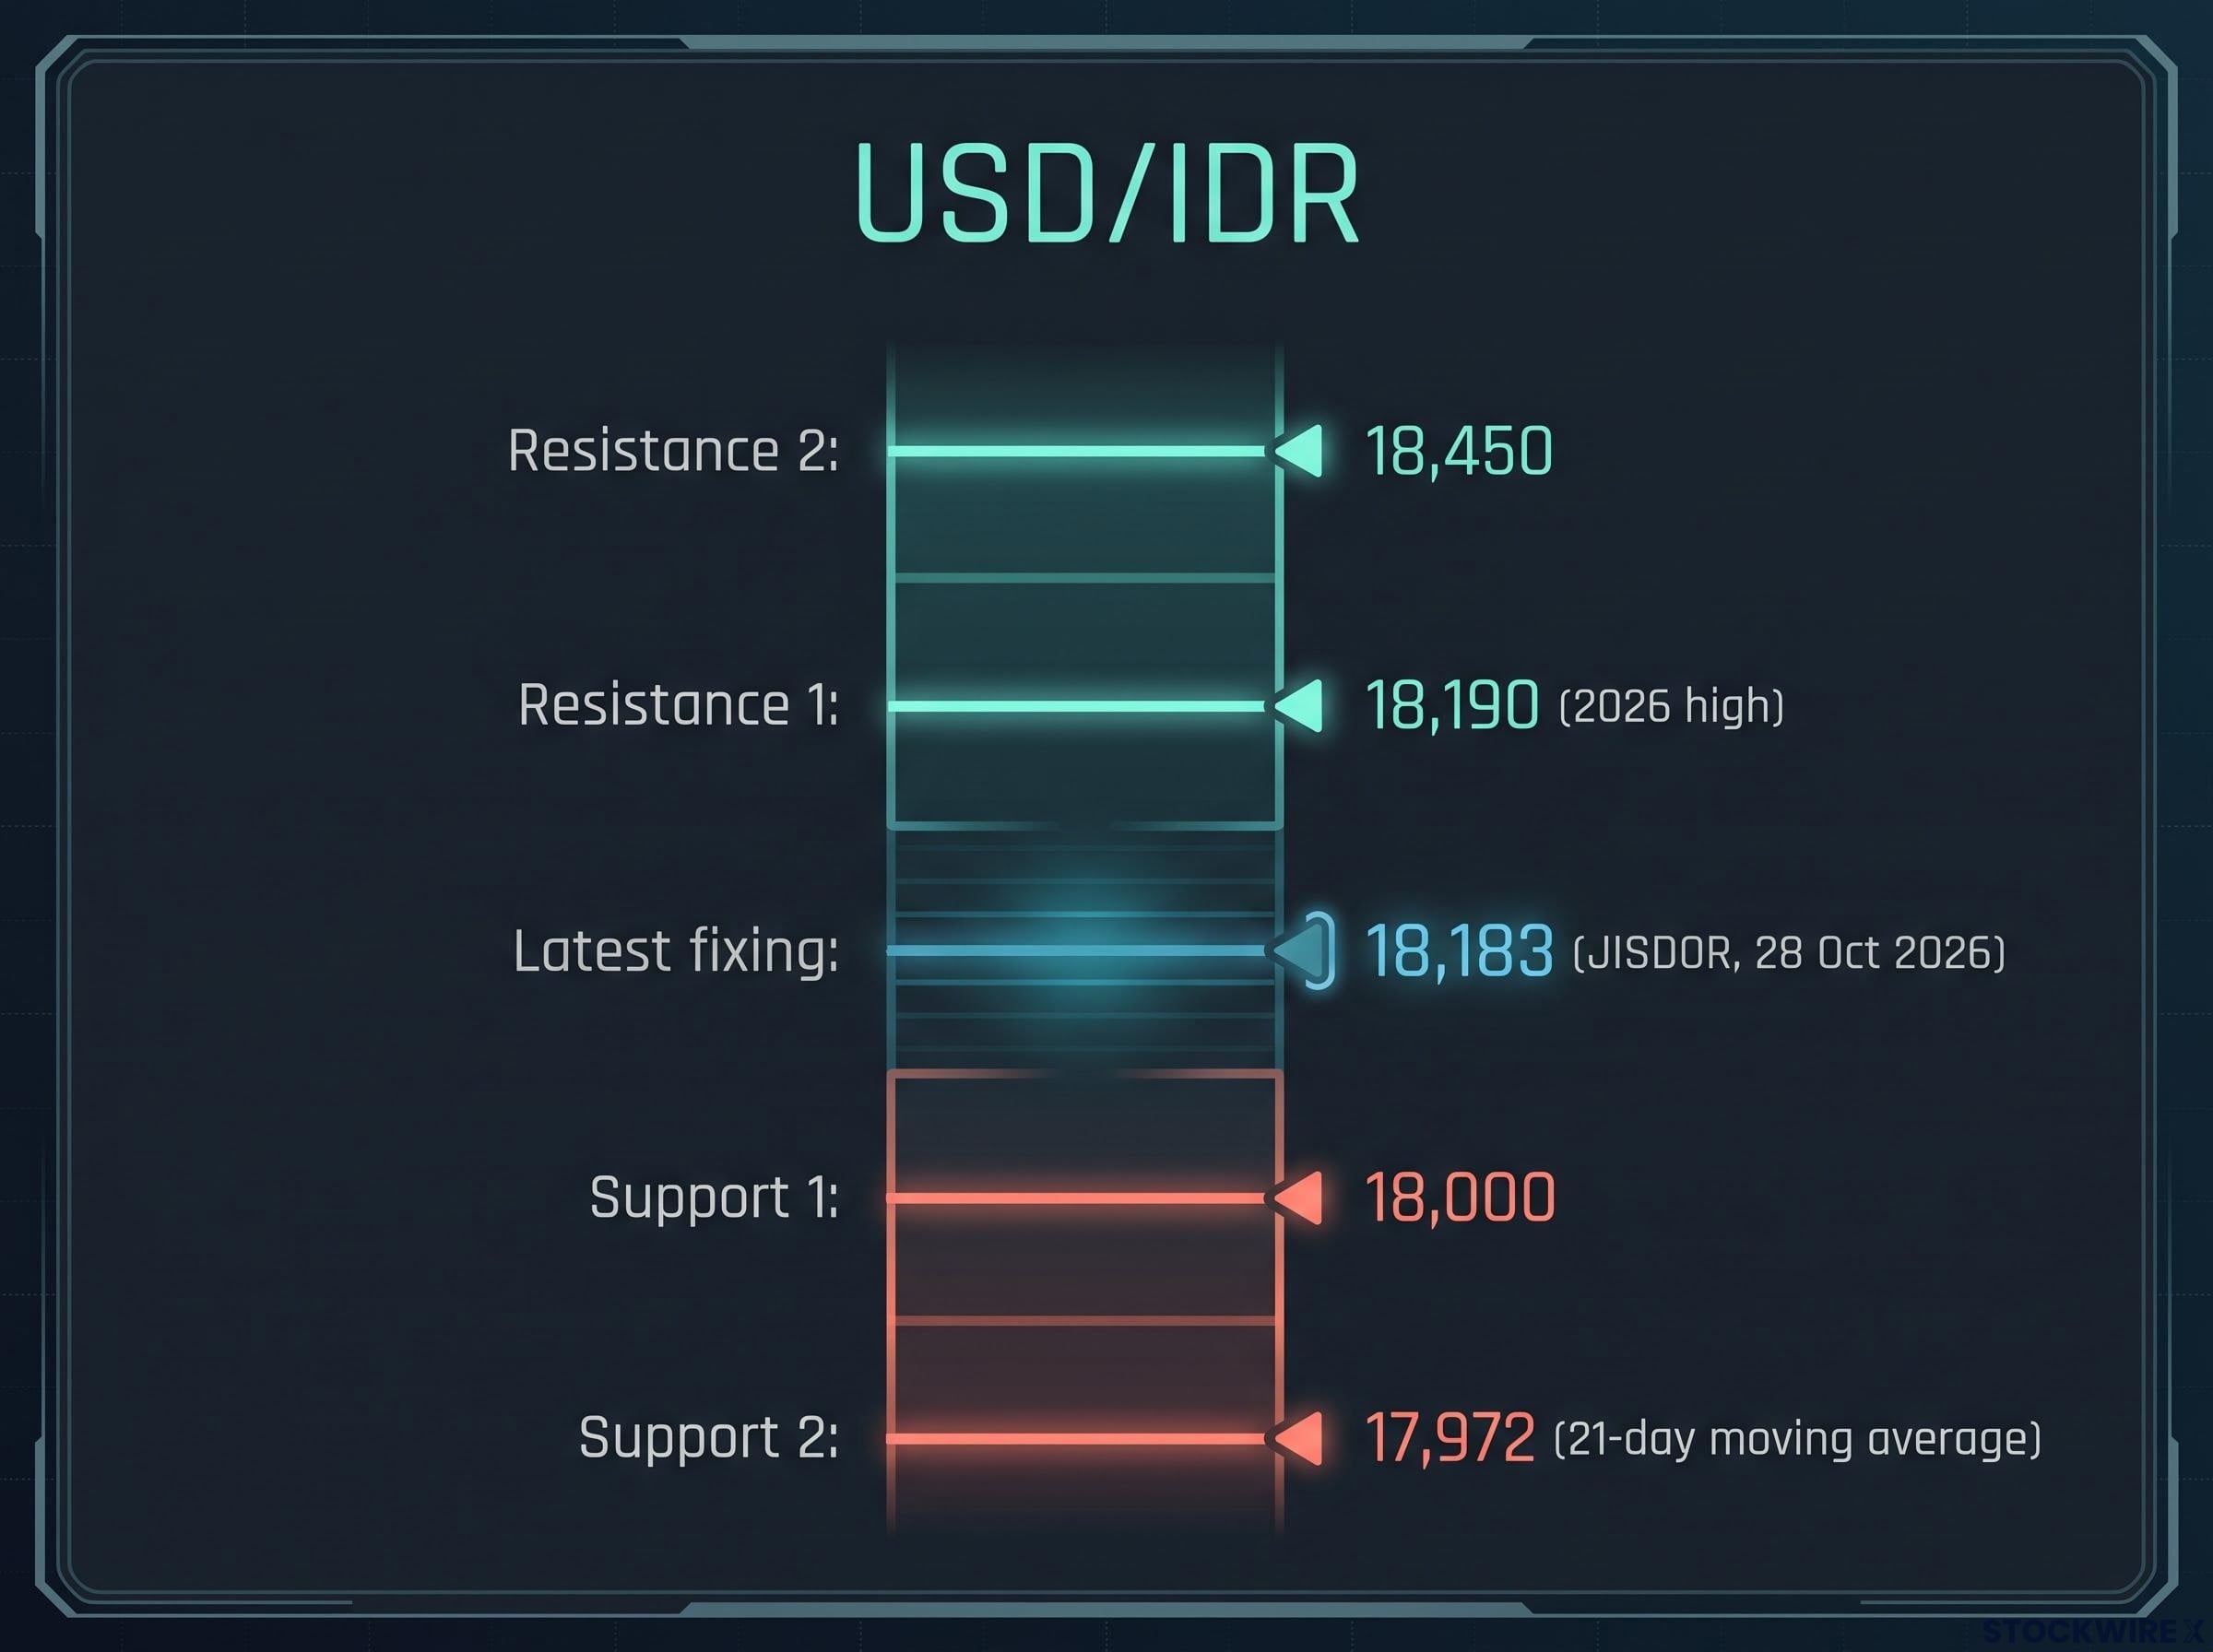
OCBC sees bullish momentum intact on the daily chart, which keeps an upward bias in USD/IDR. The pair has climbed from Rp18,040 on 19 October to the 28 October fixing of Rp18,183.
But the Relative Strength Index (RSI), a measure of how fast and far a price has moved, is now in overbought territory. Combined with proximity to the prior high, that leaves OCBC watching for a possible correction.
| Level type | Figure | Note |
|---|---|---|
| Resistance 2 | 18,450 | Next upside level |
| Resistance 1 | 18,190 | 2026 high |
| Latest fixing | 18,183 | JISDOR, 28 Oct 2026 |
| Support 1 | 18,000 | Round-number level |
| Support 2 | 17,972 | 21-day moving average |
Treat a break above 18,190 and a drop toward 18,000 as equally plausible near-term paths. The chart does not hand you a direction.
Policy response and the debate over tightening
At its 20-21 October meeting, Bank Indonesia (BI) held the BI-Rate at 5.75%, raised the Deposit Facility 25bp to 5.00%, cut reserve requirements and strengthened incentives for domestic non-deliverable forward (DNDF) hedging. That followed 100bp of hikes across three moves in May and June 2026.
Institutions disagree on whether that mix is enough:
- DBS (Radhika Rao): BI prefers intervention and hedging over hikes, which supports growth but may give less direct currency support
- MUFG: expects the BI-Rate at 6.25% by end-2026, while conceding rates cannot fix MSCI’s structural concerns
- Bloomberg: argued the rupiah’s defence may need a “rate-hike turbocharge”
- BCA research: sees the mix as balancing currency stability with growth
The split comes down to how hard BI must tighten. That question has a history.
How does this compare with 2013 and 2018, and what would change the picture?
Indonesia has been here before, in part. During the 2013 taper tantrum, the rupiah fell from about Rp9,790 to Rp12,189, outflows reached about Rp36tn (per BI research) and BI raised rates by 175bp. In May 2018, BI hiked twice in two weeks as rising US rates hit emerging Asia.
The PIIE taper tantrum analysis places Indonesia among the ‘Fragile Five’ economies hit by sharp currency depreciation and capital outflows in 2013, a useful baseline for judging how far 2026 pressures resemble that earlier episode.
Both episodes were global rate and dollar shocks. Rate hikes helped stabilise the currency.
2026 is different. A governance and market-structure concern now sits on top of the oil and dollar pressure, and no rate hike can fix beneficial-ownership transparency.
What could support a rebound:
- Easing oil prices and a softer dollar
- Stabilising portfolio flows, which could spark a sharp technical bounce
- A consultation window running to April 2027
- Bond inflows before the shock, showing not every foreign investor left at once
What keeps the risk elevated:
- Structural governance concerns that rate hikes cannot address
- Domestic fiscal uncertainty weighing on bonds
- Intervention limited by reserves and liquidity
OCBC’s threshold Cheaper oil and a softer dollar might bring short-lived breathing room, yet OCBC contends that a lasting rupiah recovery depends on proof that portfolio flows are steadying.
Because past recoveries relied on tools that cannot touch a governance problem, do not assume they will repeat on the same timeline. Watch these signals:
- Whether foreign selling spreads into government bonds
- Movement in the 10-year yield relative to 7.4%
- Evidence of enforcement from OJK and IDX, and any MSCI response
- Brent’s direction from around US$110
This article is for informational purposes only and should not be considered financial advice. Investors should conduct their own research and consult with financial professionals before making investment decisions. Past performance does not guarantee future results, and the views cited are speculative and subject to change.
Reading the rupiah from here: what is structural and what is not
The rupiah faces two kinds of pressure, and they will not ease together. Cheaper oil or a softer dollar could deliver relief within weeks. A durable rebound needs something slower: credible enforcement of Indonesia’s market reforms, a favourable MSCI outcome and portfolio flows that stop draining.
The chart reflects that tension. Momentum points higher near 18,190, while overbought readings leave room for a pullback toward 18,000.
Before changing your exposure, check four things in order: foreign equity flows, government bond yields and flows, MSCI and regulator developments, and Brent. If bonds hold and enforcement shows up, the structural story can start to turn. If selling spreads, the cyclical relief will likely prove short-lived.
—