Through September, the S&P 500 never once closed higher on a Federal Reserve announcement day in 2026. Most of those meeting weeks still finished in positive territory. If you trade on Fed announcement days, that gap is the signal you are probably missing: the first reaction is a poor guide to what happens next.
Yesterday’s decision on 28 October 2026 arrived with that pattern already in question. The Fed reportedly held rates steady, and the S&P 500 reportedly closed modestly higher even as Treasury yields climbed.
That exception makes the lesson more useful, not less. Stocks and bonds told different stories on the same afternoon. The question is which one you should believe, and when.
This guide gives you a way to sequence your decisions on a Fed day. You will learn which markets to watch besides stocks and how to avoid paying the price for being early.
Why does the first move on a Fed day so often mislead?
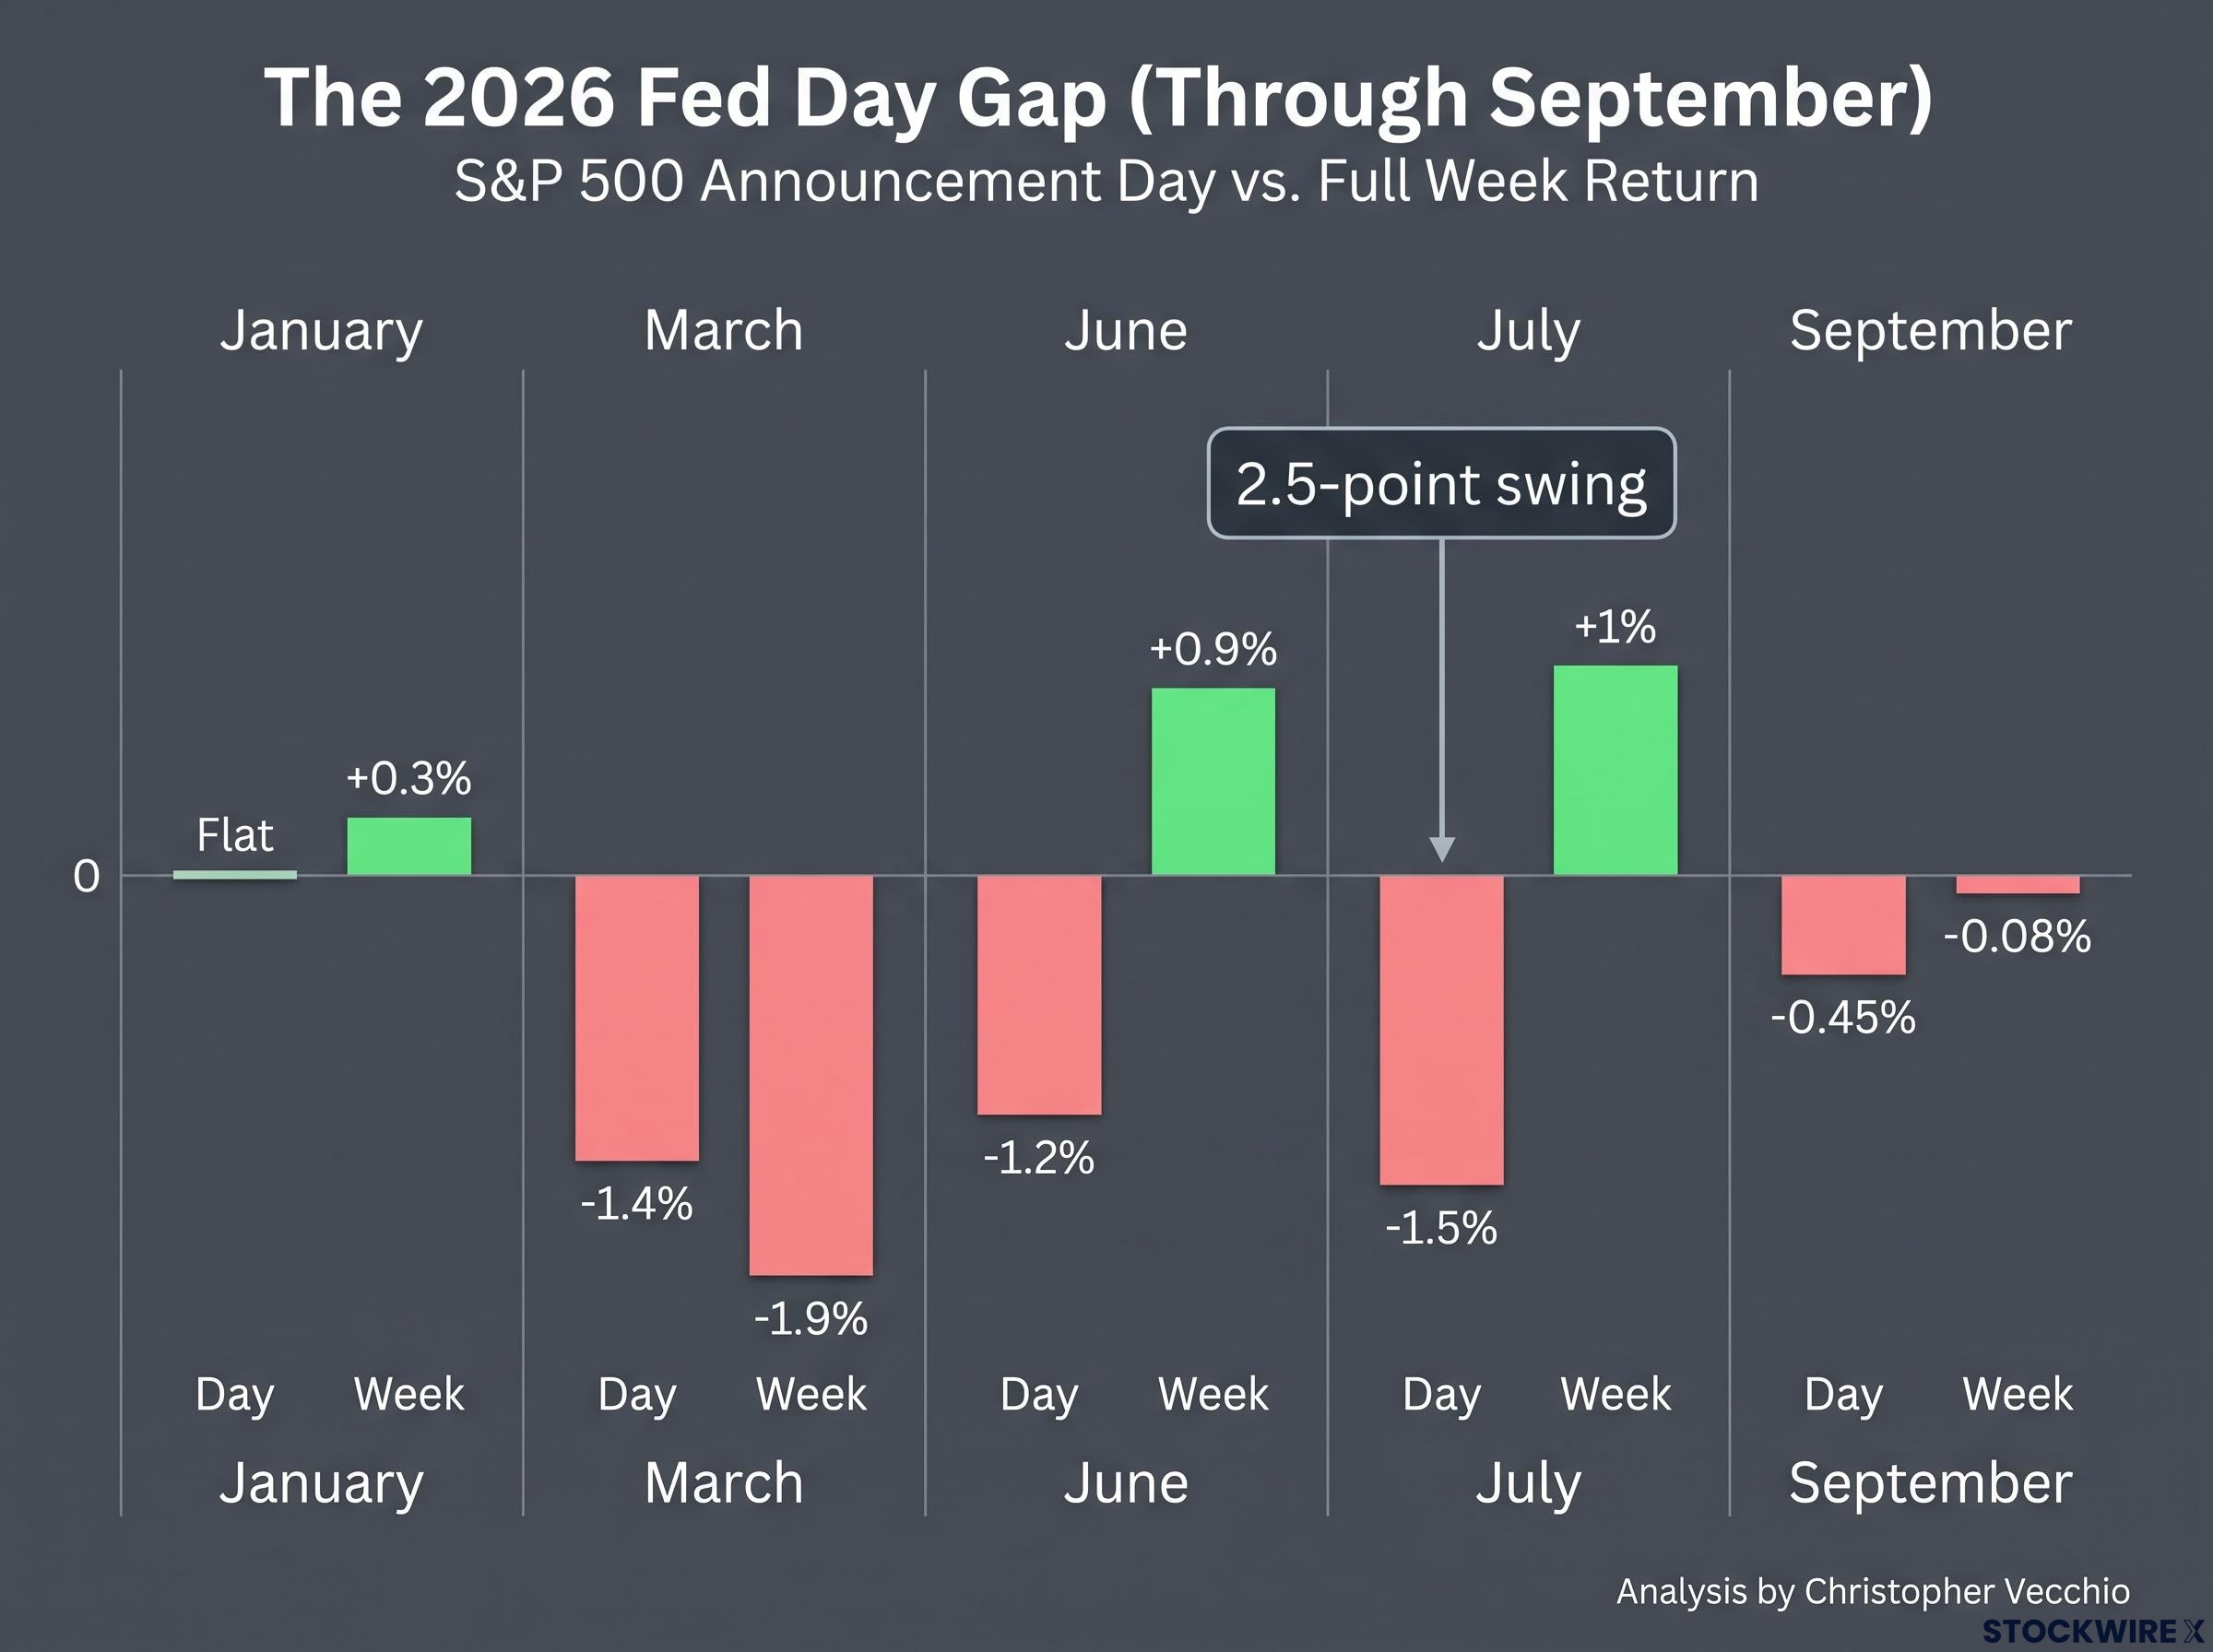
Start with the 2026 record. Analysis by Christopher Vecchio found that across six Federal Open Market Committee (FOMC) decisions through September, the S&P 500 posted no positive announcement-day return. The FOMC is the Fed committee that sets interest rates. January was roughly flat.
Four of those six meeting weeks still ended higher.
| Meeting | Announcement-day S&P | Week return | Gap | Takeaway |
|---|---|---|---|---|
| January | Roughly flat | +0.3% | Small | Flat day, positive week |
| March | -1.4% | -1.9% | Weakness extended | The one clear case where the selling persisted |
| June | -1.2% | +0.9% | 2.1 points | Red day, green week |
| July | -1.5% | +1% | 2.5 points | Largest reversal of the year |
| September (hike) | -0.45% | -0.08% | Loss nearly erased | Even a rate hike was largely absorbed |
September is the one to sit with. The Fed raised rates on 16 September, the S&P 500 fell, and by the end of the week almost the entire loss had been recovered.
The July gap A -1.5% announcement day turned into a +1% week. That is a 2.5-point swing you would have missed by selling the close.
The wider history adds to the doubt. Since 2022, Vecchio’s figures show meeting-week moves of about +6.2%, +5.9%, +4.7% and -5.8%, while announcement days ranged from roughly +3% to nearly -3%. Moves that large, pointing in inconsistent directions, are not a verdict.
What this means for you: an announcement-day close tells you how the market felt about the first half hour, not where the week is going. A red day is not a reason to tear up your plan.
Why a small sample demands humility
The Fed holds roughly eight scheduled decisions a year, so a pattern built on 2026 alone is statistically weak. Yesterday’s reported gain, about 0.1% to 0.3% depending on the outlet, is a reminder that this is a tendency, not a law.
When big ASX news breaks, our subscribers know first
What happens in the hours after the Fed speaks?
If the first move misleads, you need to know what replaces it. A Fed day unfolds in layers, and each one can overwrite the last.
- Algorithmic parsing. Machines compare the new statement with the previous one, word by word, and move Treasury futures, Fed funds pricing, the US dollar and equity futures within seconds.
- The press conference. Chair Kevin Warsh can shift the emphasis toward inflation or jobs in ways the statement did not signal.
- The bond market response. Treasury yields reprice the expected path of rates, and that matters more than the stock reaction.
- The next day. Updated forecasts, options dealer hedge adjustments, overseas trading and sometimes Treasury reversals arrive.
- The earnings overlay. This week, Microsoft, Alphabet and Amazon report, together about 15% of S&P 500 market value, which may outweigh the Fed itself.
The press conference is where you get caught out. Yesterday, yields reportedly reacted to the statement and then moved again during Warsh’s comments, so the first bond move was not the final one either.
Research points the same way. The New York Fed has reportedly found the S&P 500 rose an average of 49 basis points in the 24 hours before scheduled announcements, with volatility then jumping at release. A basis point is one hundredth of a percentage point. The calm before and the jolt after are both part of the pattern.
When good news still closes lower
Two reported episodes show why the rate decision alone tells you little. On 18 September 2024, the Fed cut by 50 basis points; the S&P 500 rose as much as 1%, closed lower, then hit a record the next day.
On 18 December 2024, a 25 basis point cut came with a slower easing path, and the index reportedly fell 2.95%. The cut was welcome. The guidance was not.
The September 2025 episode shows the same logic from the other direction: a cut with over 90% probability already priced into futures confirmed expectations rather than delivering news, and markets barely reacted despite a hawkish dot plot.
For you, the decision is usually already priced in. Judge the day by the surprise in the guidance and tone, not by the rate change itself.
Why do bond yields matter more than the stock reaction?
Here is the puzzle from yesterday. The Fed reportedly held at 3.75%-4.00%, yet the 2-year yield rose to about 4.776% and the 10-year to roughly 5.02%-5.05%.
How does a hold push yields up? The vote was reportedly 10-2, with two officials favouring a hike, and traders read that as a sign of where policy goes next. CME FedWatch, a tool that converts futures prices into rate-move probabilities, reportedly showed December hike odds rising to about 85% from 78.3%, even though a hold had been priced at roughly 90% or more beforehand.
A hold can still read as hawkish when the committee splits, and the July meeting showed it: three hawkish dissents for an immediate hike sent the 30-year yield to its highest level since 2007.
That is why bonds are the better translator. A dovish Fed can still hurt stocks if 10- or 30-year yields surge, and a hawkish Fed is easier to absorb if long yields fall.
Rising yields can mean two different things, and the equity consequences differ.
| Interpretation | Mechanism | Evidence | Equity implication |
|---|---|---|---|
| Policy path | Short and intermediate yields rise on a likelier hike | December hike odds near 85%; 2-year and 10-year higher | Pressure on rate-sensitive growth stocks |
| Term premium and growth | Long yields rise on inflation, borrowing, oil or growth risk | Investors focused on longer-term rate uncertainty after September | Valuations compress through higher discount rates and financing costs |
Term premium is the extra yield investors demand for holding longer-dated bonds. If the front end leads, the market is repricing the Fed. If the long end leads on its own, something broader is worrying bond buyers.
On a Fed afternoon, check these before trusting any stock move:
- 2-year yield: the cleanest read on near-term Fed expectations
- 10-year yield: the benchmark for valuations and borrowing costs
- 30-year yield: a gauge of long-run inflation and term premium worries
- US dollar: confirms or contradicts the hawkish or dovish reading
Treat a stock rally alongside climbing long yields as provisional. Yesterday’s modest gain with higher yields shows the link is not mechanical, so wait for Treasuries to confirm before you trust the equity move.
How do SR3 futures show what the market expects next?
If yields tell you the market’s mood, Three-Month SOFR futures (SR3) tell you its arithmetic. SOFR, the Secured Overnight Financing Rate, is a benchmark for overnight borrowing that tracks the Fed’s policy rate closely.
Reading the strip
The maths is simple. The implied rate equals 100 minus the contract price, so a price of 96 implies 4%.
Worked example Vecchio cited the December 2026 contract (SR3Z6) near 95.795. 100 – 95.795 = 4.205% implied rate. He read that as roughly an 80%+ chance of one more hike this year.
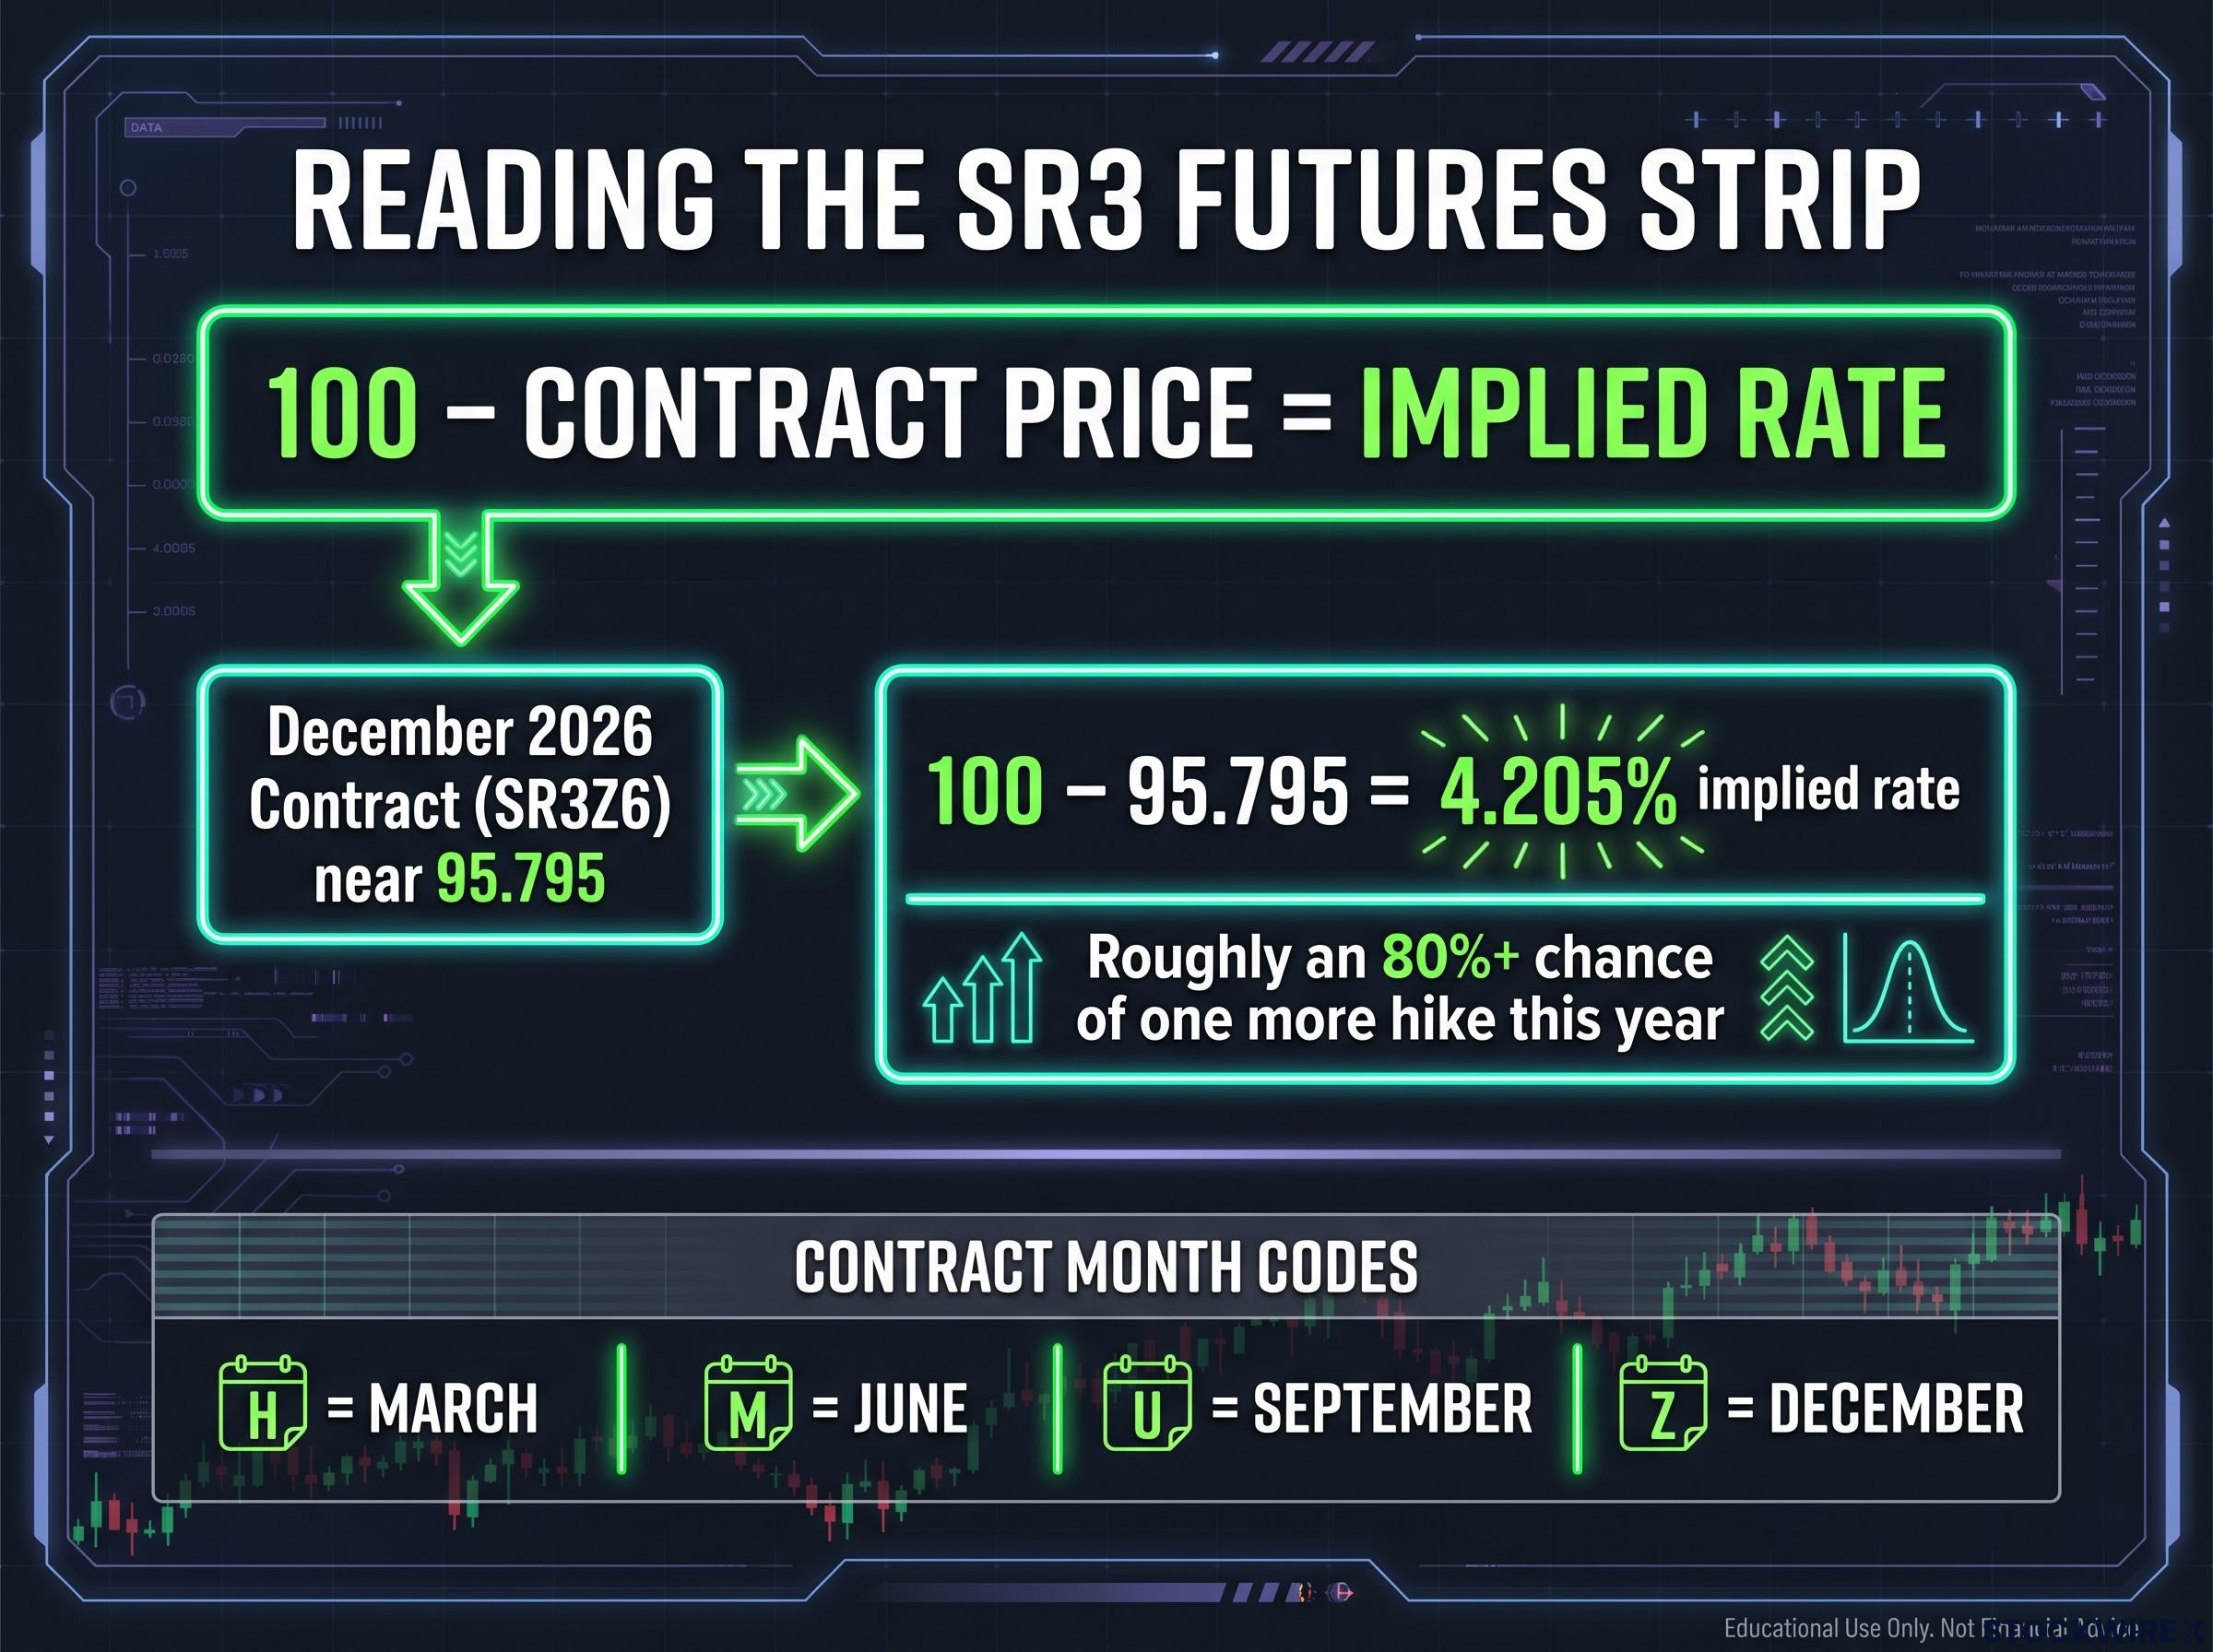
Contracts expire in March, June, September and December, coded H, M, U and Z. Line them up and you get the strip, the market’s expected rate path well beyond the next meeting. Falling prices mean higher expected rates; rising prices mean lower ones.
SR3 tells you three things the statement does not:
- The full path: where rates are expected to sit several meetings out
- The size of the surprise: how far the Fed’s guidance landed from what was priced
- Real-time repricing: whether a hold is being read as neutral or quietly hawkish
FedWatch works from this pricing, but treat it as a probability, not a forecast of how stocks will react. Yesterday’s hold was reportedly priced at about 90-93%, yet pricing shifted toward a December hike afterward.
Why traders take hours to agree on the surprise
Context complicates the read. Vecchio flagged diesel above $6 a gallon and gasoline near $5, plus concerns around credit markets and the AI buildout. A “no hike” signal in that setting could read as relief, or as worry about what the Fed is seeing.
Interest is climbing too. CME Group reportedly put average daily SOFR options volume at about 1.6 million contracts, up 41% on the prior month.
The lesson for you: the surprise lives in the gap between priced expectations and the Fed’s guidance. A decision that matches consensus can still move markets hard.
How should you manage risk and when should you act?
Everything so far argues for patience. Here is how to turn that into a plan.
Vecchio’s approach is to avoid high-conviction bets on announcement day, cut position size if volatility demands it, and wait for next-day confirmation from bonds, the dollar, the CBOE Volatility Index (VIX) and market breadth. The VIX measures expected S&P 500 volatility; breadth measures how many stocks are joining a move.
- Before the release: note where SR3, the 2-year and the VIX sit, and decide your size.
- At the statement: watch, do not act. This is the algorithms’ move.
- During the press conference: track whether yields reverse.
- At the close: compare the stock move with the 10-year and the dollar.
- Next morning: check whether buyers return, whether the 10-year reverses and how the VIX behaves.
Options and the volatility crush
Implied volatility, the level of future price swings priced into options, tends to rise into a meeting and collapse afterward. Federal Reserve research reportedly found conditional volatility about half its normal level the day before meetings and about 40% above normal on decision days. If you buy options just before the announcement, you can be right on direction and still lose as that premium drains away.
For readers wanting to trade volatility around meetings, our deep-dive into VIX futures premiums and contango explains why futures sit above spot and what that costs you.
A worked example: the neutral MNQ position
Vecchio described a neutral position in Micro E-mini Nasdaq-100 futures (MNQ) options, structured as an iron condor. That is a strategy that profits if the index stays within a range. The range has held since late April 2026, roughly 27,500 to 31,500-31,750, with about 37 days to expiration.
His exit trigger is a break below 29,000, especially alongside a VIX spike. A VIX below 15 with the Nasdaq above 31,000 would threaten the short call side. This is an illustration of defining exits in advance, not a recommendation.
Keep these caveats in front of you:
- FedWatch is a probability, not a prediction of the market’s reaction
- Early interpretations are the least reliable ones you will get
- One year of data cannot settle a rule
The principle Being conservative and late but right beats being early and wrong.
Waiting a day costs you a little upside. It removes the biggest avoidable loss: acting on the first, least reliable reading.
Making the next Fed day a plan instead of a reaction
Three ideas carry the whole approach. The first move is a shock, not a verdict. Bonds and SR3 pricing reveal what the market expects next. Next-day confirmation separates signal from noise.
The 2026 record, including yesterday’s reported exception, supports patience rather than a fixed rule about which way stocks go.
Before the next meeting, write down which signals would change your thesis (a sustained jump in the 10-year, a sharp shift in SR3 pricing, a VIX spike through your exit level) and which you will ignore. Then let the market show you which ones arrived.
This article is for informational purposes only and should not be considered financial advice. Investors should conduct their own research and consult with financial professionals before making investment decisions. Past performance does not guarantee future results. Market-implied probabilities and projections are speculative and subject to change based on market conditions and policy developments.