On a recent Monday, only 52% of Nasdaq volume flowed into rising stocks. When mega caps and semiconductors rally, that figure usually sits near 62%, and the last time it came in this soft was just before the early October sell-off. The question is what that gap says about an index that looks calm from the outside.
Today is 29 October 2026, and the calendar is crowded. The Federal Reserve has just met, Microsoft, Alphabet and Amazon report this week, and the 3 November midterms are days away. After three to four months of sideways trading, the headline index gives you very little to work with.
Market breadth indicators and other internal gauges fill that gap. Technical analyst Helen Meisler leans on them heavily, and her current read serves as the working case study here.
Once you have read this, you will be able to interpret breadth, net volume, sentiment and relative-strength readings yourself. You will also know the three levels Meisler is watching: the Russell 2000 downtrend line, 12,500 on the semiconductor index and 700 on QQQ.
What do market breadth indicators actually measure, and why do they matter when the index goes sideways?
An index can hold steady while most of its members slide. That happens when a handful of heavily weighted stocks do the lifting. Breadth tools answer one question for you: who is carrying the market?
You can see the same pattern in the share of stocks holding above their 50-day average, a measure of participation behind a calm index that shows how narrow a rally has become even while the headline number looks steady.
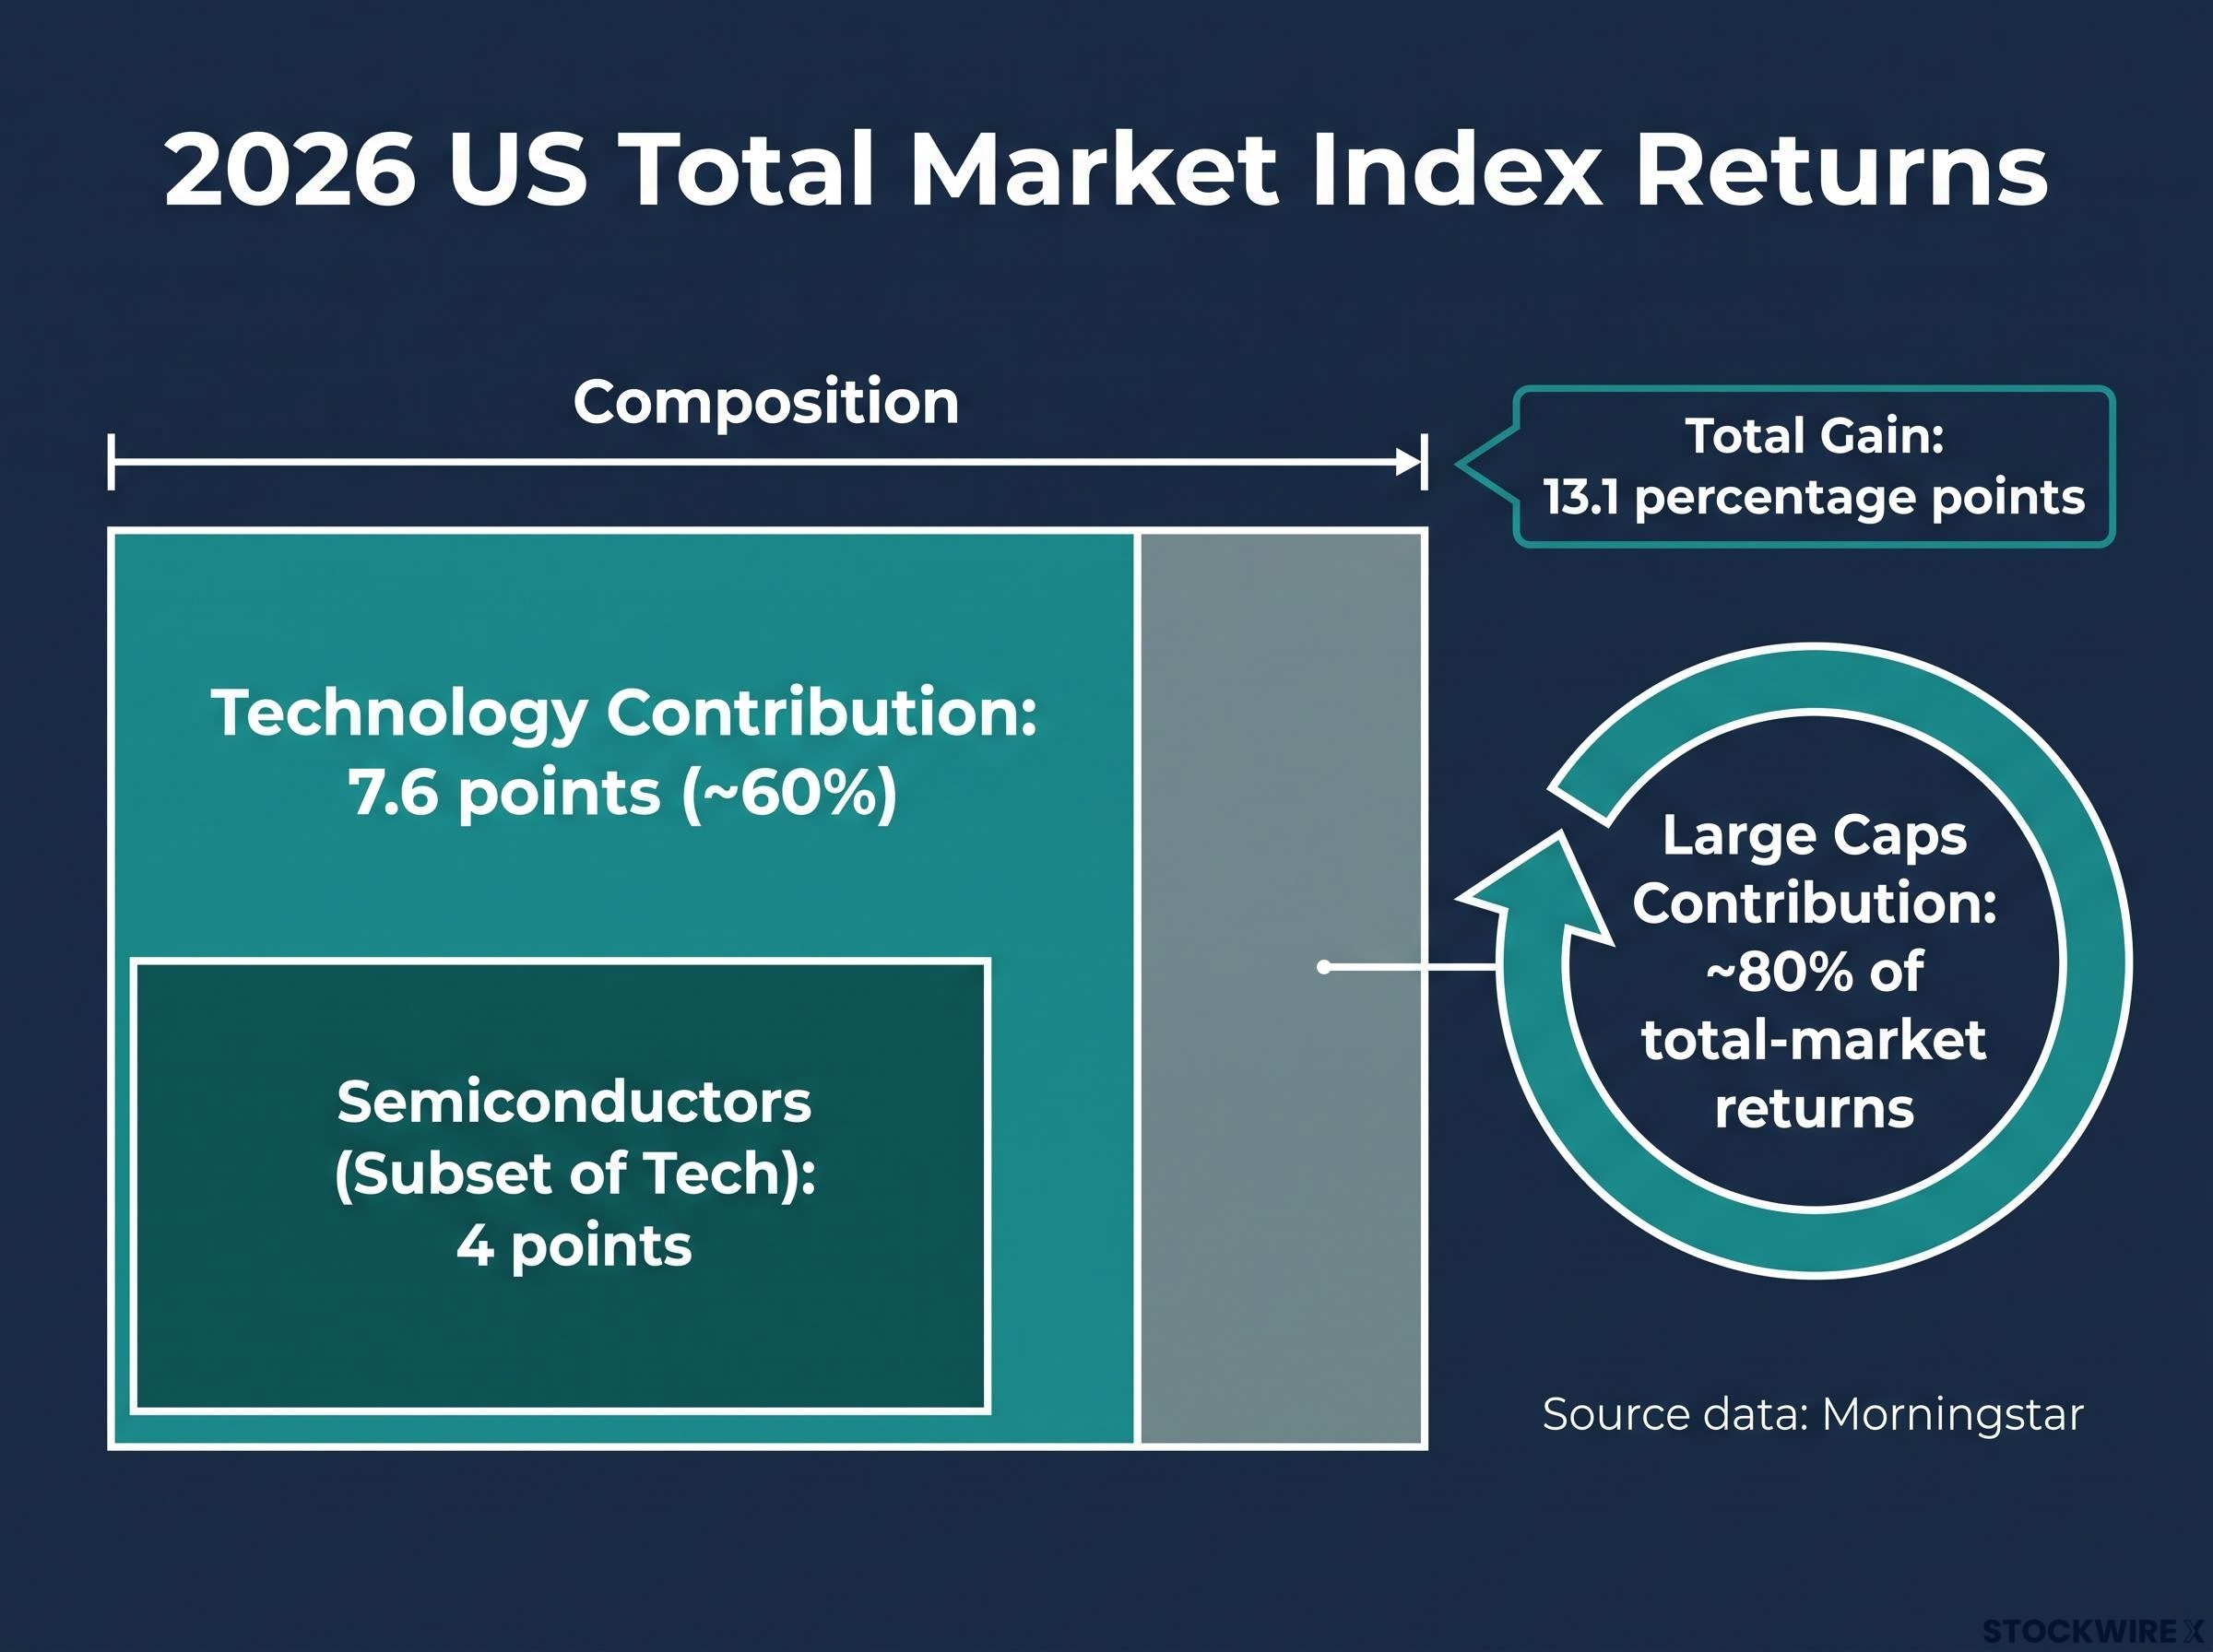
Concentration is not hypothetical this year. Morningstar attributed 7.6 of the 13.1 percentage points gained by its US Total Market Index in 2026 (about 60%) to technology, with 4 points from semiconductors alone. Large caps supplied roughly 80% of total-market returns.
The four core gauges
Each gauge looks at the market from a different angle, so a weak reading means something slightly different in each case.
| Indicator | What it measures | What a weak reading signals |
|---|---|---|
| Net up volume | Volume in advancing stocks minus volume in declining stocks | Gains are coming from a few heavily weighted names |
| Advance-decline (A-D) line | A running count of rising stocks minus falling stocks | Fewer stocks are leading; the largest constituents carry the index |
| RSP/SPY ratio | Equal-weight S&P 500 versus the standard cap-weighted index | A falling ratio points to mega-cap leadership |
| New highs vs new lows | Stocks hitting 52-week extremes | Rising new lows reveal damage beneath the surface |
One point catches people out. RSP, the Invesco S&P 500 Equal Weight ETF, holds the same large-cap stocks as the S&P 500, each at equal weight. It tells you whether the average large company is keeping up, not how small caps are faring.
These gauges can also run opposite to price in useful ways. Meisler pointed to one sharp down day when the S&P fell nearly 100 points, yet NYSE breadth was positive and 52% of NYSE volume was upside. Positive net volume on a down day like that suggests the selling was concentrated in a few giants rather than spread across the market as panic.
Likewise, fewer new lows while prices keep falling is a positive divergence. It is an early signal, not a confirmation.
Where each gauge can mislead you
- Profitable mega caps can lead for long stretches, so narrow breadth is not automatically bearish.
- Volume reacts to events such as options hedging, index rebalancing, ETF flows and earnings.
- Oversold breadth can stay oversold for longer than you expect.
- Equal-weight leadership can be short-lived.
- A-D lines can give false signals during sector transitions.
Treat narrow breadth as a warning light, not a sell signal. These gauges tell you how fragile a trend is. They do not tell you when it ends.
When big ASX news breaks, our subscribers know first
Digestion or distribution: what Meisler’s equal-weight ratio and Nasdaq net volume are saying now
That fragility question is exactly where Meisler is stuck. Digestion means the market is pausing to absorb earlier gains. Distribution means large holders are quietly selling into strength. In a sideways tape, the two look almost identical.
Her rule is simple. Until the RSP/SPY ratio makes a higher high, this remains the same mega-cap-dominated market, and short rallies elsewhere are interludes. She says the ratio has moved sideways for nearly a year, and a similar pattern two years ago ended in a breakdown as mega caps took over.
October seems to argue with her. RSP gained about 4.6% from 30 September to 27 October, against roughly 0.9% for SPY. One data provider reported RSP up about 4.9% in October, its strongest monthly showing relative to SPY since April 2009, though that figure has not been independently confirmed.
So why not call it broadening? Because one strong month inside a year-long range is not a higher high. The bar Meisler sets is concrete, and you can check it on any charting platform.
One good day does not settle the argument, and the strongest breadth session since April, when 403 stocks advanced and the equal-weight index jumped 1.15%, showed improved participation without confirming a regime change.
Nasdaq net volume adds the other side of the ledger. It led the index until about June or July, then stopped leading and is now merely keeping pace. Meisler would call the situation distribution if that measure turns down.
The volume gap Nasdaq upside volume typically runs near 62% during mega-cap and semiconductor rallies. On a recent Monday it was 52%, close to the reading seen before the early October sell-off.
QQQ fell about 2.5% over the same window, with around 60 million shares of downside volume on two occasions in one week. Strategists are split as well. Morningstar called breadth “extremely poor”, yet found the seven mega caps account for the entire undervaluation in its broad-market estimate, while Stifel notes the S&P 500 P/E sits about 19% above its 10-year average, with equal-weight valuations more reasonable.
What would count as distribution
- Nasdaq net volume turning down
- Upside volume stuck near 52% on rally days
- The RSP/SPY ratio failing again to make a higher high
What would count as broadening
- Positive NYSE volume on down S&P days
- Falling new-low counts
- Sustained RSP/SPY improvement that produces a higher high
Why is the Russell 2000 the chart Meisler calls key, and what do sentiment readings add?
If broadening is real, small caps should show it first. That is why Meisler singles out one chart.
The Russell trendline
Picture a steady three-month grind lower since August, with no single crash. The Russell 2000 is now trying to reclaim its short-term moving average and its 50-day average while pressing against that August downtrend line. A decisive break above it would be a significant trend change in her framework.
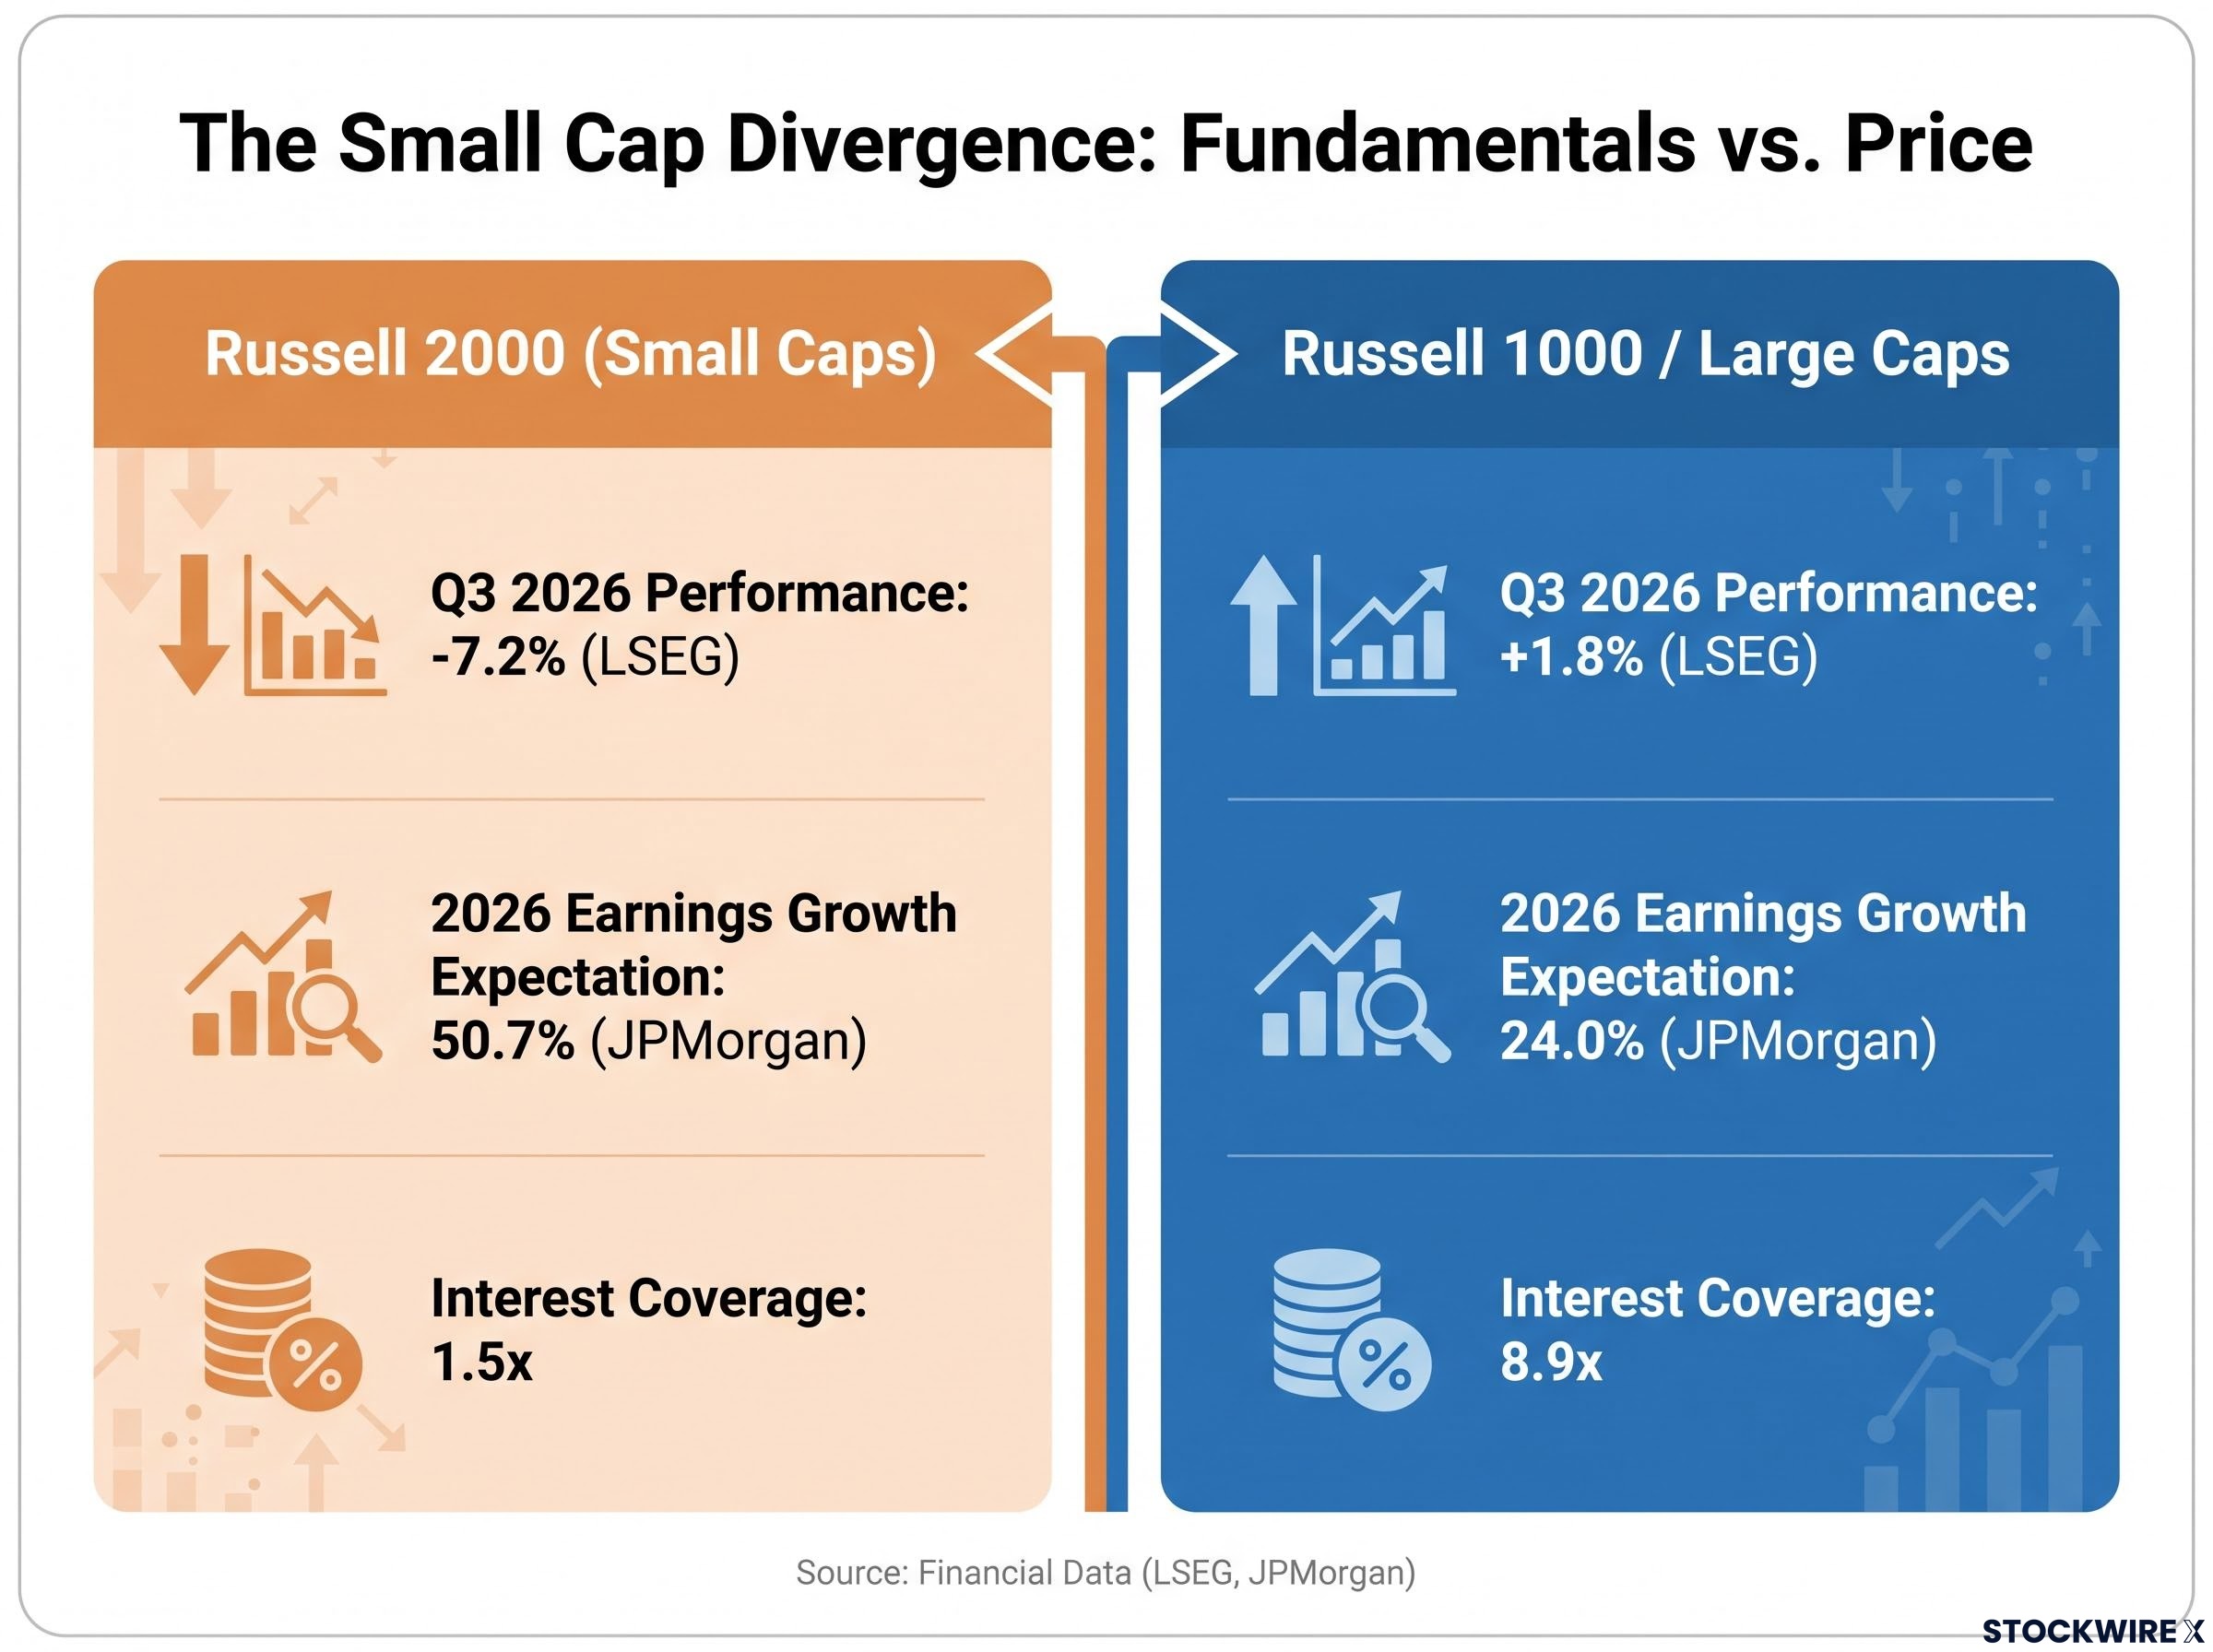
The damage was real. According to LSEG, the Russell 2000 fell 7.2% in Q3 2026 while the Russell 1000 gained 1.8%, though small caps were still up 13.7% for the year as of 30 September.
There is an early positive divergence too. NYSE new lows fell from 447 on 28 September to 394 on 1 October and 268 on 8 October, even as the Russell made lower lows. Selling pressure may be narrowing, but this is a warning, not confirmation, and Meisler sets seasonality aside unless her indicators agree.
The fundamental debate pulls in different directions.
| View | Reasoning | Caveat |
|---|---|---|
| JPMorgan: constructive | Russell 2000 earnings growth expectations of 50.7% in 2026 vs 24.0% for large caps | Interest coverage of 1.5x vs 8.9x for large caps |
| ClearBridge: cautious | Earnings growth likely to decelerate; higher yields and borrowing costs weigh | Dispersion can create stock-picking opportunities |
| LSEG: technical deterioration | A 7.2% Q3 decline and lower lows | Damaged charts can improve quickly if rates fall |
Attractive earnings do not stop small caps trading poorly if yields rise. Keep the long-term story and the short-term signal in separate boxes.
Sentiment: churn versus a clean-out low
Meisler’s logic is that oversold conditions without real fear give rallies a short runway. Lows that clear out sellers, like the one in March, combine oversold readings with plenty of bears. Here is where the gauges sit:
- Investors Intelligence: bulls 45%, correction camp 38%. Fear has moved into “correction”, not “bear”, which often brings chop.
- Daily Sentiment Index for VIX: rose from 15 to 27, then 21. Meisler wants readings above 30-40.
- AAII (week ending 21 October): bulls 36.9%, bears 45.8%, a spread of -8.9 points. Defensive, but not capitulation.
- Put/call: Cboe VIX put/call 0.59; equity put/call 10-day average 0.86 (not independently confirmed). Modest hedging rather than panic.
Bearish surveys are not automatically bullish. What matters is whether worried investors are bracing for a dip or genuinely bearish, and right now it is mostly the former. With VIX around 17-18 by Meisler’s count, that leaves an uncomfortable setup if QQQ breaks lower.
The levels Meisler is watching this week, and how to read the outcomes
The earlier concepts now turn into a checklist. Three levels matter:
- Russell 2000 downtrend line: a decisive break would be the clearest sign of broadening.
- SOX at 12,500: Meisler says the semiconductor index has been struggling near 11,500, so clearing 12,500 would show renewed chip leadership.
- QQQ at 700: the downside marker where a break could turn disorderly.
The panic scenario Meisler warns that a break below roughly 700 on QQQ could trigger fast panic, because many stocks are already down, VIX is elevated and bulls sit at 45%.
Clearing both upside levels would change the evidence. Failing both would suggest the oversold condition was used up through more churn, short covering and drift.
These levels sit inside a busy calendar.
| Event | Date | What to know |
|---|---|---|
| FOMC meeting | 27-28 October | About 90% implied probability of no change; range 3.75%-4.00% |
| Microsoft and Alphabet earnings | After close, 28 October | Alphabet options implied roughly a 6% move (not confirmed) |
| Amazon earnings | After close, 29 October | Company guidance of $197-$202B revenue |
| US midterms | 3 November | All 435 House seats and 35 of 100 Senate seats |
The Fed decision and the first two earnings reports are already behind you, so check those outcomes before applying the levels. Meisler also believes consensus expects everything to be fine after the midterms, and her data show Nasdaq becoming overbought around the election.
Earnings, the Fed’s path and the semiconductor cycle can overwhelm any technical read. Latest SOX, QQQ and VIX levels were not independently verified; Meisler’s figures come from her interview.
Semiconductor cycle timing is a separate debate from breadth, with Truist arguing chip stocks have typically peaked about a quarter after revenue growth peaks, which frames how much weight the SOX level deserves.
A durable turn needs several gauges to agree:
- A higher high in RSP/SPY
- Positive net volume
- A rising A-D line
- Fewer new lows
- Renewed Russell and SOX leadership
Treat the three levels as decision markers, not forecasts. A confirmed move across them changes the evidence. Anything less, including one or two good weeks, leaves the churn thesis intact.
These statements are speculative and subject to change based on market developments. Past performance does not guarantee future results.
What the breadth signals settle, and what they leave open
Each tool does a different job. Breadth and net volume show how fragile the trend is, sentiment shows how much runway a rally has, and the levels mark the point where the evidence shifts.
Right now, both stories have support. Weak Nasdaq volume and heavy concentration point towards distribution, while falling new lows and October’s equal-weight strength hint at rotation.
Only broad, sustained confirmation settles it. Once the earnings, the Fed outcome and the election results are in, check the RSP/SPY ratio for a higher high, the Russell against its trendline, SOX against 12,500 and QQQ against 700.
This article is for informational purposes only and should not be considered financial advice. Investors should conduct their own research and consult with financial professionals before making investment decisions.