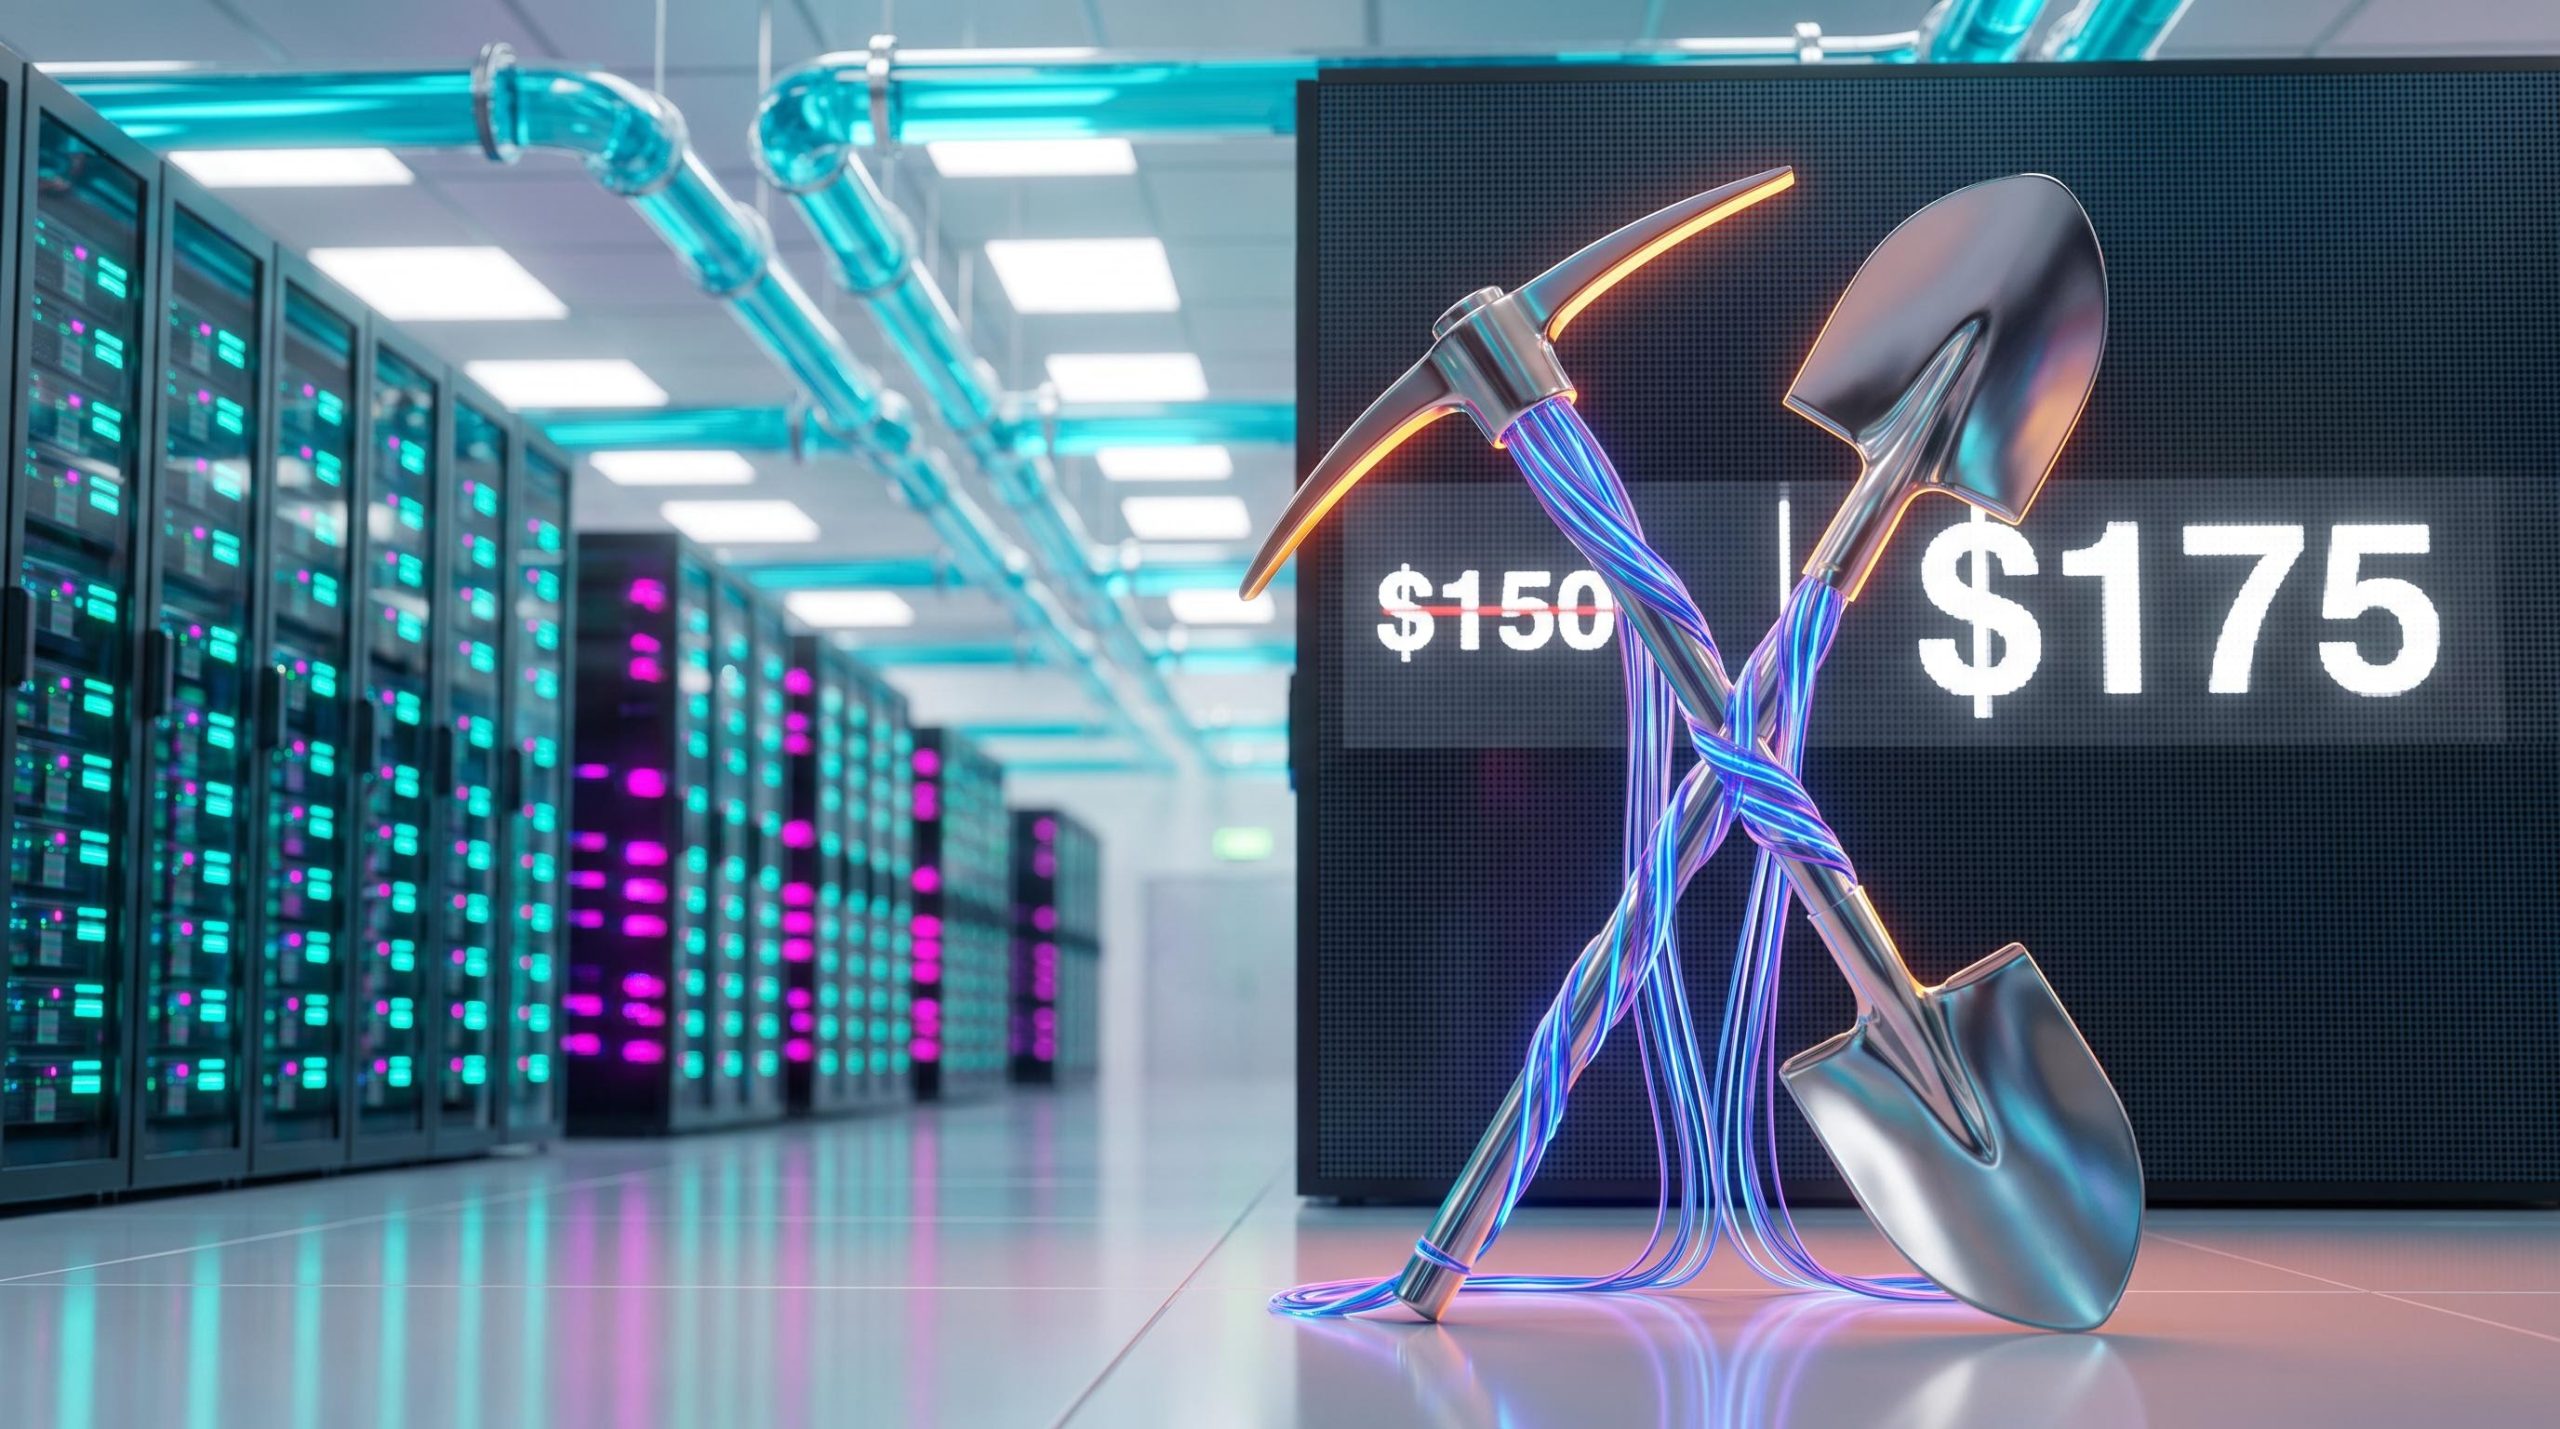
Arista Networks just posted the first $3 billion quarter in its history, with revenue up 37.7% year on year. Yet one analyst who modelled the company put its middle-case value at about $150, below the $175 share price he was working from.
That gap sits at the centre of the debate over AI infrastructure stocks. Arista builds the networks that link AI chips together. KLA Corporation makes the inspection systems that catch defects in advanced chips. Eaton supplies the power equipment and liquid cooling that AI data centres need to run.
All three are strong businesses with real demand behind them. The problem you keep meeting when you research them is that “is this a great company?” and “is this a good price?” are separate questions, and the answers often differ.
Here is a method for testing what growth, margins and exit multiples a share price requires, followed by a side-by-side read on three real examples. This is educational material, not a recommendation to buy or sell.
Why can a great AI supplier still be a poor investment?
The appeal is simple. During a gold rush, the people selling picks and shovels get paid regardless of which miner strikes gold. Arista, KLA and Eaton sell the picks and shovels of AI, so owning them seems like the safe way in.
Cisco’s history complicates that belief. Cisco was the networking supplier of the internet build-out, and the business delivered.
The Cisco contrast Revenue grew from about $2 billion in 1995 to nearly $19 billion in fiscal 2000. Shares then fell roughly 83-88% from their March 2000 peak, depending on the measurement period.
The business did not collapse. According to Harding Loevner, Cisco’s revenue was about $19 billion in 2000, about $22 billion in 2001 and about $19 billion in 2002. What collapsed was the price investors would pay for those sales, along with expectations for future growth.
Cisco’s fiscal 2002 annual report confirms the revenue path directly: about $18.9 billion in fiscal 2000, $22.3 billion in 2001 and $18.9 billion in 2002, so the business held up while the share price did not.
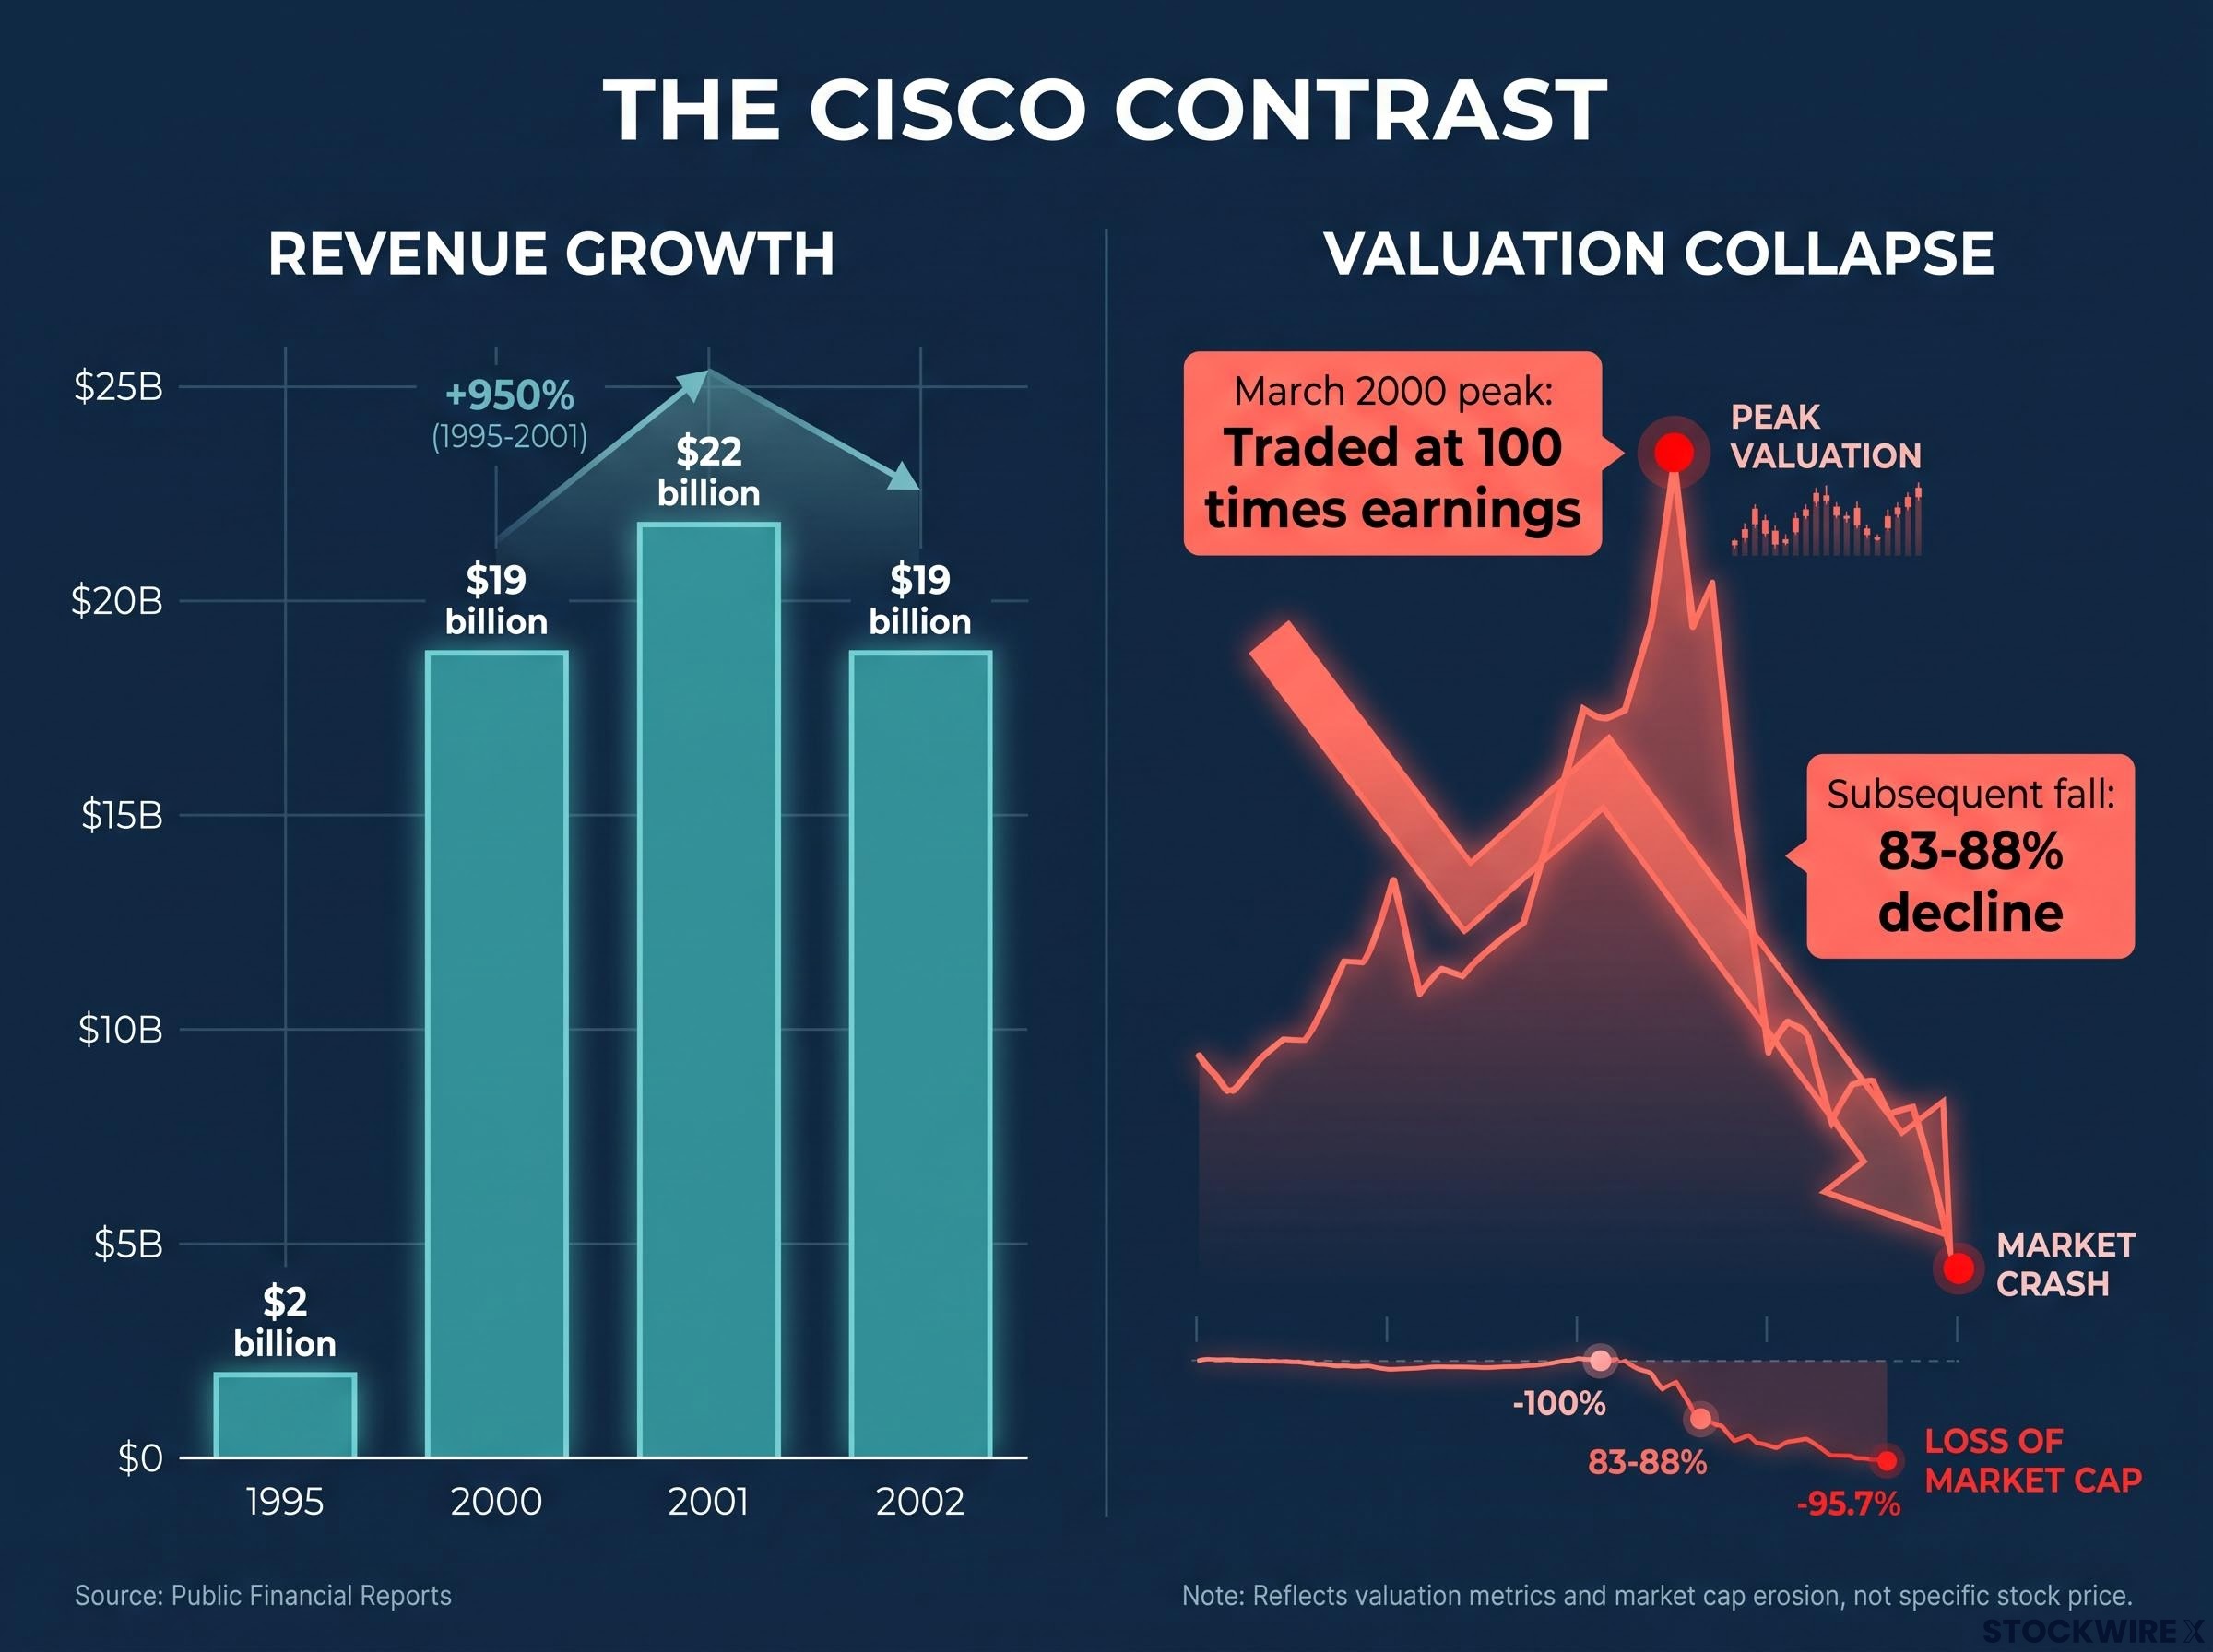
If you bought near the peak at roughly 100 times earnings, you then sat through a decline of 80-88% and waited about two decades or more to get back to even.
Semiconductor equipment tells a similar story. Applied Materials traded at about 15.2 times sales in 2000 and 9.6 times in 2004 before settling much lower, even as demand for its tools kept rising.
None of this means Arista is Cisco. It means every stock debate has three layers, and you need to separate them:
- Structural: is long-term demand for the product growing?
- Cyclical: where are customers in their spending cycle right now?
- Valuation: how much future growth is already built into the price?
The price you pay decides how much of a company’s growth already belongs to the seller. Before you judge the business, you need to know how many years of exceptional growth the current price assumes.
When big ASX news breaks, our subscribers know first
How do growth, margins and exit multiples drive a fair value estimate?
Answering that question means looking inside a valuation model. The good news is that most models come down to a few moving parts.
The three levers
Revenue growth is how fast sales rise each year. Margin is the share of each dollar of sales that turns into profit. The exit multiple is the price-to-earnings or price-to-cash-flow ratio you assume the market will pay for the company at the end of your forecast period.
Add a fourth input: your desired return, the yearly gain you need to justify the risk. The analyst whose work this article draws on used 9.5%.
Small changes compound quickly. If you model 30% growth for five years instead of 20%, your earnings in year five come out dramatically higher, and so does the value. Then multiply those earnings by an exit multiple of 25 instead of 15, and the gap widens again.
Intrinsic value estimation rests on discounted future cash flows, and your terminal value assumption alone often drives most of the result, which is why the exit multiple deserves the hardest stress test in your model.
Working backwards from the price
A reverse discounted cash flow (DCF) flips the usual process. A standard DCF estimates future cash flows and converts them into a value today. A reverse DCF starts with today’s share price and asks what must happen for that price to make sense.
New York University professor Aswath Damodaran describes a DCF as a story told in numbers. A reverse DCF makes you write that story out in full. Here is a six-step version you could try this week:
- Hold the current share price fixed.
- Use normalised margins (a typical level across a cycle), not peak margins.
- Solve for the revenue and free cash flow growth the price requires.
- Compare that growth against the size of the market and how dependent the company is on a few customers.
- Test lower exit multiples and higher discount rates (the return you demand).
- Separate lasting growth from a one-time burst of AI spending.
Damodaran also favours scenarios over single estimates, because variables move together. Weak demand usually squeezes margins and multiples at the same time.
| Scenario | Revenue growth | Margins | Valuation implication |
|---|---|---|---|
| Bull | AI demand stays unusually strong | Expand or hold near recent highs | High current multiple can be justified |
| Base | Structural growth continues but normalises | Healthy, partly reverting toward history | Returns depend heavily on entry price |
| Bear | Spending pauses, export controls, project delays | Compress toward mid-cycle | Earnings and multiple both fall |
If a model only looks attractive because of a high long-term growth rate, a low discount rate or a peak-level exit multiple, treat the result as a mirror of those assumptions. It tells you nothing new about the company.
Arista, KLA and Eaton: three businesses, three very different valuation puzzles
Apply that framework to the three companies and a pattern appears. The quality is real in each case. The tension sits somewhere different each time.
| Metric | Arista (Q2 2026) | KLA (Q4 FY2026) | Eaton (Q2 2026) |
|---|---|---|---|
| Revenue / growth | $3.036B / +37.7% | $3.66B / +15% | $8.5B / +21% (+14% organic) |
| Margin | 49.9% non-GAAP operating | 43.7% non-GAAP operating | 23.1% segment |
| Return on capital | About 25-29% | About 40% | Low, per source |
| Balance sheet | Net cash | Debt easily covered | $36B debt vs $3.6B free cash flow |
Arista: quality priced as a likely winner
Arista sells high-speed Ethernet switches and the software that runs them, which customers find hard to replace. The bull case is that Ethernet wins share in AI networks as big cloud companies (hyperscalers) seek an alternative to Nvidia’s InfiniBand. The bear case is that Nvidia’s own networking, cheaper white-box hardware and custom chips all chase the same spending.
Concentration adds risk: Microsoft and Meta made up 26% and 16% of 2025 sales, according to the source. At $175, the stock traded at 43 times free cash flow and 55 times earnings. By September 2026, Moat Explorer data showed about $202 and roughly 65 times trailing earnings.
KLA: strong franchise, cyclical earnings
KLA profits whichever chipmaker wins, because more complex chips need more inspection steps per wafer. But equipment spending runs in cycles, and commentary puts the stock near 30 times forward earnings against a five-year average of about 21 times. KLA’s year ends in June, so multiples from June 2026 are distorted by the transition.
China exposure also shifts by period: about 26% in one recent quarter versus about 33% in FY2025. Compare like periods only.
Eaton: real demand, heavy balance sheet
Eaton’s backlog (signed orders not yet delivered) rose 44% by March 2026, and its $9.5 billion Boyd Thermal deal, priced at 22.5 times estimated 2026 EBITDA (earnings before interest, tax, depreciation and amortisation), adds liquid cooling. Eaton discloses no consolidated AI revenue, so these are operating signals, not AI sales.
| Company | Low | Middle | High | Key assumption |
|---|---|---|---|---|
| Arista | $65-70 | About $150 | $300-330 | 17% growth vs 27% historical, 20x multiple |
| KLA | $50 | About $100 | $180-190 | Margins revert to average |
| Eaton | $125 | $180 | $269 | 13-19x free cash flow |
All three use a 9.5% desired return. Strong quality scores sit beside middle cases at or below the market, which shows you that “fully valued” describes the gap between price and assumptions, not a weak business.
What could make these valuations wrong in either direction?
Those middle cases rest on one presenter’s conservative inputs, so they deserve the same scrutiny as any bullish story. Five shared risks could push results lower:
- AI spending digestion: buyers pause after a rapid build-out.
- Hyperscaler concentration: a few giants can negotiate hard or build their own.
- Nvidia disintermediation: Nvidia captures more networking value.
- Export controls: China restrictions cut addressable demand.
- Semiconductor cycles: fab spending cuts swamp structural gains for quarters.
The data has caveats too. Estimates differ by fiscal year and vendor, and backlog is not revenue until projects are delivered.
| Company | Current year | Later year | Growth implied |
|---|---|---|---|
| Arista | 2026: $12.68B, EPS $4.12 | 2028: $20.7B, EPS $6.50 | Revenue up about 63% in two years |
| KLA | FY2027: $18.14B, EPS $5.43 | FY2028: $21.57B, EPS $6.63 | EPS up about 22% in one year |
| Eaton | EPS $13.50 | EPS $24 (four years out) | Profit up about 78% |
Eaton’s own FY2026 guidance calls for adjusted EPS of $13.40-$13.60 and organic growth of 11-13%. The presenter judged the jump to $24 inconsistent with Eaton’s 12-13% profit margins and slowing growth.
Narrative plus numbers Damodaran’s view is that value comes from a story about the business and the numbers that express it. Change the story, and the numbers must change with it.
The upside case matters just as much. If growth stays well above the middle-case assumptions, the high scenarios stop being fantasy and start becoming relevant.
Analyst forecasts already contain the growth assumptions your valuation depends on. Read consensus as an input to test, not as proof the price is right.
Data centre demand forecasts are already steep, with Citi projecting 370 GW of IT load by 2031, yet the same analysis flags overbuild warnings, which is why consensus belongs in your model as an input to test.
Past performance does not guarantee future results. Financial projections are subject to market conditions and various risk factors, and these scenarios are speculative and subject to change.
What the three valuations teach, and what they leave open
Quality, balance sheet and price are three separate tests. Arista passes on quality and balance sheet but is priced as a likely winner. KLA passes the first two but may carry a growth multiple on cyclical earnings. Eaton has real demand but carries heavy debt and modest returns.
A margin of safety calibrated to business quality asks for a bigger discount on cyclical or leveraged firms than on predictable high-moat ones, which is a useful lens when comparing KLA with Eaton.
Before you judge any of these names, write down the growth, margin and exit multiple the current price needs, then ask whether that outcome is plausible. The scenarios here are illustrations from one presenter’s assumptions, not price targets.
Watch Arista’s hyperscaler order timing, KLA’s fab-equipment spending and China exposure, and Eaton’s Boyd integration and debt reduction. Those are the variables most likely to move each story.
This article is for informational purposes only and should not be considered financial advice. Investors should conduct their own research and consult with financial professionals before making investment decisions.