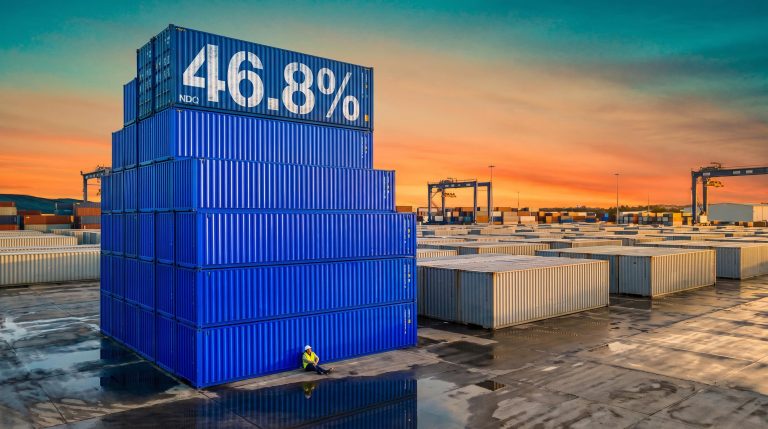
Nick Scali’s Australian and New Zealand written orders fell 15% in the September quarter. Temple & Webster revenue is down 8% this financial year. Yet bank transaction data show household spending still growing at 6.8% to 7.7% a year, and that gap is the clearest sign of a K-shaped consumer in Australia.
A K-shaped economy is one where different groups move in opposite directions at the same time, like the two arms of the letter K. Investors who treat “the consumer” as a single group can misread both the weak retail results and the strong spending figures.
The timing matters. The Reserve Bank of Australia (RBA) lifted the cash rate to 4.60% on 29 September 2026. Reports indicate that the September quarter Consumer Price Index (CPI), released today, came in hotter than expected, although that reading has not been independently confirmed.
If you read spending data and share prices separately, you risk buying a falling retailer too early or selling a resilient one too late. Here is a method for reading the two together, and a view on where pessimism may already be in the price.
Where is the Australian consumer actually splitting?
The headline numbers suggest a consumer in reasonable health. The split shows up when you cut the data by mortgage status and then by age.
Mortgage status
The original analysis behind this story found per-capita spending growth of about 5% for households without a mortgage, against 2.8% for mortgage holders. A year ago the pattern ran the other way, with mortgage holders leading.
CommBank’s Household Spending Insights (HSI) commentary from July 2026 points the same way. Households with mortgages, especially in the age groups most likely to carry one, are spending more cautiously as interest costs rise.
Australia’s variable-rate mortgage structure helps explain why rate rises reach household budgets within days, whereas many US borrowers hold fixed loans below 4%. That transmission speed is why mortgage holders here are cutting back first.
Age
The age data sharpen the picture.
| Age group | Annual spending growth |
|---|---|
| 65+ | 10.1% |
| 55-64 | 6.2% |
| 18-24 | 5.4% |
| 35-44 | 4.5% |
| 45-54 | 4.5% |
| 25-34 | 4.2% |
Source: CommBank HSI, 12 months to June 2026.
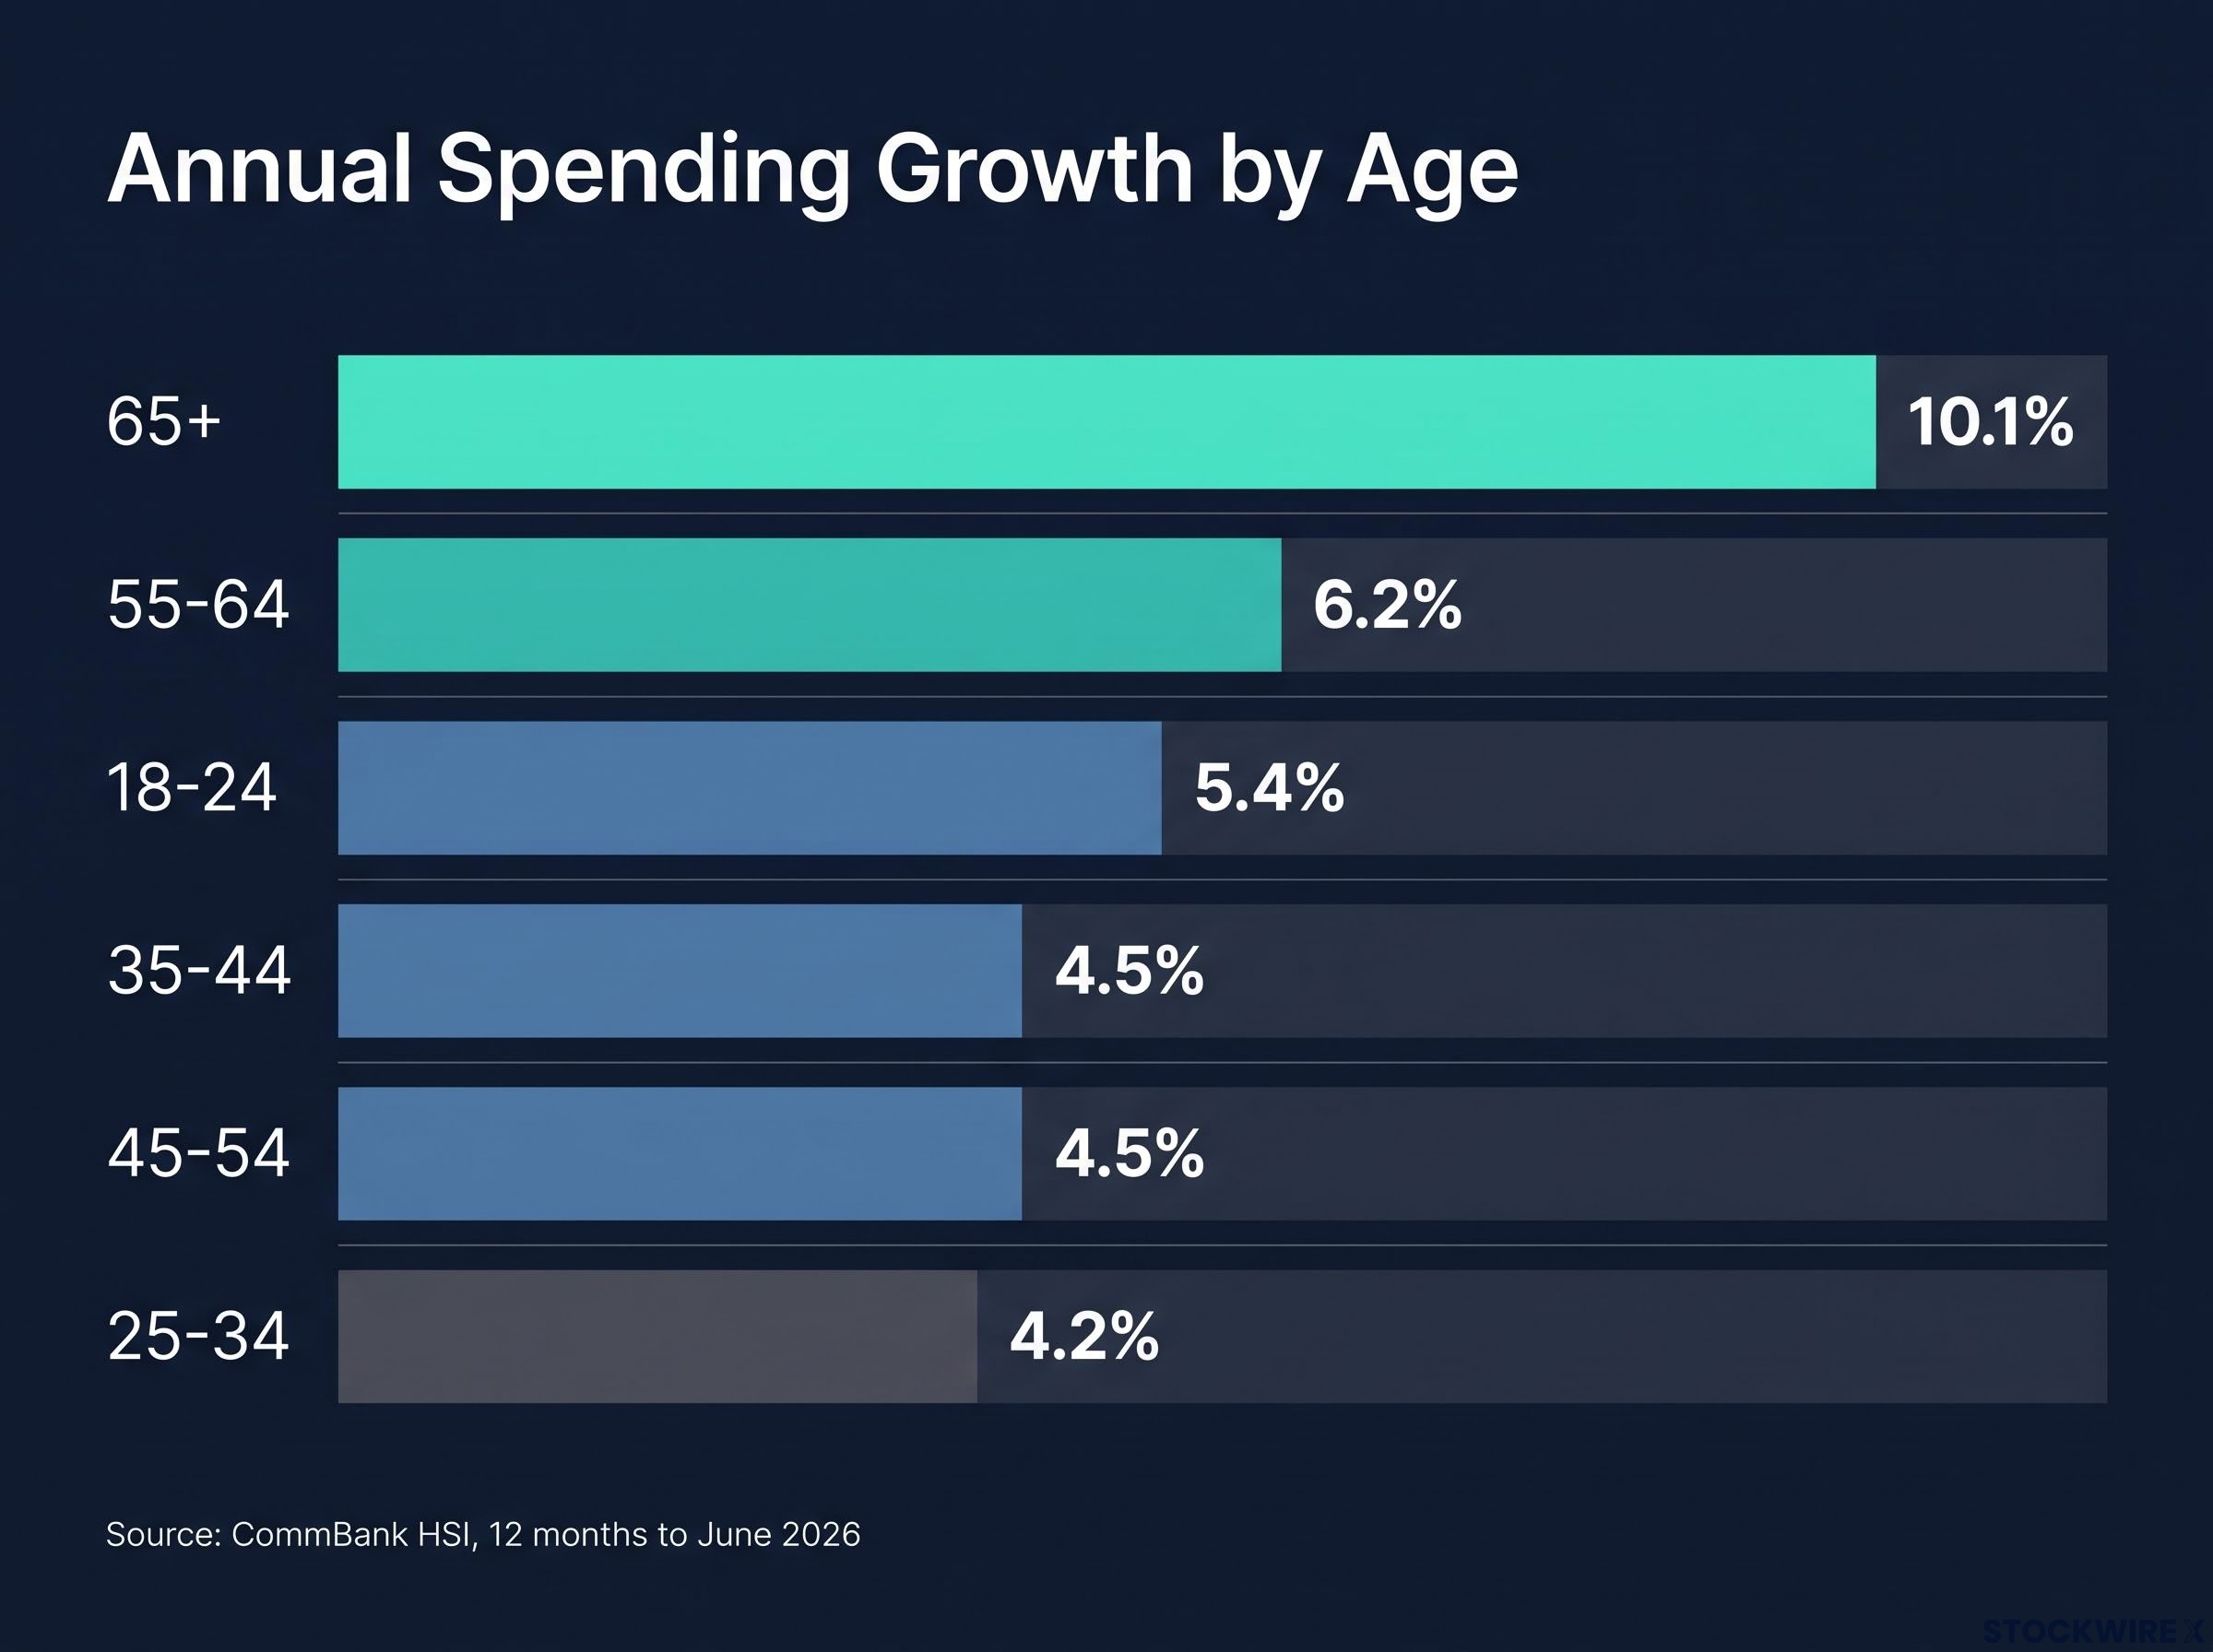
The age gap in one line Australians aged 65 and over lifted spending by 10.1%, more than double the 4.2% recorded by 25-34 year olds.
The original source puts the 55-64 group at 5.7% rather than 6.2%. The two sources differ on the level but agree on the direction: asset-rich 55-64 year olds are outspending the mortgage-heavy 45-54 cohort.
That makes this a rate-exposure and wealth story more than a rich-versus-poor one. Economists offer three overlapping explanations: mortgage stress after the move to 4.60%, wealth effects from property and shares held by older households, and lower rate exposure among renters and outright owners. No public NAB or ANZ breakdown by mortgage status exists, so CommBank remains the main evidence.
For you, the lesson is that national spending growth hides who is doing the spending. A retailer whose customers skew older and mortgage-free sits on a very different arm of the K from one serving young families with large home loans.
When big ASX news breaks, our subscribers know first
Why is spending moving from household goods to experiences?
Knowing who spends is the first lens. The second is what they spend on, and the monthly data show money drifting away from the home.
NAB’s July 2026 data showed personal goods up 2.0% month-on-month (10.5% year-on-year), hotels, travel and transport up 1.9%, and cafés and restaurants up 1.1%. Household goods rose just 0.4% after a 3.7% jump in June. By August, household goods were flat at 0.1% month-on-month, though still 6.5% higher than a year earlier.
The more useful question is why, because some drivers can reverse and others probably will not.
Cyclical drivers
- Higher repayments make households delay furniture, appliances and other large items.
- Many families brought these purchases forward during the pandemic and housing upgrade cycle, leaving a tough comparison base.
- Furniture is postponable and tied to moving or renovating, so it slows when housing turnover slows.
- Cost-of-living pressure pushes people to trade down on goods while keeping selected social spending.
Part of the squeeze on household budgets comes from fuel and electricity costs, which surged earlier in 2026 and left less room for big-ticket purchases such as furniture and appliances.
Structural drivers
- Services became a larger share of household budgets after the pandemic.
- Dining, travel and fitness can be bought in small amounts and are harder to defer than a new sofa.
- Older households, now driving much of the growth, hold more wealth and favour travel and leisure.
Cyclical drivers could ease if rates fall. The structural shift toward services looks more durable either way.
Experiences are not immune, though. CommBank’s recreation spending slowed from 2.3% month-on-month in May to 0.2% in June.
Read the spike, then the trend Westpac recorded a 1.4% fall in recreation and culture spending in August, partly reversing months inflated by major sporting events. Furnishings and household equipment fell 0.6%.
Westpac also notes that price rises lift spending readings. Nominal spending counts dollars, not volumes, so a household paying more for the same meal looks like it is spending more. Treat one strong month in recreation as noise, and look for several months heading the same way before concluding that the shift is permanent.
What do Nick Scali, Temple & Webster, JB Hi-Fi and Woolworths tell you?
Cohort data become far more useful once you can see them in company results. Lined up by exposure, from postponable big-ticket items to everyday needs, the K-shape looks less like a slogan and more like a spectrum.
The weak end: furniture
Nick Scali’s trading update on 21 October 2026 showed ANZ written orders down 15%, against 11% growth a year earlier. Store traffic fell about 10%. The UK business moved the other way, with orders up 29%.
Management guided to underlying net profit after tax (NPAT) of $28-32 million for the half to December, with ANZ revenue expected 11-14% lower.
The AFR report on Nick Scali confirms written orders in Australia and New Zealand ran 15% below the prior corresponding period, alongside first-half FY27 profit guidance that points to a weaker furniture leg of the K.
Temple & Webster is the more nuanced case. Revenue for 1 July to 19 October fell 8%, but contribution-margin dollars (the profit left from each sale after direct costs such as delivery and marketing) rose 16%. The company cut promotional depth and lifted some prices, and it reaffirmed FY27 earnings before interest, tax, depreciation and amortisation (EBITDA) guidance of $33-40 million.
Harvey Norman has issued no formal Q1 update. Executive chairman Gerry Harvey has warned of falling store traffic, yet he bought about 463,000 shares for $1.9 million on 18 September.
The strong end: food and electronics
JB Hi-Fi reported record FY26 sales of $11.06 billion, according to unconfirmed reports, with early FY27 trading said to be softer. Electronics sits in the middle of the K: partly replacement spending, partly discretionary.
Woolworths grew group sales 4.7% to $19.4 billion in the 14 weeks to 4 October. Australian Food sales rose 6.9%, with comparable sales up 6.1%, helped by discounting. Coles reports on 30 October.
| Company | Latest update | Sales or orders signal | Margin or profit signal |
|---|---|---|---|
| Nick Scali | 21 Oct 2026 | ANZ orders -15%, traffic about -10% | H1 NPAT guidance $28-32M |
| Temple & Webster | 23 Oct 2026 | Revenue -8% | Contribution margin +16% |
| JB Hi-Fi | FY26 result | Record $11.06B sales (unverified); softer start to FY27 | Not confirmed |
| Woolworths | 14 weeks to 4 Oct 2026 | Group sales +4.7% | Discounting supported volumes |
Falling furniture orders and rising supermarket sales are two readings of the same consumer. Neither tells you whether a share price is cheap, so check orders, traffic and margin together in any trading update.
Is the pessimism already priced in?
The operating evidence is clear. The share prices show how much of it the market has already absorbed.
| Stock | Year-to-date move | Forward P/E (as reported) | Key risk |
|---|---|---|---|
| Woolworths | Up 33.1% at $38.22 (7 Oct); higher in earlier source data | 28x | Premium leaves little room for disappointment |
| JB Hi-Fi | Down 21.5-24.8% (down 23.5% at $70.36 on 7 Oct) | 16.5x | Softer trading into FY27 |
| Harvey Norman | No reliable dated figure | 11.6x | Housing and big-ticket exposure |
Year-to-date figures from Motley Fool Australia and the original source. Forward price-to-earnings (P/E) ratios, which compare a share price with expected earnings, come from the original source and have not been independently verified.
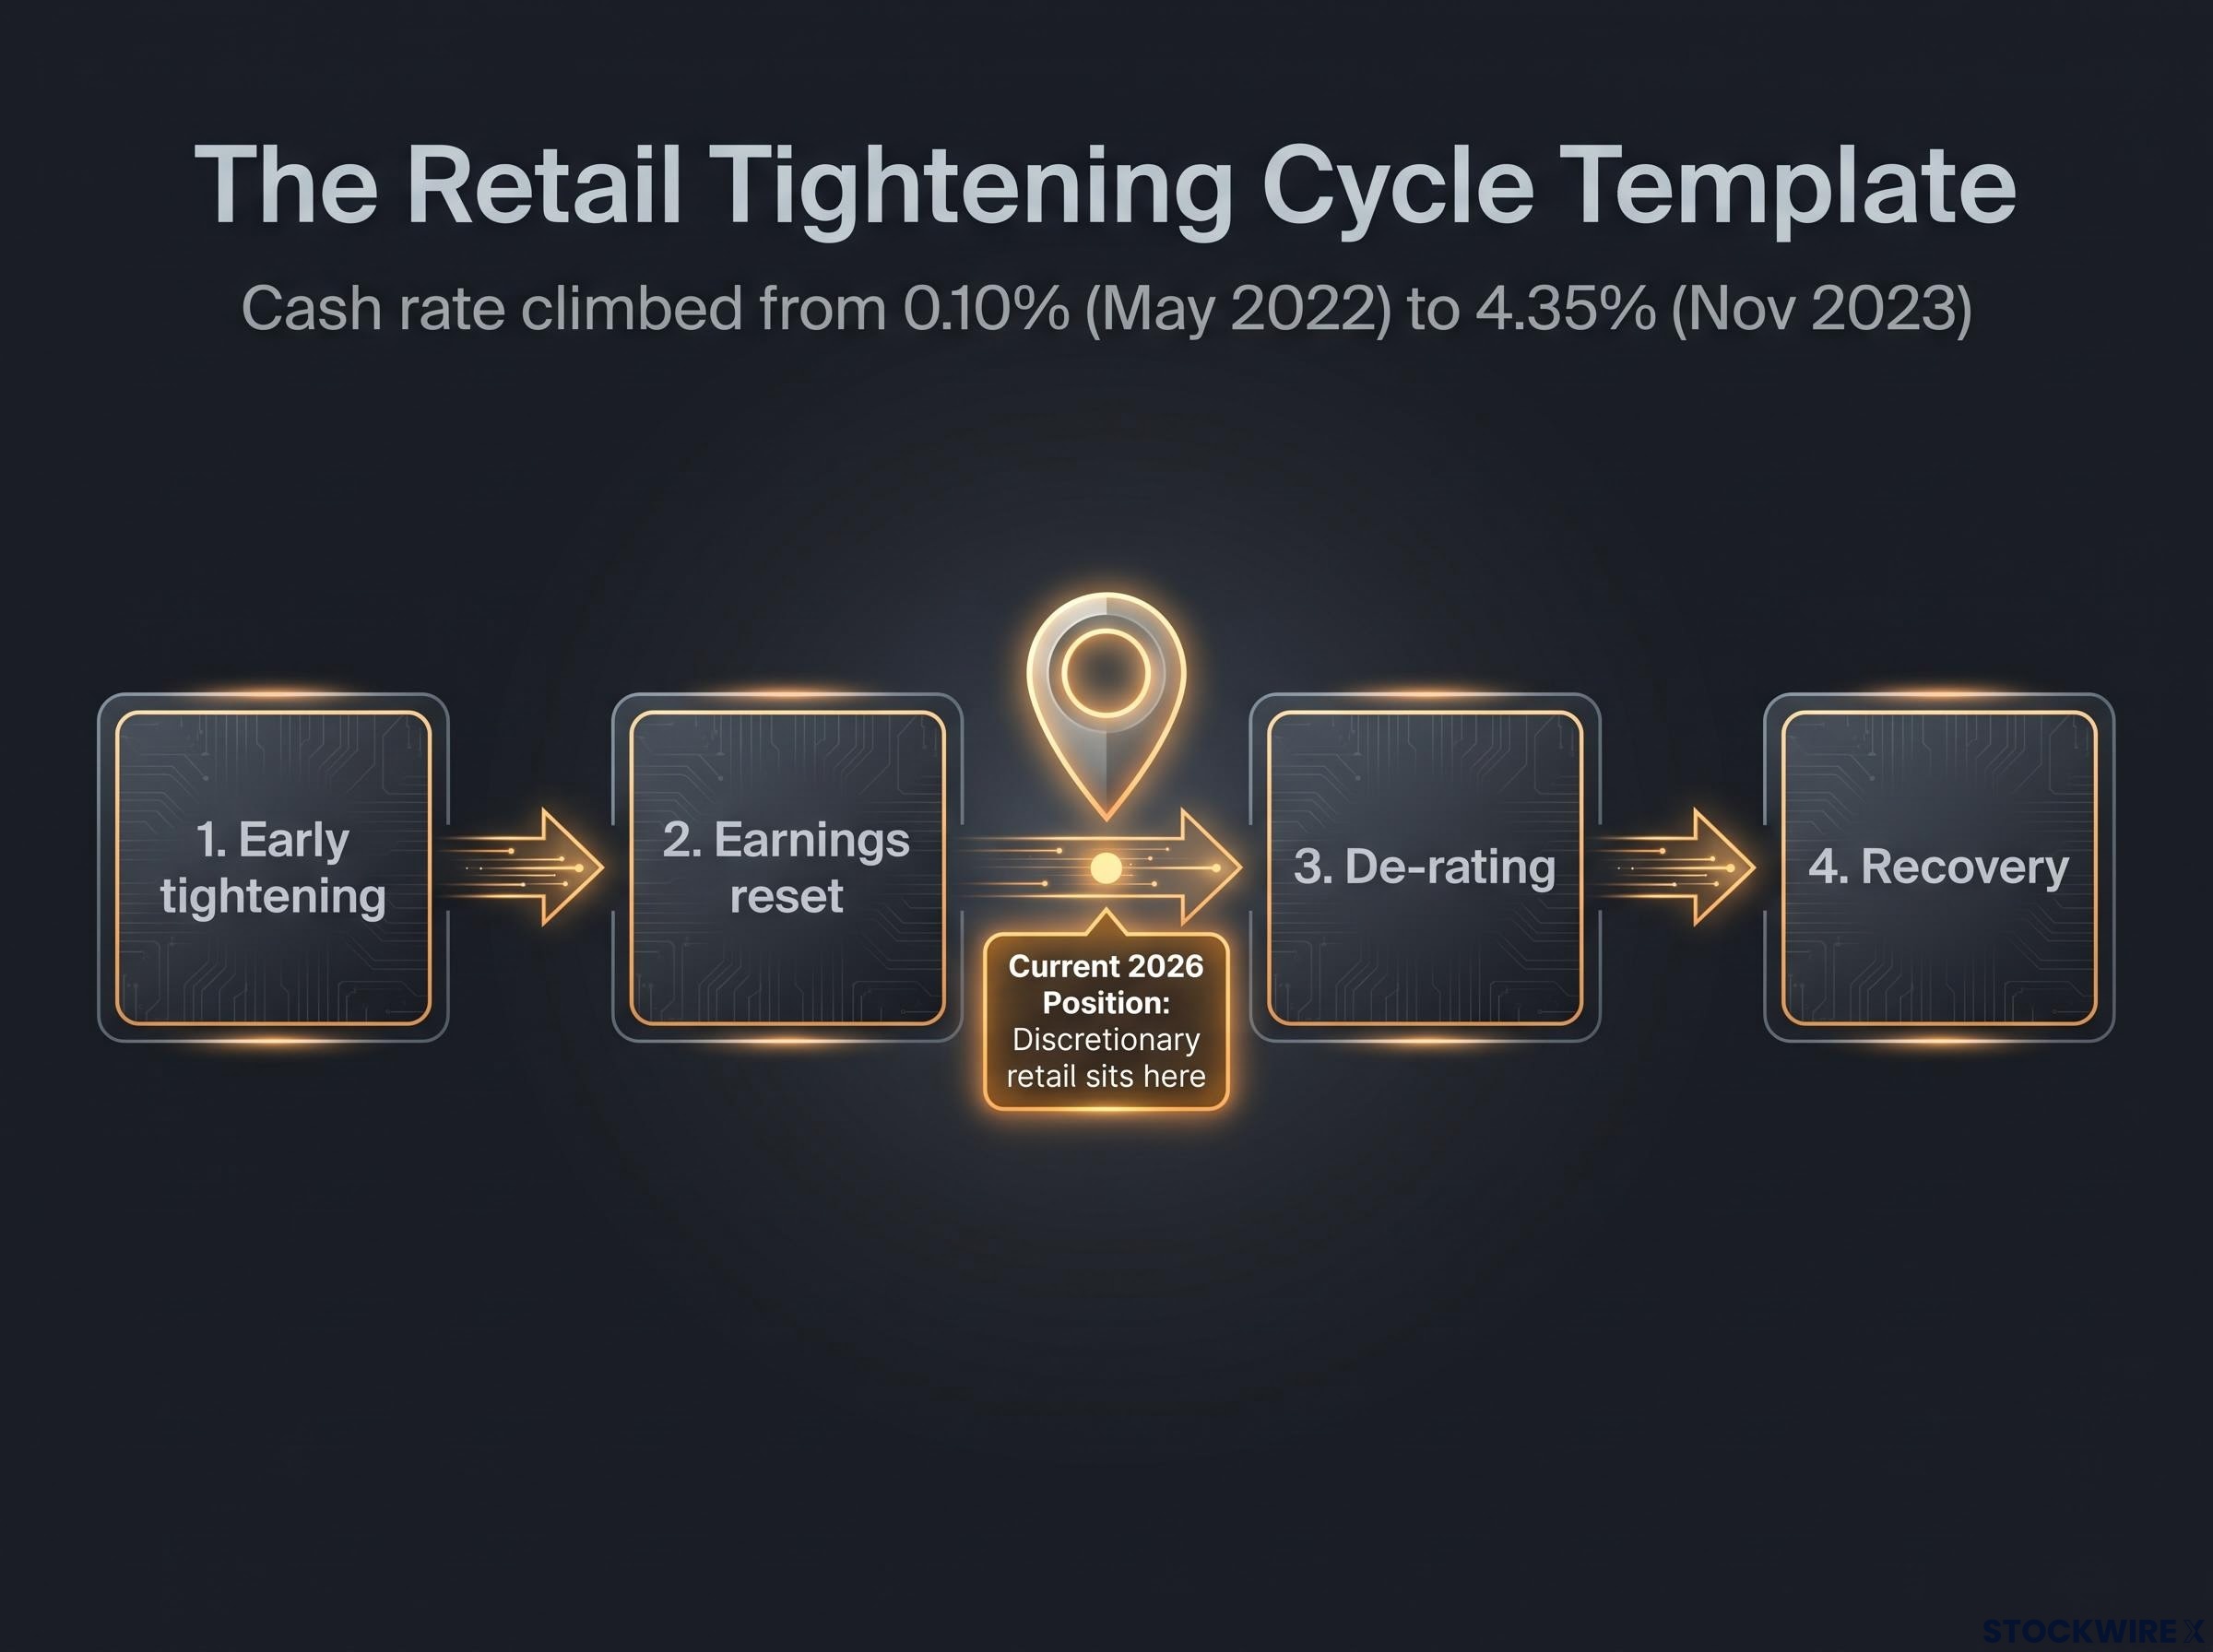
The 2022-24 tightening cycle, when the cash rate climbed from 0.10% in May 2022 to 4.35% by November 2023, offers a rough template:
- Early tightening: consumer data weaken, but shares hold up on hopes of a short slowdown.
- Earnings reset: retailers reveal weaker orders, traffic and margins, and forecasts fall.
- De-rating: high-multiple discretionary stocks drop sharply, often before the weakest data.
- Recovery: valuations rebound before sales do, provided rates peak.
In 2026, with the RBA cutting in 2025 before resuming hikes, discretionary retail appears to sit between stages two and three.
Weak orders have weighed on ASX consumer discretionary stocks for years, with the sector returning just 0.62% annualised over five years against 4.07% for the ASX 200, a gap that shows how long rate-driven pressure can persist.
The case that bad news is priced in
Morningstar said on 3 September 2026 that discretionary stocks were “mostly cheap” while Woolworths looked expensive. Temple & Webster’s margin gains and JB Hi-Fi’s record year suggest some businesses are more resilient than their share prices imply.
The case for more downside
Nick Scali shows how quickly orders can deteriorate. The RBA has said it could raise rates further, and a hotter CPI print would increase pressure on mortgage-heavy households.
The data carry caveats too. Card data reflect each bank’s customer mix, nominal spending flatters volumes, categories swing on events, and retail earnings lag the orders behind them. Rate risk also cuts both ways, because eventual cuts could spark a sharp recovery in housing-linked spending.
A low multiple only signals value if earnings stop falling. Pair spending data with orders, traffic and rate direction before you decide anything is cheap.
Past performance does not guarantee future results. Valuations and forecasts are subject to market conditions and may change.
What the split changes, and what it does not
The Australian consumer is clearly divided by age and mortgage exposure. The “experiences” leg is weaker than it looks, however, once you strip out price rises and event-driven months.
Signals worth watching next:
- Coles’ sales result on 30 October
- The RBA’s response to the latest CPI print
- Written orders and store traffic in retailer updates
- The share of each retailer’s customers who are older or mortgage-free
The decision is not whether the consumer is weak. It is which leg of the K a company serves, and whether its earnings have stopped falling.
This article is for informational purposes only and should not be considered financial advice. Investors should conduct their own research and consult with financial professionals before making investment decisions.