The S&P 500 is trading within reach of its record high, but the typical stock in the index has spent much of the past four months falling. Morgan Stanley’s chief US equity strategist, Mike Wilson, argues that hidden correction is now in its final innings, and he has raised his Morgan Stanley S&P 500 target to back that view.
The timing makes his call harder to test. The Federal Open Market Committee (FOMC), the Federal Reserve body that sets interest rates, is meeting on 27-28 October. Alphabet and Microsoft report after the close on 28 October, and the midterm elections arrive on 3 November.
Wilson’s mid-2027 target now sits at 8,500, up from 8,300. That upgrade only matters if the rest of the evidence supports it.
Here is how his call holds up against breadth data and options pricing, so you can decide how much weight the number deserves.
What is Wilson actually arguing, and how far does the 8,500 target sit from here?
A record index and a correcting stock market sound like a contradiction. They are not. Wilson is not describing the S&P 500 itself; he is describing the average stock inside it.
According to CNBC coverage published on 20 October and updated on 26 October, Wilson says the typical US stock has been in a correction since June. He expects roughly two to three more weeks of weakness, followed by a solid finish to 2026 and a stronger 2027.
The “final innings” call Wilson describes the average stock’s correction as being in its “final innings,” with turbulence likely to persist through the Fed meeting and the midterm elections.
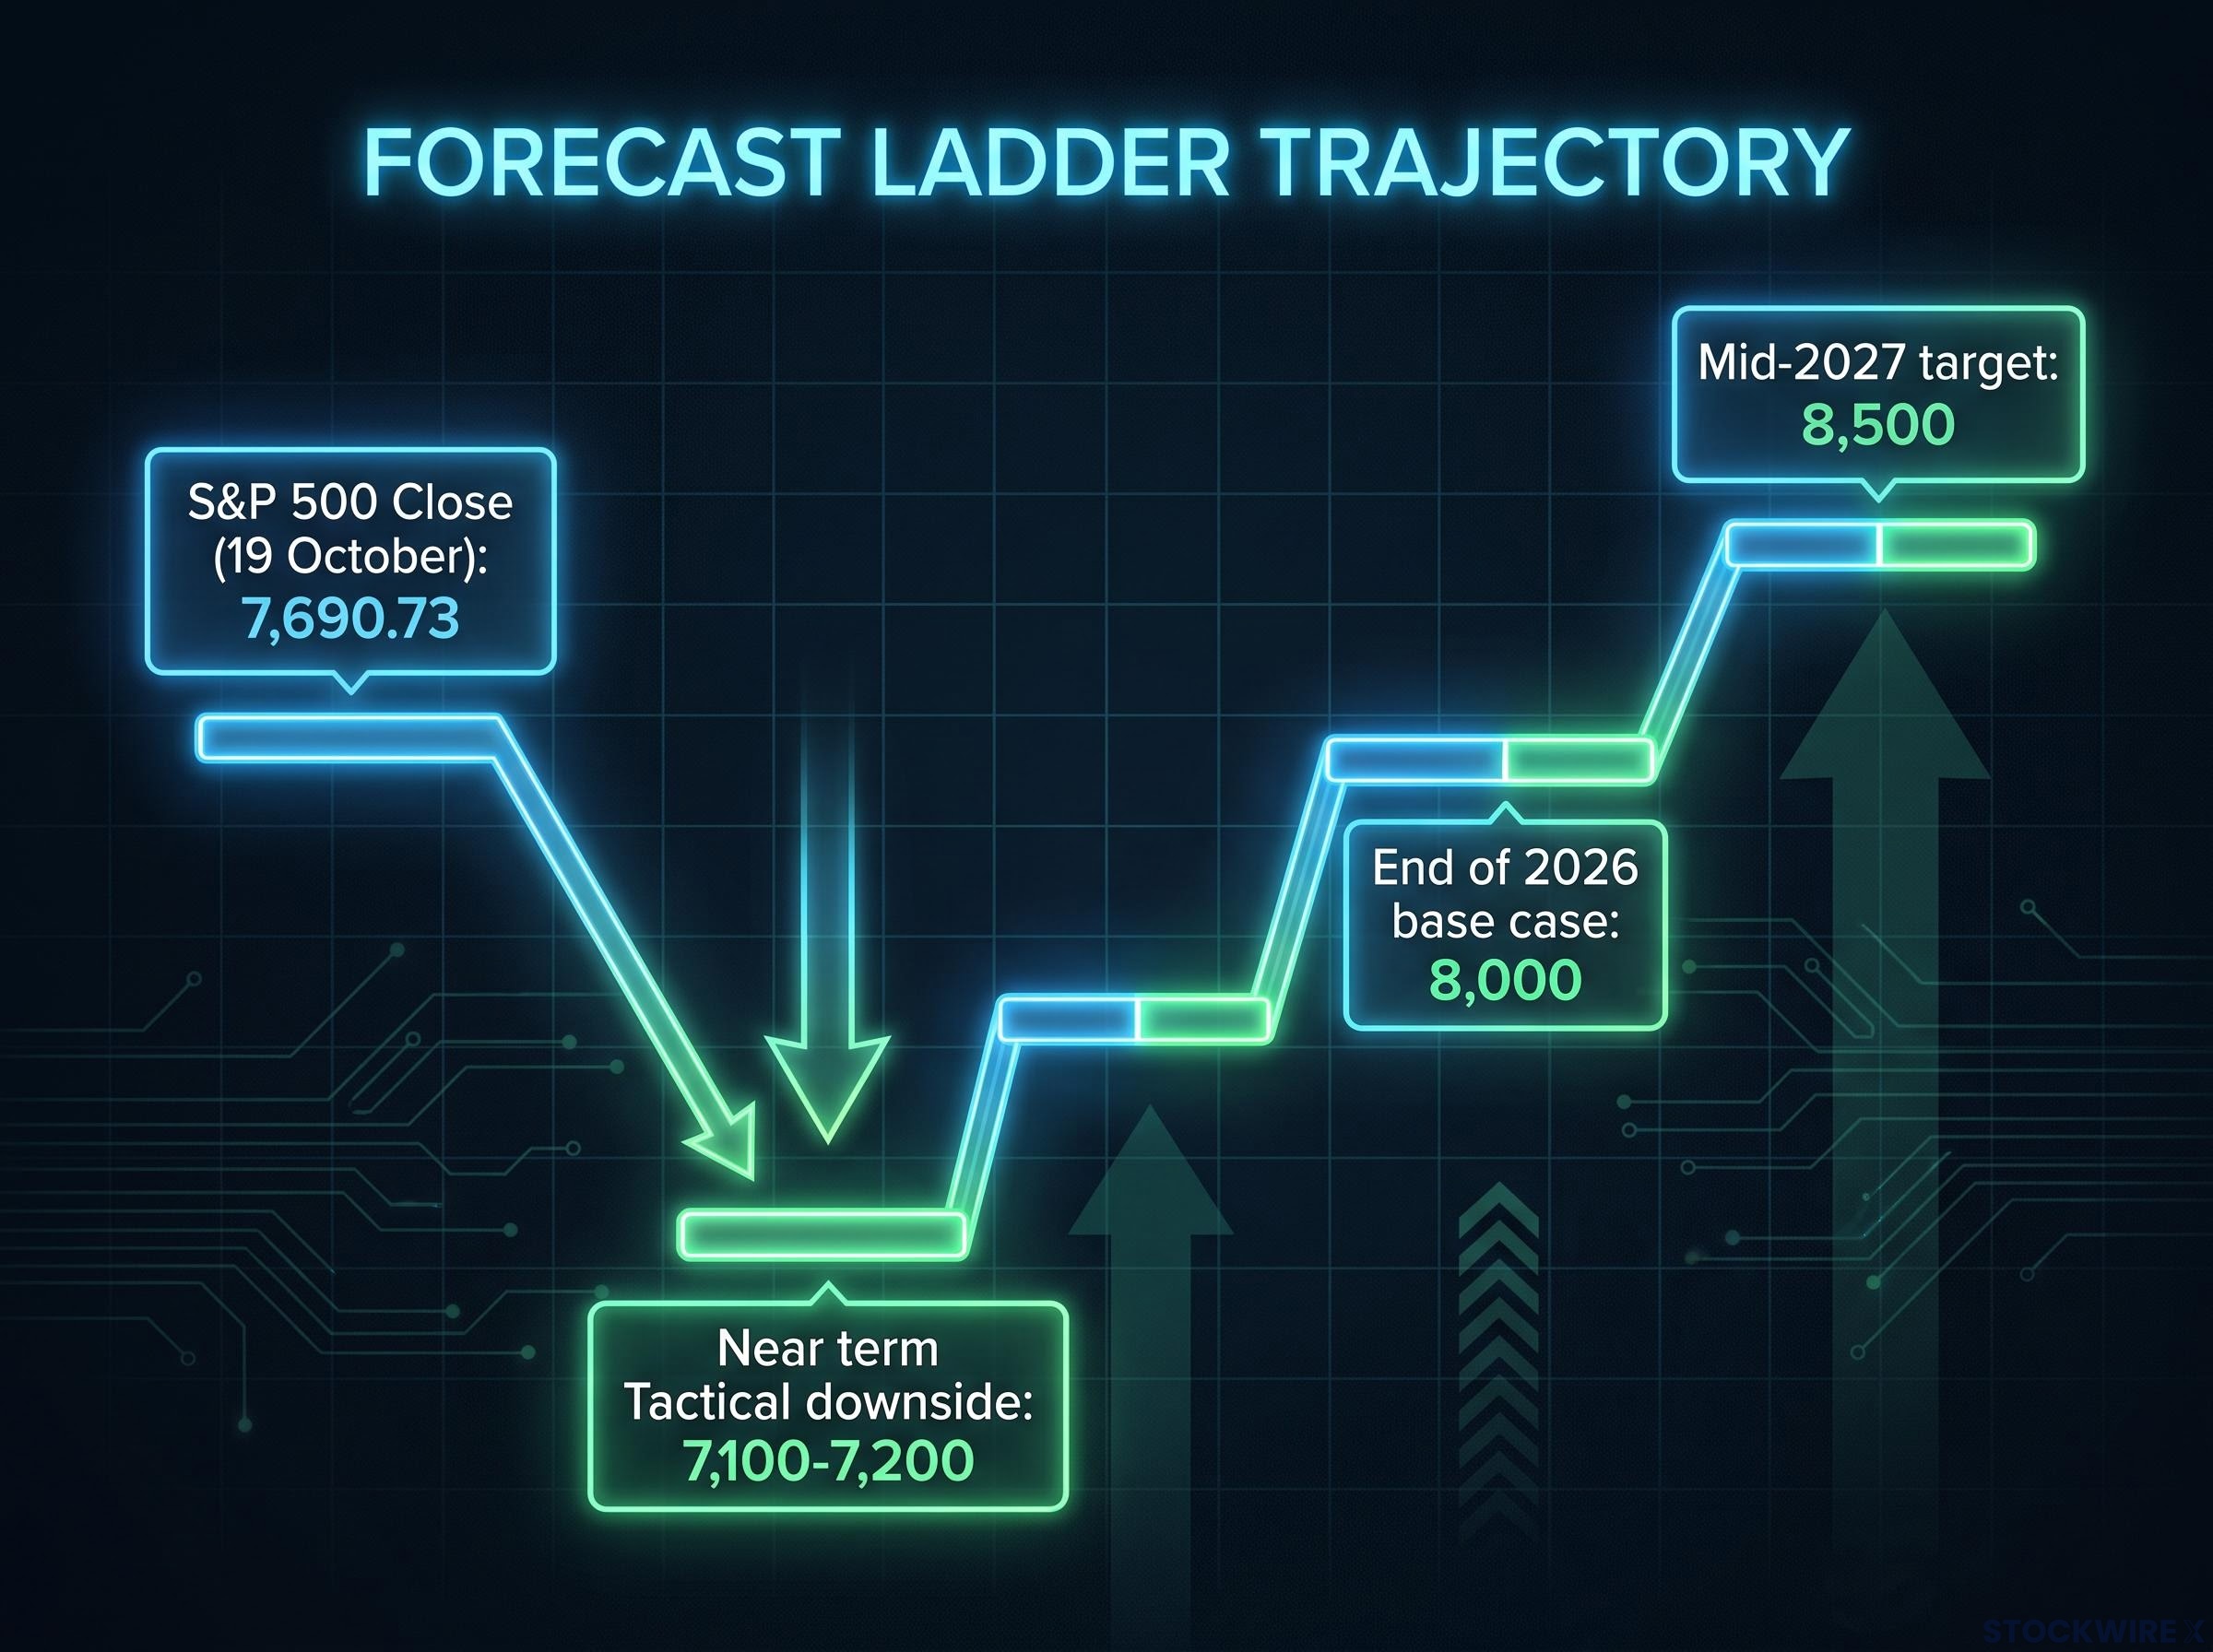
He names three pressure points: concerns about how AI infrastructure is being financed, uncertainty around the midterms, and Fed liquidity and policy settings. His targets fall into a clear sequence.
| Level | Figure | Timeframe | Role in Wilson’s view |
|---|---|---|---|
| Tactical downside | 7,100-7,200 | Near term | Final flush, possibly slightly below the 200-day moving average |
| Year-end base case | 8,000 | End of 2026 | Recovery after the correction ends |
| Mid-2027 target | 8,500 (previously 8,300) | Mid-2027 | Stronger 2027, about 10% above current levels |
The S&P 500 is up about 12% this year and closed at 7,690.73 on 19 October. Weeks earlier, the equal-weight version of the index was heading for a seventh consecutive weekly loss. The original source says that streak had previously appeared only in 2002 and 2022, while other coverage called it the longest since May 2022.
The primary Morgan Stanley note was not publicly accessible, so these figures rely on secondary reporting.
The ladder tells you Wilson is not forecasting a smooth climb. A drop towards 7,100-7,200 is part of his own base case, not evidence against it.
When big ASX news breaks, our subscribers know first
Why does the index hide the weakness? What the breadth signals show
Wilson’s thesis depends on breadth, which measures how many stocks are taking part in a move. The numbers from the past ten weeks show the divergence clearly.
From mid-August highs to early October lows, the Invesco S&P 500 Equal Weight ETF (RSP), which gives every company the same weighting, fell about 10%. Over the same stretch, SPY, the most widely held cap-weighted S&P 500 fund, slipped from around 775 on 14 August to only about 10 points lower. The largest technology companies held the headline steady while most stocks declined.
The concentration is even sharper in QQQ, the Nasdaq-100 fund, where a handful of names make up 30-40% of the portfolio.
Then the pattern reversed. SPXA50R, the share of S&P 500 companies trading above their 50-day average price, fell from 65% to 20% before recovering to roughly 55%.
| Measure | Earlier reading | Latest reading | Date/source |
|---|---|---|---|
| Stocks above 50-day average | 35.2% | 58.3% (59.0% alternative) | 10 sessions to 23 October |
| Stocks above 200-day average | About 39-40% | 55.9% (58.6% alternative) | 10 sessions to 23 October |
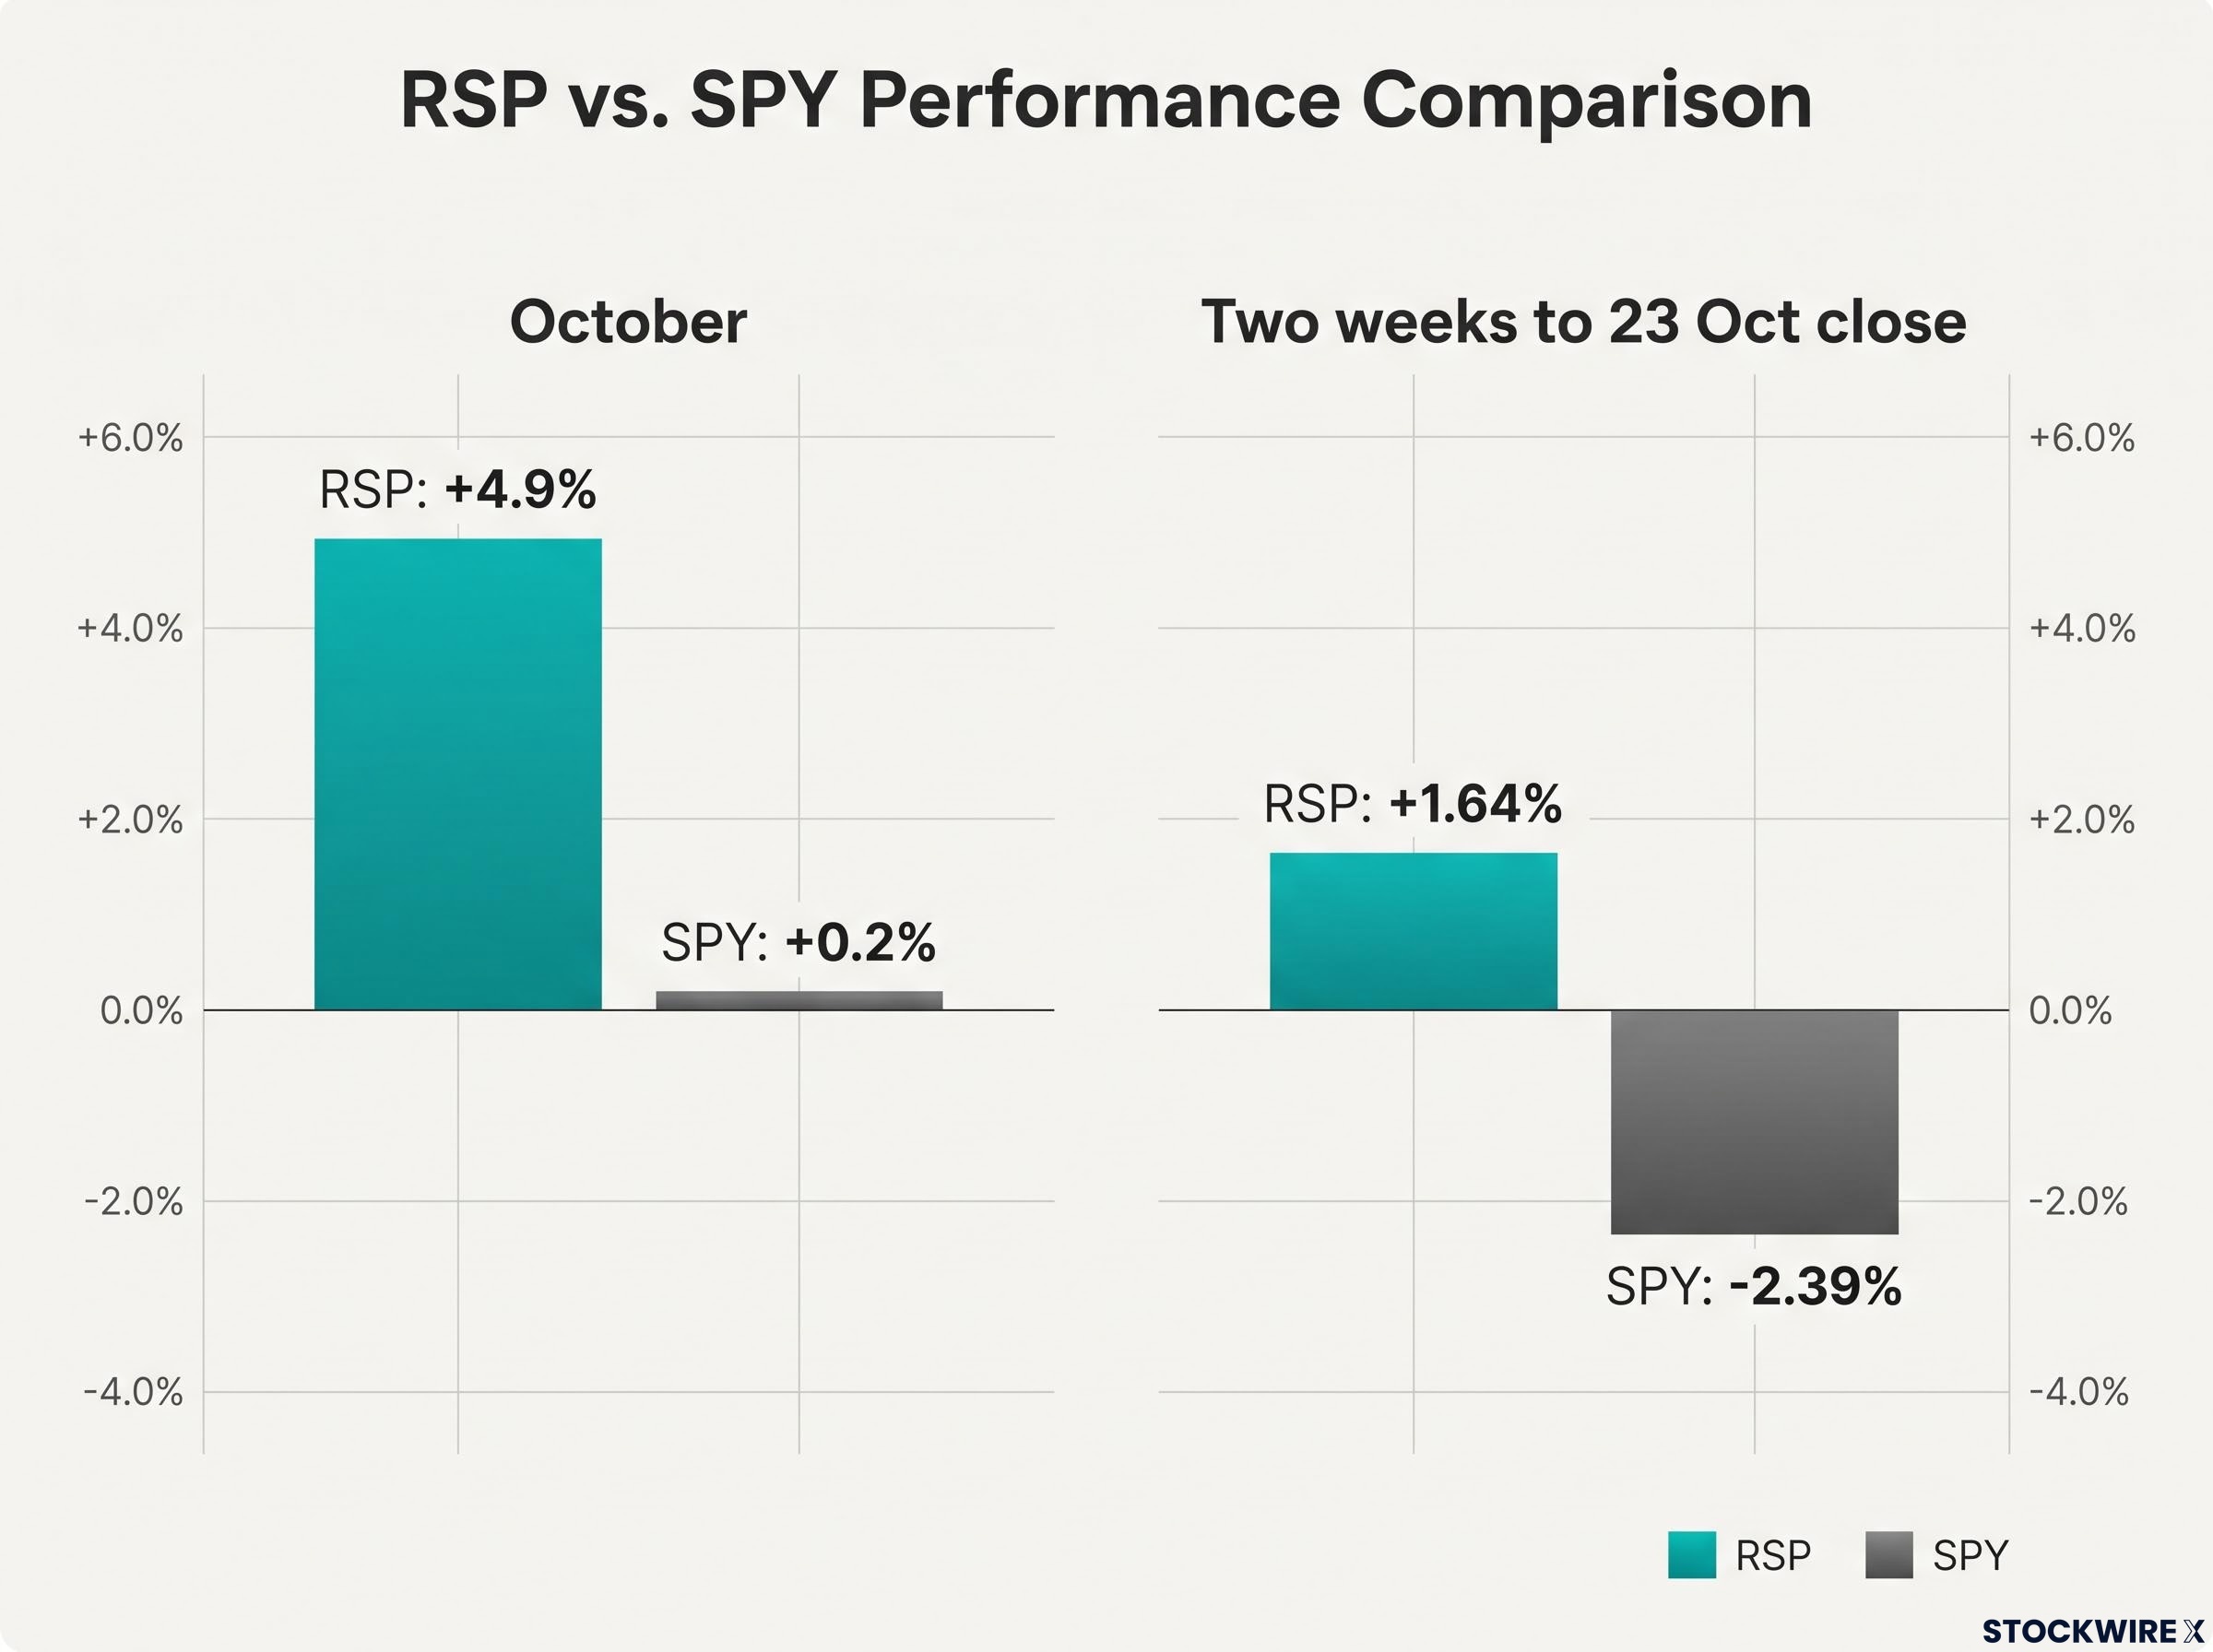
| RSP vs SPY, October | n/a | RSP +4.9%, SPY +0.2% | Through 22 October |
| RSP vs SPY, two weeks | n/a | RSP +1.64%, SPY -2.39% | 23 October close, Savior Wealth |
The alternative readings come from a constituent-file calculation that uses different eligibility rules, so treat each figure as a range rather than a precise number. Either way, the average stock has gained about 4% since the 1 October low.
If you hold a cap-weighted index fund, your returns may have depended on a handful of stocks. The rebound suggests that dependence has started to ease.
What drove the gap
- Mega-cap weighting: a few very large companies can lift the index while the median stock falls.
- AI earnings concentration: Goldman Sachs estimated AI capital spending contributed roughly half of S&P 500 earnings growth, with the top 10 companies expected to deliver about 68% of Q3 earnings growth. These figures have not been independently confirmed.
- Rate sensitivity: rising Treasury yields weigh on growth stocks valued on distant profits.
- Earnings dispersion: one Goldman analysis expected technology and energy to produce almost 80% of projected earnings growth.
- Rotation: capital moved towards healthcare, value and consumer staples in late October.
The first two drivers are structural and may persist, while rates and rotation are cyclical and can reverse quickly.
How do you read options pricing as a probability? A primer on delta and touch odds
The real question is how likely 8,500 is. Options prices offer one way to estimate it.
Start with a straddle, which means buying a call and a put at the same strike price. If a stock trades at $100 and the at-the-money straddle costs $6, the market is pricing a typical move of about $6 either way, a range of $94-$106.
Next comes delta. Delta measures how much an option’s price changes for each one-unit move in the underlying asset. For out-of-the-money options, it is often used as a rough estimate of the chance the option finishes in the money, meaning it expires with value.
Traders also use a shortcut: the probability of the price touching a strike at any point before expiry is roughly 2 times delta. A 30-delta option is sometimes described as having about a 60% chance of being touched.
The logic is that a price which reaches a level has roughly even odds of staying above it, so touch odds run about double the finishing odds.
Where the 2x delta rule breaks down
- Touching a strike is not the same as finishing beyond it.
- Options price risk-neutral odds, not real-world forecasts.
- Skew makes index puts pricier than calls, creating an uneven distribution.
- Implied volatility shifts with price, time and event risk.
- Drift, jumps, dividends and overnight gaps distort realised outcomes.
- Gamma changes delta as the price nears the strike.
The takeaway Options-implied moves are market-priced ranges and relative-risk indicators, not precise forecasts.
Read any options-implied probability as the price the market charges for risk. It tells you about hedging demand as much as about the likelihood of an outcome.
Does the options market agree with 8,500? Testing the target and the risks that could break it
Apply that method to Wilson’s target and the answer is roughly a coin flip.
In an analysis by Tasty’s Options Math Check, with the S&P 500 near 7,677, the June 2027 8,500 strike traded near $12,000 per contract at about 25 delta. Doubling that gives about 50% odds of touching 8,500 within 233 days.
The implied move to June 2027 is about 800 points, which puts 8,500 at the upper edge of that range. Reaching it requires an above-average outcome, and every limitation above applies to the estimate.
Even odds mean the market treats 8,500 as plausible but not assured. You are better off viewing the target as a scenario to size around than a base case to bet on.
Other strategists are not far from Wilson, but they emphasise different risks.
| Strategist | Date | View |
|---|---|---|
| Goldman Sachs, Ben Snider | October 2026 | Retained 8,000 year-end target; warned about concentration |
| Goldman Sachs breadth analysis | September 2026 | Breadth weakest since the dot-com bubble |
| JPMorgan, Jason Hunter | 21 October 2026 | Rolling corrections may be ending; stay defensive until resistance and seasonal weakness clear |
| JPMorgan Asset Management, Jordan Jackson | 7 October 2026 | S&P 500 positive 12 months after every midterm since 1950, averaging about 15% |
The next six weeks bring several dated tests:
- 27-28 October: FOMC decision
- 28 October: Alphabet and Microsoft earnings
- 29 October: Amazon earnings
- 2 November: Apple earnings
- 3 November: Midterm elections
- 18 November: Nvidia earnings
- 8-9 December: Next FOMC meeting
No attributable market-implied probability for this week’s Fed decision was available.
Risks that could break the thesis
Narrow leadership remains the central weakness, because Goldman warned that momentum strategies could suffer if leaders fall rather than laggards catching up. Bearish commentators such as Andrew Lapthorne argue AI spending may not generate enough revenue, and Morningstar coverage cited a possible decline towards 5,000 in a severe scenario.
Rising yields could compress valuation multiples, particularly for long-duration tech. Favourable post-midterm history also does not rule out a selloff before the vote, and no authoritative study shows what followed the equal-weight losing streaks of 2002 and 2022.
What the target changes, and what it does not
The evidence leans towards Wilson without confirming him. Breadth has improved sharply, options price roughly even odds of touching 8,500, and the route there likely runs through turbulence around the Fed, mega-cap earnings and the midterms.
Three signals will tell you whether his view is holding:
- The share of stocks above their 50-day and 200-day averages, and whether it keeps rising
- RSP versus SPY, which shows whether the typical stock keeps outperforming
- How the S&P 500 behaves if it tests its 200-day moving average
Keep the limits in view. The figures rely on secondary sourcing, breadth readings conflict by several points, and the options maths is an approximation. If breadth holds through Nvidia’s results on 18 November, the case for 8,500 gets stronger; if it fades, the downside leg of Wilson’s ladder becomes the main event.
This article is for informational purposes only and should not be considered financial advice. Investors should conduct their own research and consult with financial professionals before making investment decisions. Past performance does not guarantee future results, and financial projections are subject to market conditions and various risk factors.