Gold closed at $3,988.06/oz on 26 October 2026, about 29% below its January peak of $5,608.35. Yet Whan, a veteran advisor and long-term gold holder, still talks about $10,000. Before you trust any gold price prediction, you need to decide which of those numbers actually deserves your attention.
The question is not academic. Central banks keep adding bullion, US federal debt has passed $40 trillion, and American consumers are carrying credit stress that has stabilised without healing.
The three main hard assets have also split apart. Gold is roughly flat for the year at +0.16%, while silver has gained 14.87% and copper 25.79%.
This gives you three tools: a way to judge any gold forecast by its assumptions, a clear sense of how gold, silver and copper differ, and a set of questions for stress-testing a barbell allocation before you commit money to one.
How do gold, silver and copper actually differ as hard assets?
You might assume these three metals are one “commodity trade” that rises and falls together. This year’s numbers disprove that.
Gold is a monetary metal. You hold it as a store of value outside the financial system, and its price responds to confidence in currencies, central banks and government debt.
Silver is a hybrid. It carries some monetary appeal, but heavy industrial demand from electronics, solar panels and manufacturing drives much of its price. Whan describes silver as commercial and technological, and gold as monetary.
Copper sits at the far end. It is an industrial and electrification metal, priced on construction, power grids and factory output.
Supply adds a twist. Whan points out that gold and silver are largely mining byproducts with few good deposits, so producers cannot quickly lift output when prices climb. He also argues that fiat money cancels debt in a way Bitcoin does not, which is his case for gold’s monetary role.
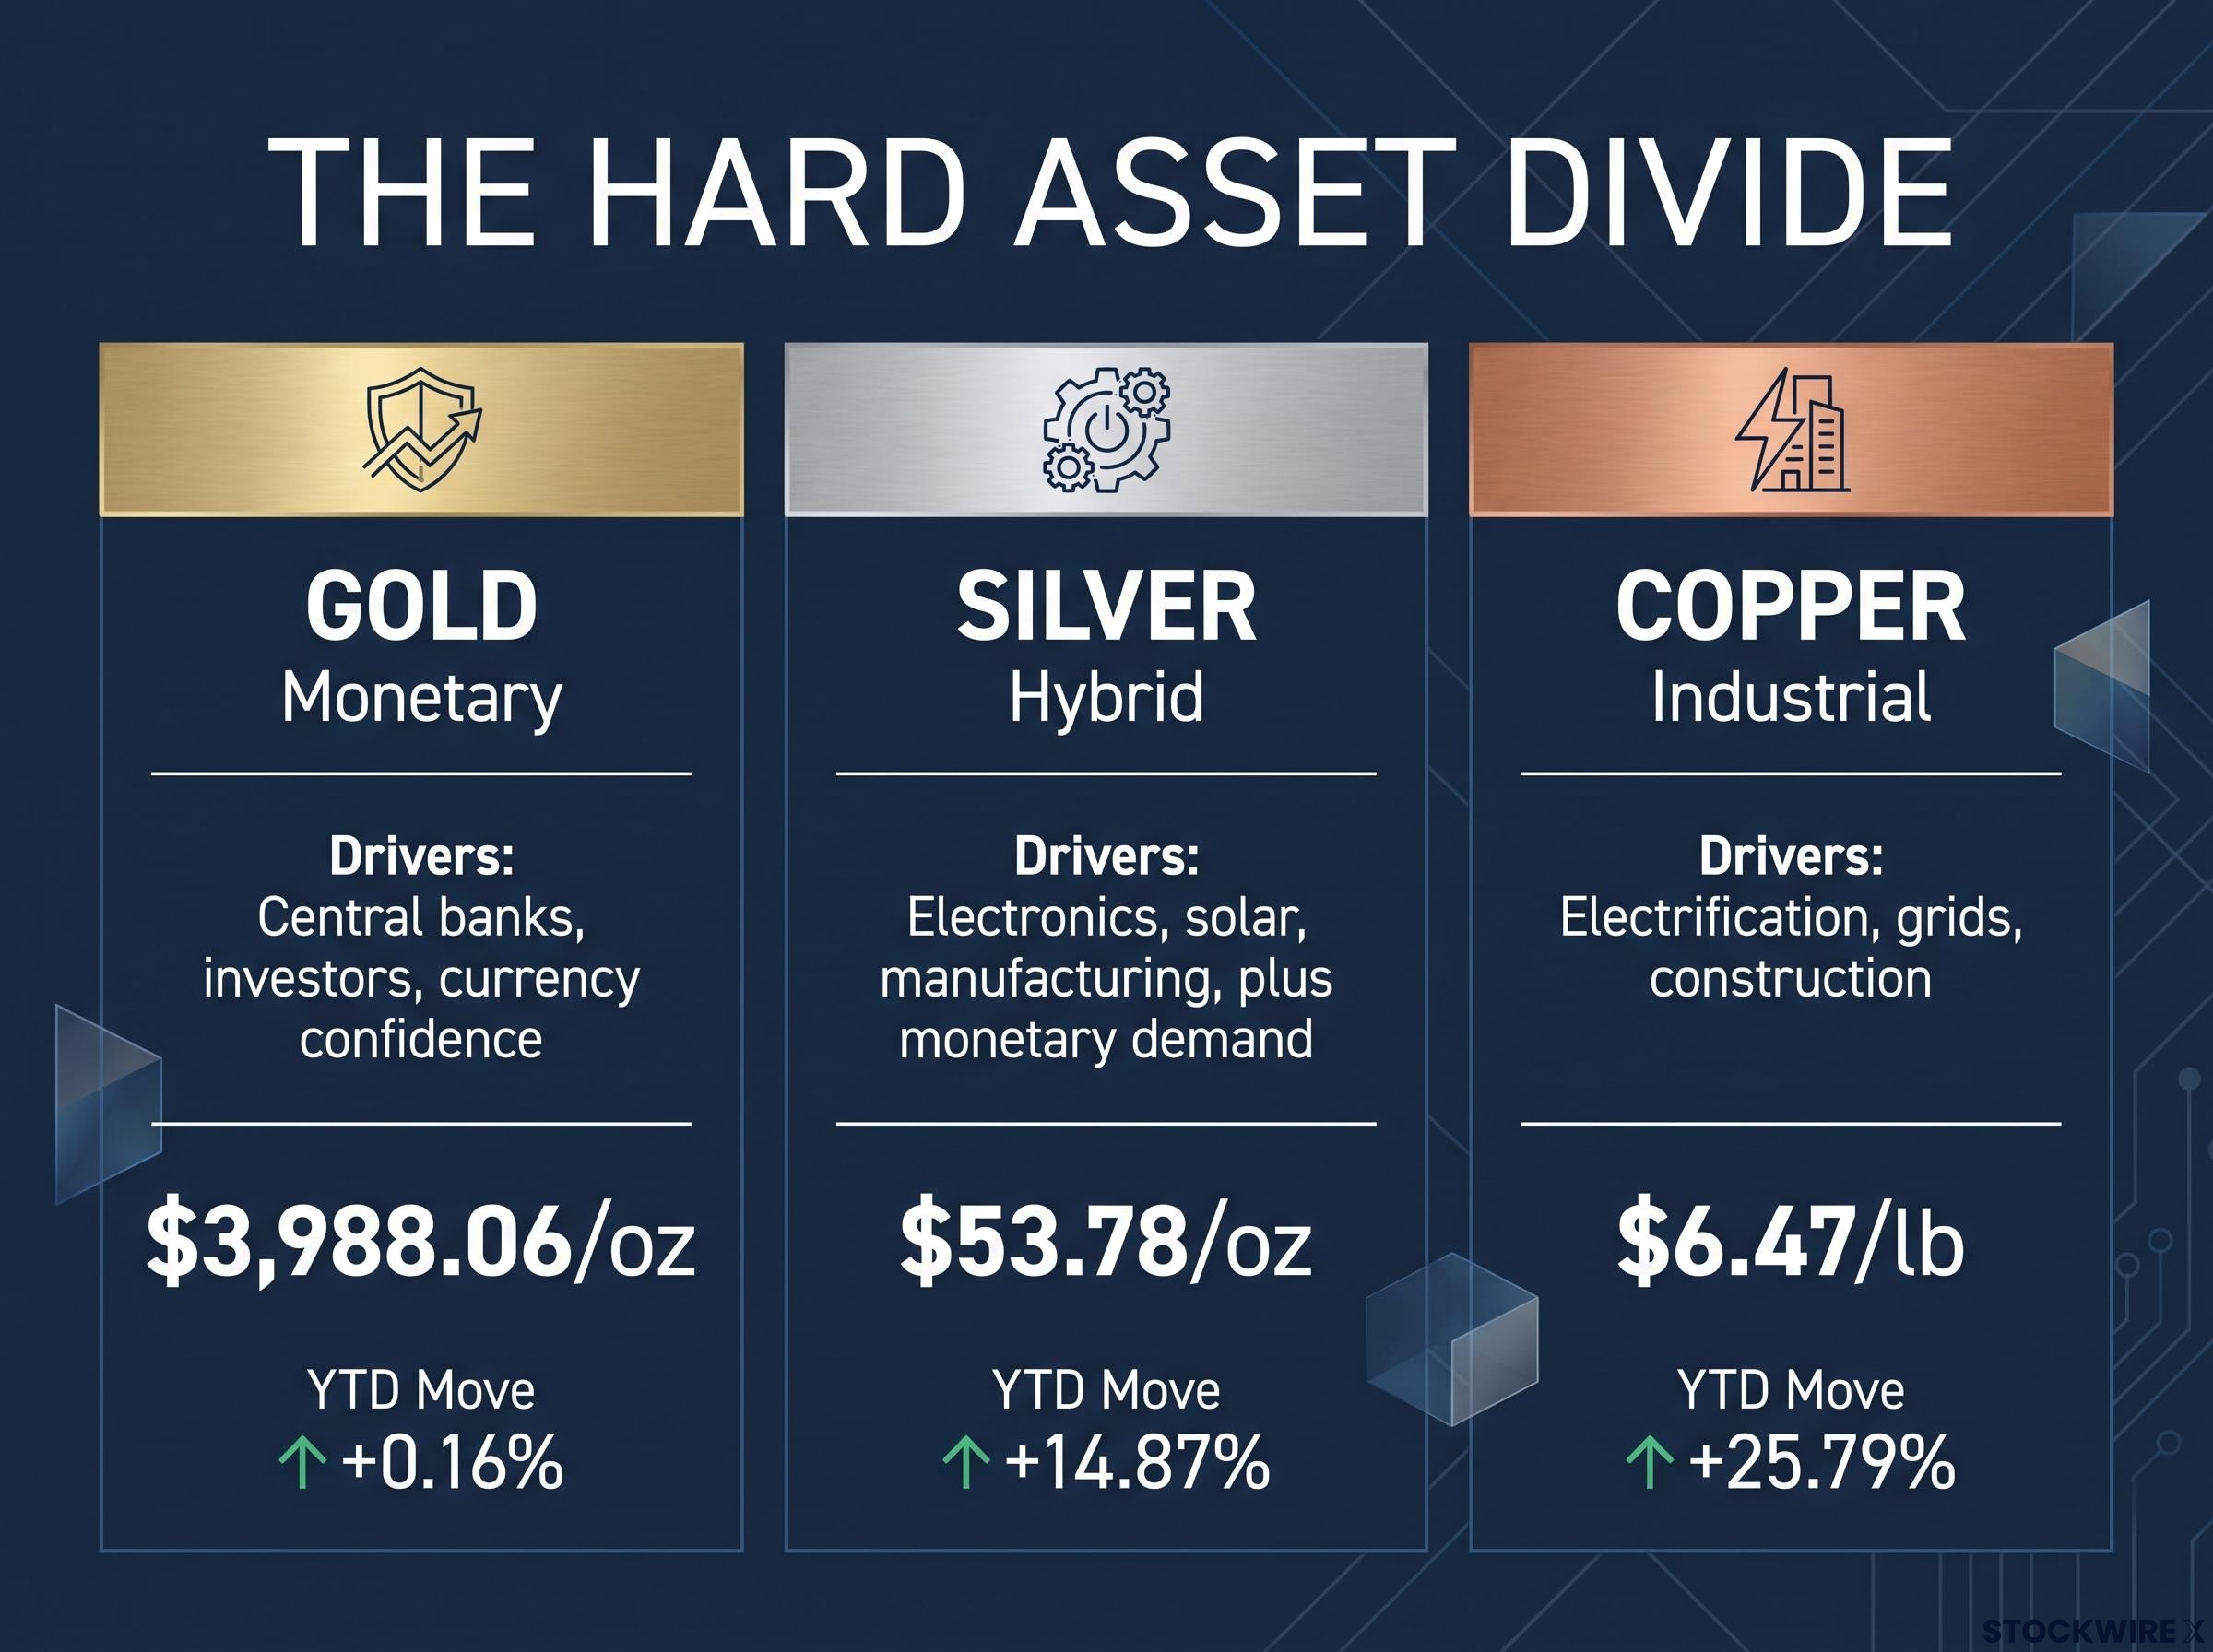
| Metal | Primary role | Main demand driver | Price (26 Oct 2026) | Year-to-date move |
|---|---|---|---|---|
| Gold | Monetary | Central banks, investors, currency confidence | $3,988.06/oz | +0.16% |
| Silver | Hybrid | Electronics, solar, manufacturing, plus monetary demand | $53.78/oz | +14.87% |
| Copper | Industrial | Electrification, grids, construction | $6.47/lb | +25.79% |
Source: Trading Economics.
Why the monetary versus industrial split matters
In a recession, silver can weaken even if monetary demand holds, because factories and solar installers buy less. Gold does not depend on factory output in the same way.
So holding all three is not diversification within one theme. You are taking exposure to three different economic regimes: monetary stress, industrial demand and supply shortage.
When big ASX news breaks, our subscribers know first
What is behind the central-bank bid, and what is a realistic gold price prediction?
Every bullish gold forecast leans on one buyer above all others: central banks. Start with what they are actually doing.
Why central banks are buying
According to the World Gold Council (WGC), central banks made 39 tonnes of reported net purchases in August 2026, taking publicly reported buying to 170 tonnes for the year. Second-quarter purchases reached 289 tonnes, up 74% year on year. Poland led with 98 tonnes, followed by China at 80 tonnes and Uzbekistan at about 50 tonnes.
Goldman Sachs offers a different picture, estimating 79 tonnes of buying in August alone. The gap reflects reported purchases versus estimates that include unreported buying, so you should treat official figures as a floor.
The motive is risk management, not a simple exit from the dollar:
- Sanctions risk: dollar reserves sit in systems that can be frozen.
- Reserve diversification: gold carries no issuer’s promise to pay.
- Political neutrality: physical gold can be held at home, outside foreign clearing systems.
- Inflation and currency protection: gold supply grows slowly relative to paper money.
The International Monetary Fund (IMF) set out the trade-off on 18 August 2026:
IMF on gold reserves Gold can hedge sanctions risk because it carries no credit risk, but it is less liquid and more volatile than other reserve assets.
These are structural drivers. Cyclical forces such as real yields (bond returns after inflation), the dollar, exchange-traded fund (ETF) flows and positioning can still push prices around in the short run.
One claim needs correcting. Basel III bank rules do not make gold Tier 1 capital, the core equity buffer banks hold against losses. Allocated physical gold now gets more favourable treatment, which supports bullion demand, but it is not a mandate to buy.
What the forecasts assume
| Institution | Forecast | Timeframe | Key assumption |
|---|---|---|---|
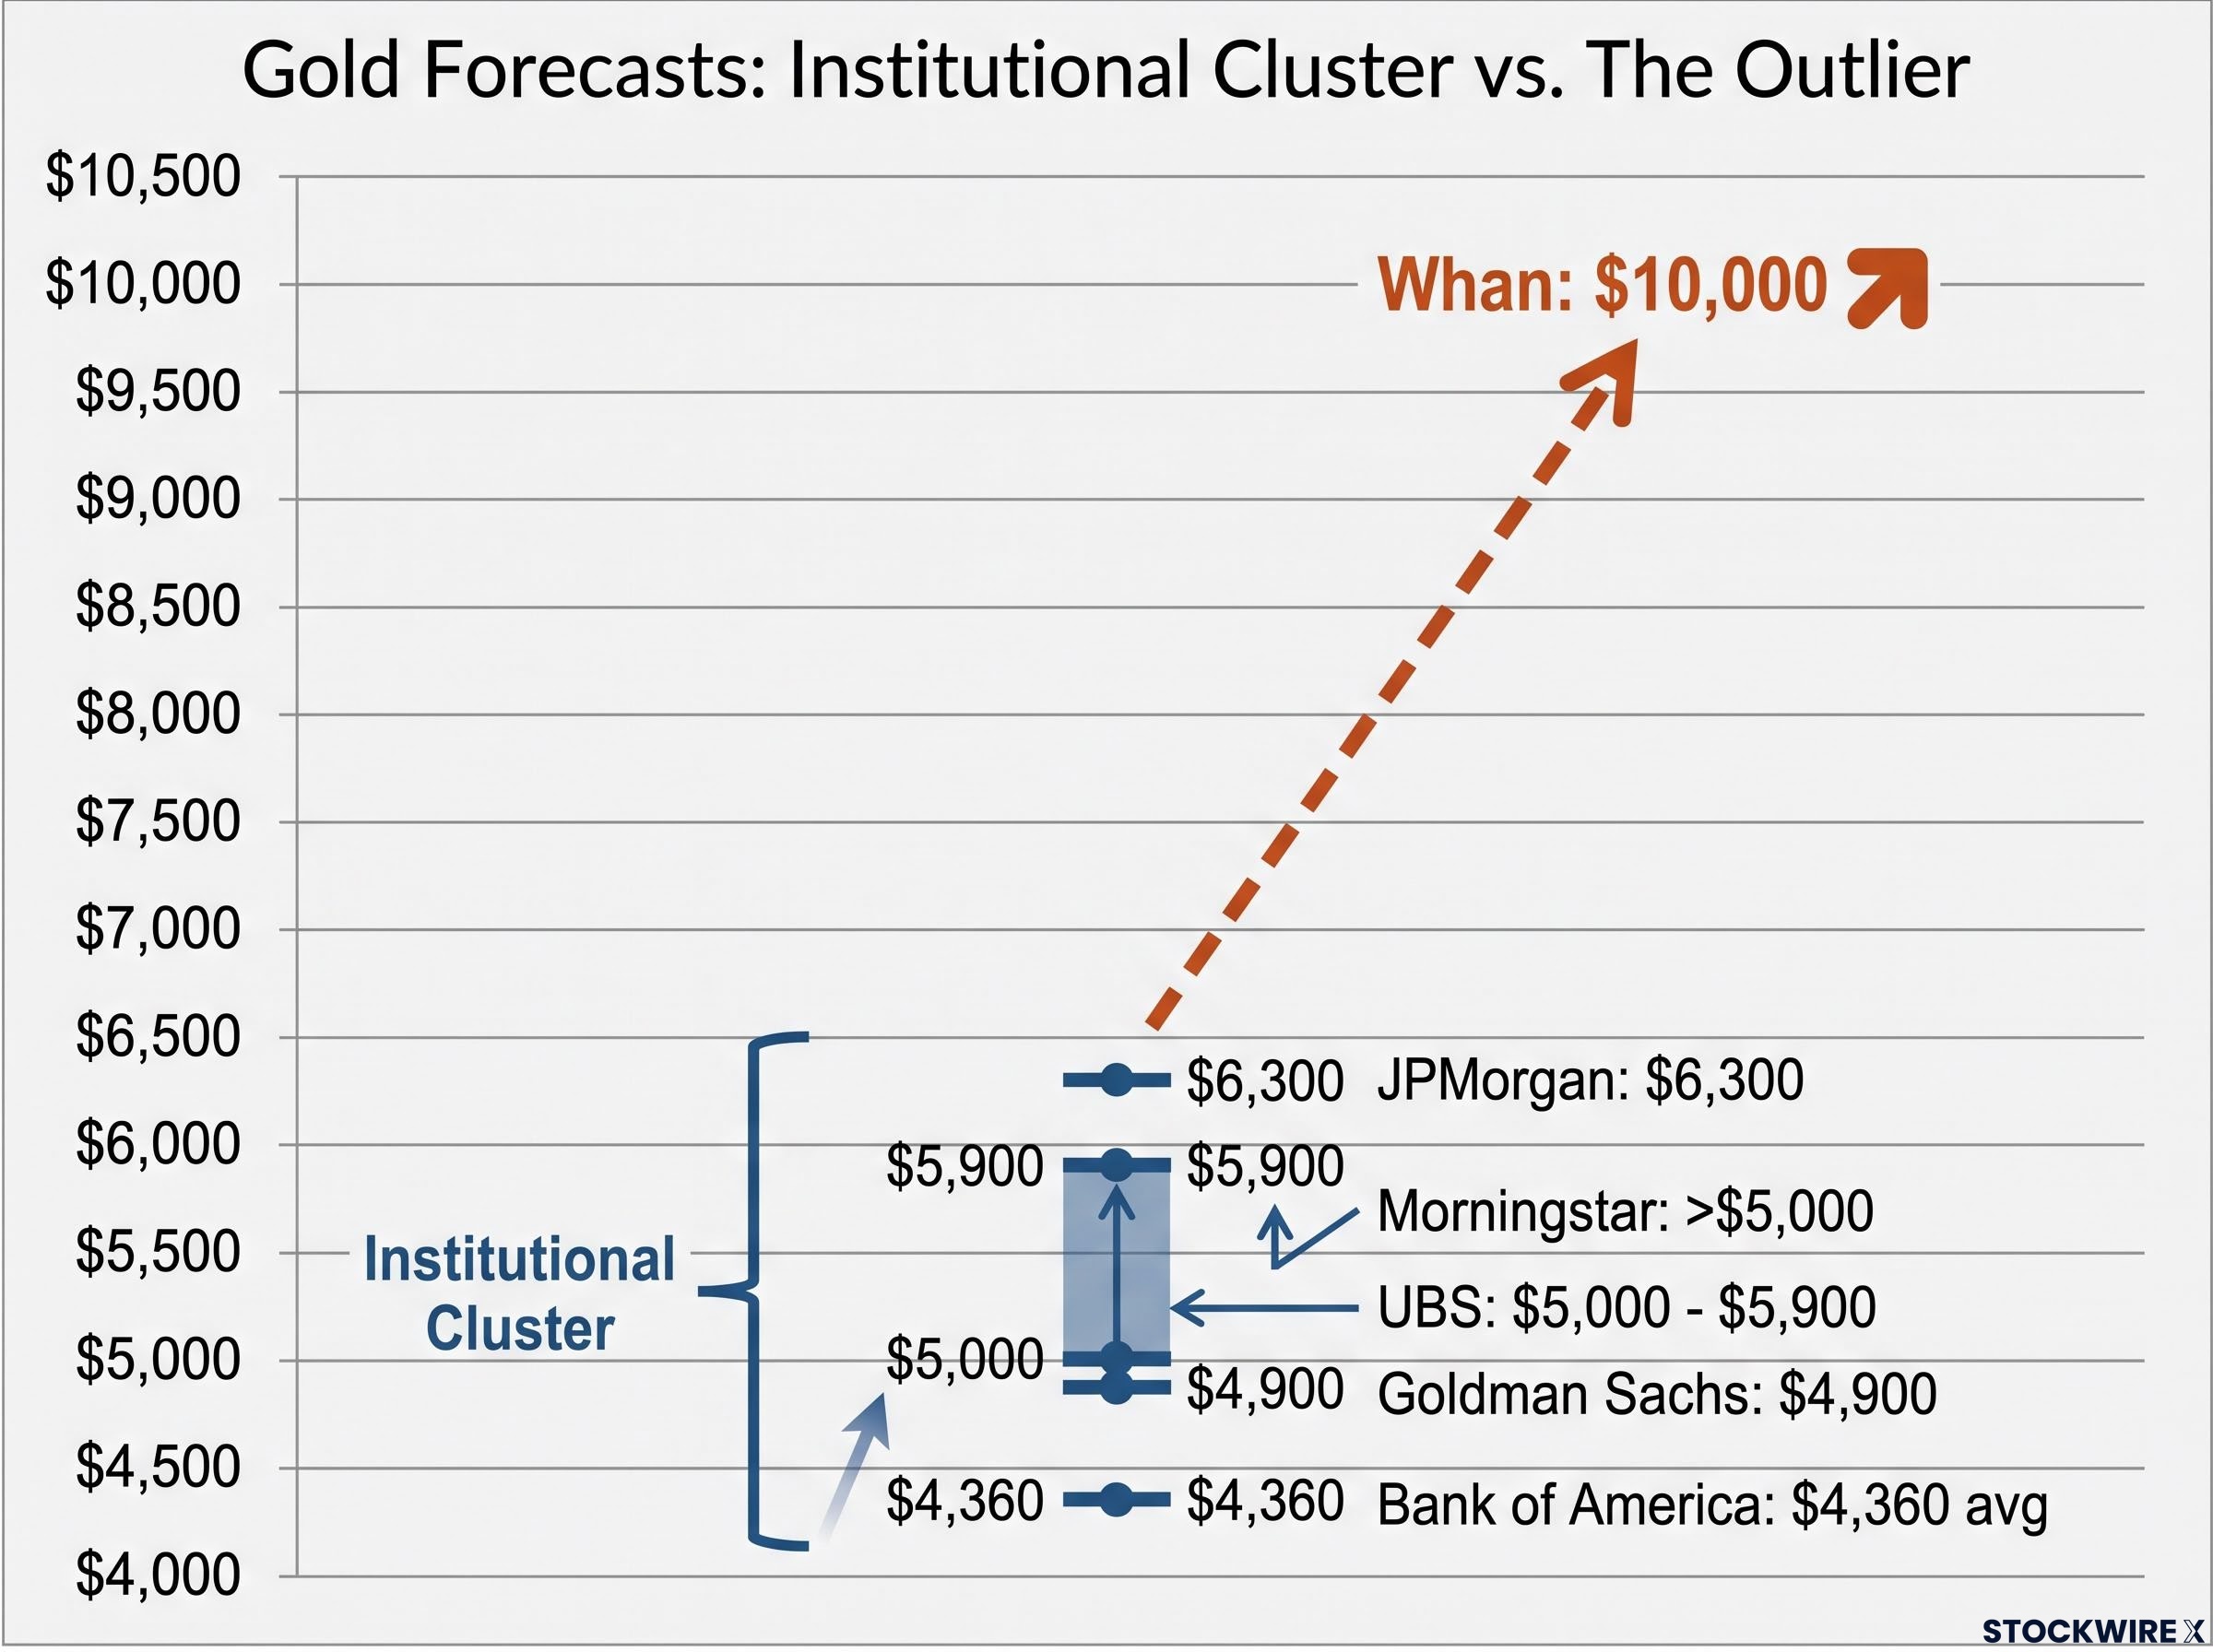
| Goldman Sachs | $4,900/oz | End-2026 | Central banks buy about 50 t/month (vs 17 t pre-2022) |
| JPMorgan | $6,300/oz | End-2026 | Strong demand; rate-hike downside flagged |
| UBS | $5,900; $5,000 | Year-end; H1 2027 | Central-bank and ETF demand, lower real rates |
| Bank of America | $4,360 average; $5,000 possible | 2026 | Upside once Fed tightening ends |
| Morningstar | Possible return above $5,000 | Year-end | Prices reflect consensus; may stay rangebound |
| World Gold Council | No fixed target | Scenario-based | Demand drivers |
The institutional cluster runs from roughly $4,360 to $6,300. No published base case sits near $10,000, and that figure rests on a single source. Reaching it would take a crisis-level mix: much faster reserve diversification, lost confidence in US fiscal management, sustained currency debasement or a severe shock.
A forecast is only as good as its assumptions. Track central-bank buying and real rates, not the headline target.
Gold has no cash flows to anchor a valuation model, which is why any gold price prediction can miss badly even when every theoretical driver points the same way.
Past performance does not guarantee future results. Financial projections are subject to market conditions and various risk factors.
Why do US debt and a strong dollar cut both ways for gold?
Central banks explain part of the bid. Washington’s balance sheet explains much of the rest.
The fiscal arithmetic
| Indicator | Figure | Source | Date |
|---|---|---|---|
| FY2026 federal deficit | $1.99 trillion (up $217 billion) | Reuters | October 2026 |
| Total federal debt | More than $40 trillion | Reuters | October 2026 |
| FY2026 debt-service cost | $1.36 trillion | Reuters | October 2026 |
| Net T-bill supply increase | More than $550 billion | US Treasury | July-August 2026 |
The Treasury is managing maturities rather than shrinking debt. Some 10-30-year buyback operations have doubled to at least $4 billion each, while short-term Treasury bills (T-bills, government debt maturing within a year) cover near-term funding. That improves liquidity but does not cut the borrowing requirement.
Economists watch the point where borrowing costs overtake growth, which the CBO projects around fiscal year 2031, because after that a primary surplus rather than a smaller deficit is needed to stabilise debt.
Whan is sharply critical of Treasury Secretary Scott Bessent’s approach. In his view, debt is being rolled in what economist Hyman Minsky called the “Ponzi” phase, where borrowers can only service debt by taking on more. That is his opinion, not an established fact.
Then the dollar complicates things. It stays strong because of its liquidity and its role in financing and commodity payments, and a strong dollar can suppress dollar-priced gold even when demand is solid.
Consumer credit: stabilised, not healed
New York Fed data for Q2 2026 shows household debt of $18.8 trillion, including $1.26 trillion in credit cards and $1.71 trillion in auto loans, with 4.7% in some stage of delinquency. Card balances 90+ days late rose from 7.6% in Q3 2022 to 12.8% in Q1 2026 before plateauing, and the Federal Reserve put the card charge-off rate at 3.82%.
Whan has shorted a couple of consumer lenders and avoids consumer durables. For you, the lesson is about timing: fiscal stress supports gold’s long-term case, but a strong dollar and high real rates can delay it, even if the thesis proves right.
How does a barbell portfolio work, and where does copper fit?
If the timing is uncertain, the structure of your holdings matters more than any target.
The barbell and its limits
A barbell splits a portfolio between two very different ends. Whan holds precious metals and real estate at one end and income assets at the other. He has also turned partly risk-off: more energy, income holdings kept, financials exited, consumer exposure avoided. That is one advisor’s approach, not a template.
Each end carries risk. Gold pays no yield, real estate faces refinancing costs, vacancies, regulation and illiquidity, and income assets can suffer from inflation, though they provide contractual cash flows gold lacks.
The core counterargument is concentration. If you assume inflation, currency weakness and geopolitical stress will dominate every regime, the barbell becomes one big bet. Both BofA and JPMorgan have flagged higher-rate risk.
Copper: surplus or shortage?
The International Copper Study Group (ICSG) projects a 2026 global refined surplus of about 104,000 tonnes, rising to 368,000 tonnes in 2027. Goldman sees a 950,000-tonne deficit outside the US and forecasts $14,700/tonne by end-2026.
Both can hold true. ICSG measures global refined output against usage, while Goldman focuses on regional availability and US stockpiling. BHP’s quarterly copper output fell 19% to 400,700 tonnes, and Whan expects new Americas mines, while electrification, grids and data centres support long-term demand even as near-term surpluses build.
What history does and does not prove
| Episode | What happened | Relevance today | Key difference |
|---|---|---|---|
| 1970s | Gold surged as Bretton Woods ended | Monetary instability can outweigh no yield | Today’s system is more dollar-based |
| 2008-2011 | Rally, then sharp correction | Banking stress lifts demand | Stronger dollar and higher real rates ended it |
| 1933 | Official price raised from $20.67 to $35/oz | Governments can reset gold’s value | Happened under a gold standard |
History supports a strategic allocation more than an unconditional price target. Gold can suffer severe corrections inside long bull markets.
Before you size any position, ask yourself:
- Which economic regime am I betting on?
- What would break that bet?
- How much could I lose in a correction and still hold?
- Does each metal match the role I need it to play?
The barbell is a way to survive being wrong about the regime. Size each end by what you can tolerate losing, not by conviction in a forecast.
Investors weighing how far to take a hard-asset tilt can read our full explainer on gold as a monetary reset asset, covering the bullion versus miners decision.
Weighing the hard-asset case without chasing a number
Institutional gold forecasts cluster far below $10,000. Central-bank buying and US fiscal stress support the structural case, while the dollar, real rates and crowded positioning push the other way.
Remember that gold, silver and copper answer different questions. Treating them as one trade blurs the very risks you are trying to manage.
Three variables deserve your attention from here:
- The pace of central-bank purchases
- Real yields and the dollar
- The direction of US fiscal policy
November’s midterm results and Federal Reserve decisions could shift all three. These statements are speculative and subject to change based on market developments.
This article is for informational purposes only and should not be considered financial advice. Investors should conduct their own research and consult with financial professionals before making investment decisions.