The S&P 500’s relative strength index (RSI) climbed from about 28 to above 70 in roughly 11-12 trading days this spring, while the index rebounded about 17%. If you had followed the most common rule about this indicator, you would have sold at 70 and missed the rest of the rally.
That rule says a reading above 70 means sell and a reading below 30 means buy. It is simple and easy to remember, and it is often wrong.
RSI is one of the most widely used momentum tools on any charting platform. Yet many traders treat it as a mechanical reversal switch. That habit can cost you twice: you sell winners too early, and you buy into declines that keep falling.
Here is how to read the tool properly. You will see why threshold readings are context rather than commands, how divergence works and where it fails, what the evidence says about reliability, and which signals to pair it with before you act.
What the RSI indicator measures and how to read it
Add RSI to a chart and you get a line moving between 0 and 100, usually with a shaded band between 30 and 70. On TradingView, for example, you can find it by searching “Relative Strength Index” in the indicators menu. The line looks simple, but the number behind it has a specific meaning.
RSI is a bounded momentum oscillator. A momentum oscillator is an indicator that measures the speed of price changes and moves within a fixed range. J. Welles Wilder Jr. introduced it in his 1978 book, New Concepts in Technical Trading Systems.
| Indicator | Developer | Publication | Default period | Scale |
|---|---|---|---|---|
| Relative Strength Index | J. Welles Wilder Jr. | New Concepts in Technical Trading Systems (1978) | 14 periods | 0-100 |
How the calculation works, in plain terms
RSI compares the size of recent gains with the size of recent losses. First, it calculates relative strength (RS): RS = average gain ÷ average loss. It then converts that ratio into the 0-100 scale using RSI = 100 – 100 / (1 + RS).
Your charting software does the arithmetic automatically, so you only need the logic. When gains dominate the lookback window, RSI rises toward 100. When losses dominate, it sinks toward 0. Fidelity describes the result as a measure of “the speed and change of price movements.”
The usual reference levels are conventions, not laws:
- Above 70: traditionally labelled overbought
- Below 30: traditionally labelled oversold
- 80/20: some traders use these levels to reduce the number of extreme readings, especially with shorter settings
The 14-period default can also be changed. Every RSI reading tells you how strong recent momentum has been relative to that lookback. Treat it as a gauge of conditions, not an instruction.
You can see the same logic outside equities: RSI readings near 29 on a currency pair signal extended selling, but you still need trend structure and support levels before treating that number as a reversal trigger.
When big ASX news breaks, our subscribers know first
Why a reading of 70 or 30 is not a trade signal
Once you know what the number measures, the buy-at-30, sell-at-70 rule starts to look shaky. An overbought reading tells you upward momentum has been unusually strong. It may point to exhaustion, but it does not guarantee a decline, and assets can stay stretched for long periods.
Overbought means momentum is unusually strong, not that price must now reverse.
The same persistence shows up in currency markets, where overbought readings on the dollar index lasted for weeks in 2014-2015 and 2022 because rate differentials, not momentum alone, were driving the move.
Trend changes what the number means
RSI’s normal range shifts with the trend. StockCharts puts it at roughly 40-80 in uptrends and 20-60 in downtrends. Fidelity cites 40-90 in bull markets and 10-60 in bear markets.
So a reading of 72 in a strong bull market may simply be normal. A reading of 32 in a bear market may be the bounce, not the bottom.
There are two structural limits as well. The thresholds are not adjusted for volatility, so a volatile stock may hit 70 often while a stable one rarely does. RSI also lags because it averages past moves, so part of a reversal may already have happened by the time the line crosses back.
Where the S&P 500 proved the point
Recent index history shows the rule both failing and working.
| S&P 500 episode | RSI event | What followed | Lesson |
|---|---|---|---|
| Chart example (Verified Investing) | First break above 70 | Short unprofitable after six days; RSI reached about 78, price 4-5% above entry | Overbought can keep running |
| Chart example (Verified Investing) | RSI near 27-28 after a ~5% pullback | Strong rally | Oversold can work in context |
| March 2025 | RSI near 28 | Recovery came later, not at the exact low | Flags momentum, not timing |
| March-April 2026 | RSI from about 28 to above 70 | Rally continued through overbought | 70 did not end the move |
| 2025 to March 2026 | About four months between 40 and 60 | Oversold as support near 6,800 broke | Range and support matter most |
The last row is worth noticing. According to StockCharts, the shift into a neutral range and the break of support said more than any single crossing. The range RSI occupies, and how it interacts with support and resistance, often matter more than a touch of 70 or 30.
How bullish and bearish divergence flag possible reversals
If threshold readings are unreliable, divergence offers a different approach. The logic is simple: price reaches a new extreme, but momentum does not follow. When the gain-loss balance inside RSI stops confirming price, the move may be running out of fuel.
The four divergence patterns
- Regular bullish: price makes a lower low while RSI makes a higher low.
- Regular bearish: price makes a higher high while RSI makes a lower high.
- Hidden bullish: price makes a higher low while RSI makes a lower low.
- Hidden bearish: price makes a lower high while RSI makes a higher high.
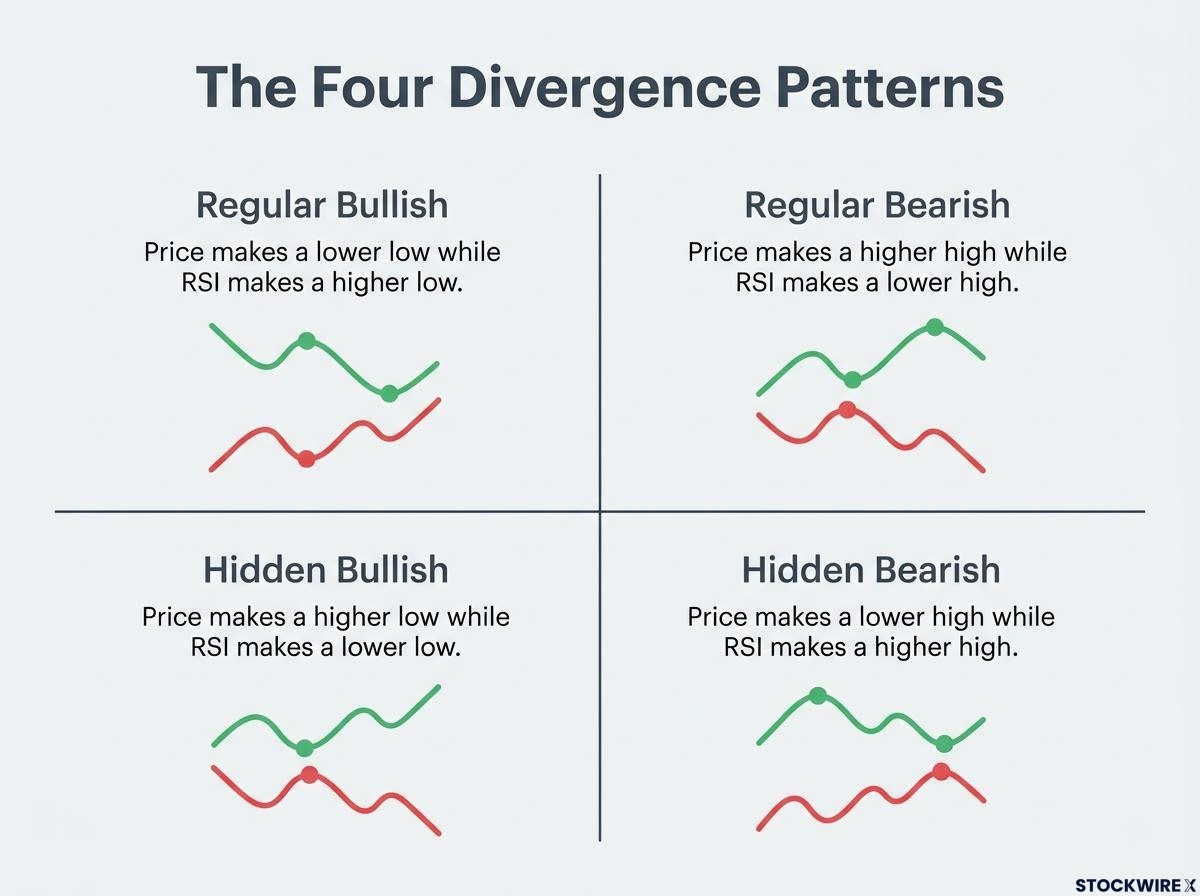
Regular divergence is usually treated as a possible reversal warning. Charles Schwab describes hidden divergence differently, as a clue that the existing trend may continue.
Three chart examples
Lawton Ho of Verified Investing chose three cases across large, mid and small caps. The figures are his stated chart values, with no precise dates. Treat them as illustrations, not statistical proof.
| Stock | Type | Price move | RSI move | Outcome |
|---|---|---|---|---|
| Charter Communications | Bullish | Down about 20% (about 159 to 126) | About 23.5 to 26-27 | Up 17%, pullback, then up 33% |
| BigBear.ai (BBAI) | Bullish | Down about 7% from near 2.79 | About 25.65 to 26 | Up about 33% |
| AMD | Bearish | Up about 6% to around 660, new highs | 74 to 72 | Down 19% |
Charter was worth about $19 billion at the time. Even after a 20% slide, its RSI edged higher, a sign that selling pressure was weakening. BBAI followed the same pattern on a smaller scale.
AMD is the most instructive case. Price set all-time highs while RSI slipped, and up-sloping trendlines broke at the same time. That second signal gave the warning extra weight.
Divergence tells you momentum is fading before price shows it. Use it as a prompt to watch closely, not as a command to act.
What the evidence says about RSI reliability
Three examples that worked are encouraging, but they were selected after the fact. Broader backtests give you a more sober view, and the published evidence is mixed. Results depend on the market, timeframe, trading costs and entry rules.
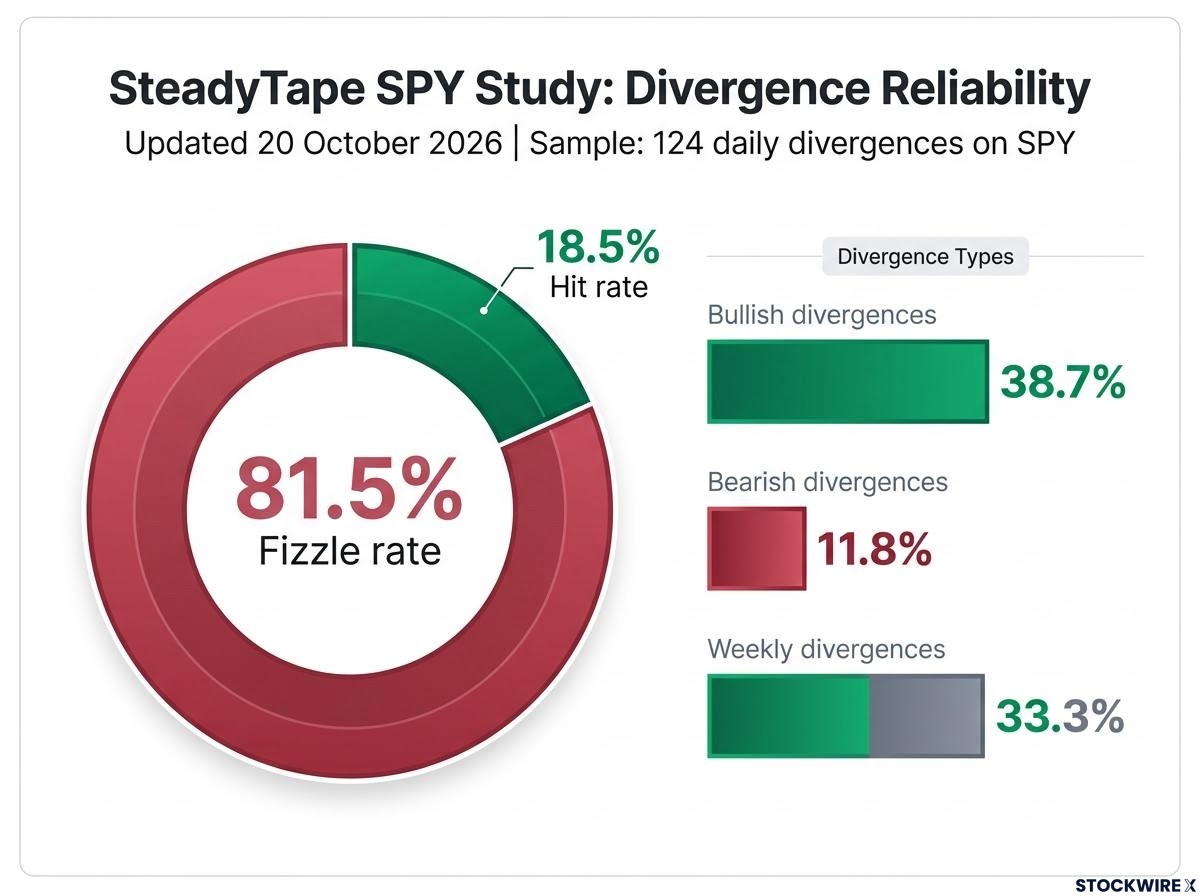
SteadyTape’s SPY study, updated on 20 October 2026, gives the clearest view of divergence on a broad sample:
124 daily divergences on SPY: an 18.5% hit rate and an 81.5% fizzle rate.
Bullish divergences performed better at 38.7%, compared with 11.8% for bearish ones. Weekly divergences reached 33.3%. Moving to a longer timeframe seemed to filter out some noise.
| Study | Market or sample | Key result |
|---|---|---|
| Kase Company | RSI vs MACD divergences | RSI reached the study’s average stop about 18% of the time vs about 16% for MACD |
| Saksangsopa et al., 2024 | Stock Exchange of Thailand, 10 years | 70/30 averaged 22.85% cumulative vs 18.28% for 60/40; 60/40 had lower risk and drawdown |
| Damascus Securities Exchange, 2023 | 30/70 and 20/80 boundaries | RSI not reliable as a stand-alone tool |
| Jupiter Group backtest | 100 U.S. equities, daily 30/70 | 79.4% win rate; one study’s output, not a universal statistic |
Backtests carry their own risks. Rules can be curve-fitted to past data, and testing many settings can make luck look meaningful. Transaction costs can also wipe out a small edge. Divergence tends to fail in a few familiar ways:
- Strong trends: price keeps moving in the original direction
- Inconsistent pivots: highs and lows are chosen to fit the pattern
- News shocks: earnings, macro data or price gaps overwhelm the setup
- Hindsight: the pattern only looks obvious after the reversal
A pattern you can see in hindsight is easier to find than to trade. Set your expectations accordingly. The evidence supports divergence as a warning or setup, not as a complete entry signal.
Readers interested in how divergence performs when paired with structure can use our deep-dive into RSI divergence at confluence levels, which examines a 2024 academic study of Nifty 50 equities.
A practical way to combine RSI with other signals
If RSI works best as one input, the next question is what else belongs in the process. Each tool answers a different question.
RSI answers a momentum question. Price structure, volume, moving averages and MACD answer different ones.
Charles Schwab suggests pairing RSI with moving averages, trading volume, MACD or other momentum indicators, and the Average Directional Index (ADX), which measures trend strength.
Your checklist works best when each step draws on independent analytical families such as trend, volume, momentum and price structure, since estimated odds of a move rise from roughly 60% with one factor to about 85% with three.
A six-step checklist
- Read the range. Note whether RSI is holding a bullish, neutral or bearish band.
- Confirm the trend. Check moving averages and whether price is making higher highs or lower lows.
- Mark support and resistance. Identify the horizontal levels and trendlines price is approaching.
- Check for divergence. Look for regular or hidden divergence at those levels.
- Wait for confirmation. Look for a trendline break, as in the AMD case, a candlestick signal, volume support, or an RSI failure swing. A failure swing is when RSI fails to make a new extreme and then breaks its previous swing point.
- Define risk. Set your stop and exit before you enter.
Some readings tell you to do nothing. Moneycontrol reported daily RSI of 53.61 on 22 October and 45.34 on 23 October, both neutral. That is useful information too, because a neutral reading gives you no momentum edge.
Schwab described RSI as approaching oversold on 19 October 2026, similar to the July pullback. It framed this as stretched momentum, not a guaranteed bottom.
Common mistakes to avoid
Avoid fading every reading above 70 or below 30, especially in a strong trend. Do not act on divergence before price structure confirms it, and do not ignore what neutral readings are telling you. The most expensive mistake is entering without an exit plan.
Using RSI as a gauge rather than a trigger
RSI describes momentum conditions. A reading of 70 or 30 is a prompt to investigate, not an order to buy or sell.
Start with the range RSI is holding, because that frames the trend. Divergence can then warn you early, but the backtests show it fails often. Confirmation from price structure, volume or a failure swing is what turns a warning into a decision you can defend.
This week, pick one chart. Mark the RSI range, any divergence, and the nearest support or resistance level. Then write down what confirmation would change your view, and wait for price to provide it.
This article is for informational purposes only and should not be considered financial advice. Investors should conduct their own research and consult with financial professionals before making investment decisions. Past performance does not guarantee future results, and backtested results are subject to market conditions and various risk factors.