The eurozone economy is still growing. Its private sector posted a composite reading of 51.9 this month, comfortably on the expansion side of the line. Yet the euro has now fallen for three straight sessions against the dollar, leaving you with an obvious question: how does a growing economy end up with a weaker currency?
The answer matters for any EUR/USD forecast you read this week. The pair traded near 1.1200 on Friday 23 October 2026, after preliminary October business surveys disappointed, France slipped back into contraction and markets priced roughly 76-80% odds of another US Federal Reserve hike by December.
The timing sharpens the stakes. The Fed’s next decision lands on Wednesday, and the gap between US and European rate expectations is what sets the tone for the pair.
Here you will learn to read a business survey release yourself, explain growth and policy divergence in plain terms, and spot the signals worth watching before the Fed speaks.
What did the October data actually show, and why did the euro flinch?
Start with the part most headlines skipped. The eurozone is not in recession, and the October surveys did not say it was.
A Purchasing Managers’ Index (PMI) is a monthly survey of company executives, and any reading above 50 signals expansion. The eurozone composite, which blends services and manufacturing, came in at 51.9. That is a four-month low, down from 53.1 in September, but S&P Global says it is still consistent with quarterly GDP growth of around 0.3%.
The problem was the gap, not the level.
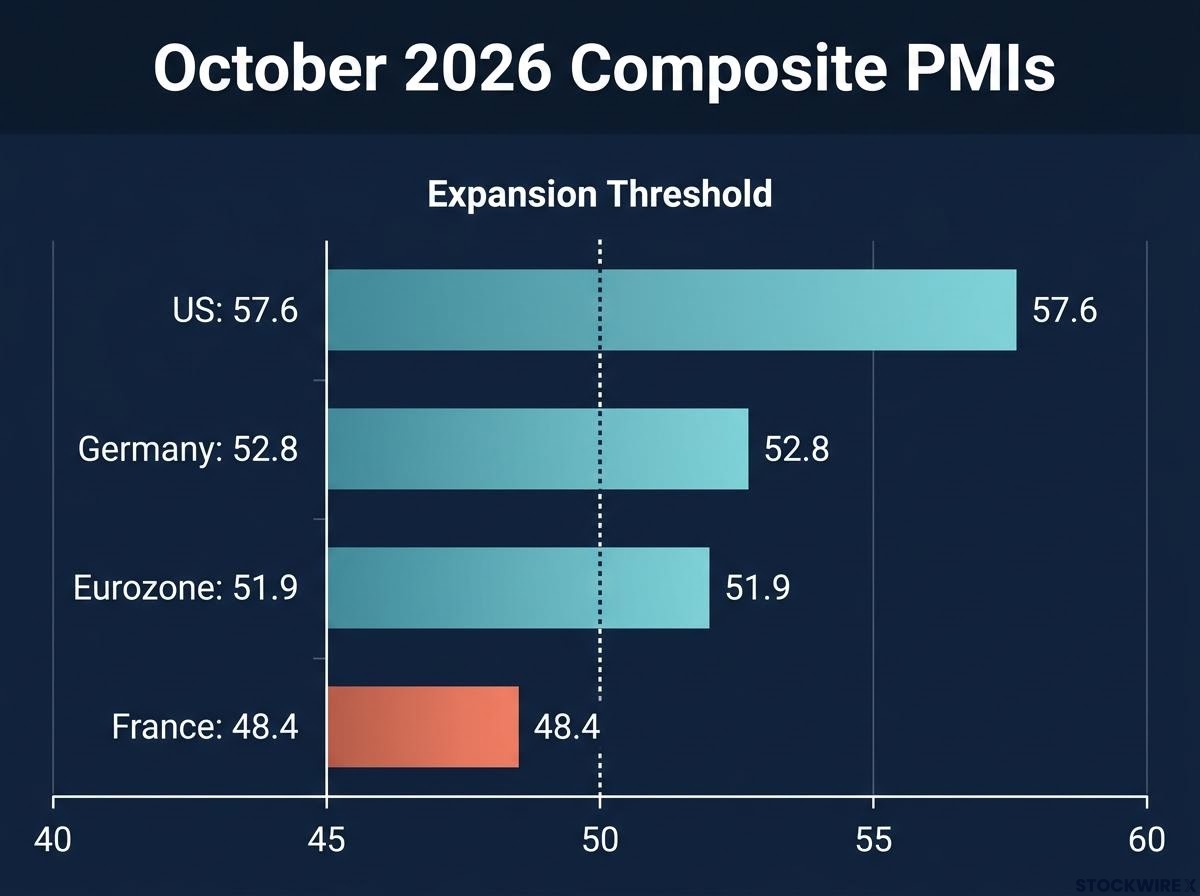
| Region/index | Oct 2026 | Sept 2026 | Direction |
|---|---|---|---|
| Eurozone composite | 51.9 | 53.1 | Slower expansion |
| Germany composite | 52.8 | 53.8 | Slower expansion |
| France composite | 48.4 | 51.1 | Back in contraction |
| US composite | 57.6 | 58.4 | Eased, still strong |
The three numbers that moved the pair Eurozone composite: 51.9. Reuters poll expectation: 52.7. US composite: 57.6.
Currencies trade on surprise and on relative strength. The eurozone missed forecasts while the US kept running hot, with US manufacturing at 56.0, its highest in 53 months. So a number above 50 still landed as bad news for the euro, because it widened the growth gap you were already watching.
Germany was not the culprit. German manufacturing actually improved to 54.2. S&P Global’s chief economist Chris Williamson pointed instead to the renewed French downturn and rising input costs, with energy and oil keeping price pressure well above the European Central Bank’s (ECB) 2% target.
Why France is the swing factor
France’s composite dropped to 48.4, with services at 48.4 and manufacturing at 49.3. French firms told surveyors that political uncertainty and anxiety about the 2027 presidential election were hitting activity.
Bond markets had already flagged the strain. The French 10-year yield reached 5.14%, its highest since July 2002, and the gap over German debt is the widest in 15 years. Reuters reported the 2027 budget targets a deficit of 5% of GDP against 5.4% in 2026, yet parliament has stripped out some savings measures.
The French bond spread has been the sharpest market signal of the strain, and the ECB’s Transmission Protection Instrument is the only realistic backstop, with eligibility tied to fiscal compliance that Paris has not yet demonstrated.
Moody’s kept France at Aa3, according to the FT, on the assumption a deficit-reducing budget passes. That removes an immediate downgrade trigger, but it means the French story now adds a risk premium (extra return investors demand for holding riskier assets) on top of the growth miss.
When big ASX news breaks, our subscribers know first
How do PMIs move currencies? A plain-English guide
A survey of purchasing managers sounds a long way from the exchange rate on your screen. The connection runs through interest rates.
PMIs ask companies about activity, new orders, employment, prices and confidence. Because they arrive early in the month, before official data, markets treat them as an early read on where the economy is heading. What moves prices is the result compared with the consensus forecast.
When a PMI disappoints, the effect usually travels in five steps:
- Traders lower their expectations for future growth.
- They scale back bets on rate hikes, or raise bets on cuts.
- Government bond yields and swap rates (the fixed rates traders pay to swap interest payments) fall.
- The yield differential, meaning the gap between two countries’ rates, shifts against that currency.
- Money flows toward the currency offering a better expected risk-adjusted return.
A strong PMI runs the same chain in reverse. The Federal Reserve Bank of St. Louis notes that exchange rates broadly follow interest-rate differentials, and a wider US advantage over the euro area generally lines up with a stronger dollar.
So treat any single print as a prompt, not a verdict. The useful question is what it does to rate expectations.
Then ask how long the effect might last. Two readings of October compete:
- Cyclical view: temporary French unrest, energy costs and a single weak month. A French rebound could reverse the move.
- Structural view: persistent fiscal instability, high debt, political fragmentation and weaker European productivity create a lasting premium one good month cannot fix.
Remember too that surveys are opinions, not hard data. If production or retail sales hold up, the PMIs may have overstated the weakness.
The oil complication
Energy pulls the euro in two directions at once. Higher oil lifts euro-area inflation, which could push the ECB to hold or raise rates, supporting the euro through higher yields.
The same oil shock squeezes household incomes and weakens demand. KBC economists describe this as a dilemma for the ECB, while Elias Haddad at Brown Brothers Harriman (BBH) argues above-target inflation still leaves the bank room to tighten.
Why policy divergence is the real driver, and how it has played out before
Now connect the surveys to the Fed. The US policy rate sits at 3.75%-4.00% after a 25 basis point hike in September (a basis point is one hundredth of a percentage point). Markets see roughly 84-89% odds of no change on Wednesday, but about 76-80% odds of at least one more hike by December, with one breakdown showing 45% for one and 31% for two.
Weaker European data makes traders reluctant to price aggressive ECB tightening. BNP Paribas strategists expect the short-term rate gap to keep favouring the dollar. History shows why that expectation matters more than the hikes themselves.
Central bank divergence works mainly through forward expectations, so the dollar can rally well before a single extra hike is delivered, which is why the shape of the expected rate path matters more than any one decision.
| Episode | What happened | Lesson |
|---|---|---|
| 2014-2015 | Fed moved toward normalising policy as the ECB turned to quantitative easing (QE) | The dollar rallied well before the first actual hike |
| 2022 parity | Fed tightened fast, ECB lagged, energy shock hit Europe; EUR/USD broke parity in July 2022 for the first time in about 20 years | Divergence bites hardest alongside a lopsided growth shock |
| Late 2022 | ECB’s 75 bp hike in October; pair recovered to end the year near 1.07 | Once the expected gap peaks, the euro can rebound |
October 2026 shares the mechanism but not yet the scale. The eurozone is still expanding, and the ECB may face its own energy-driven pressure to act.
For you, the takeaway is that the dollar’s edge depends on the expected gap continuing to widen. Any sign it has peaked is the real threat to the trend.
What could push the euro back up
BBH’s Haddad warns French fiscal stress could pull the pair toward 1.1000. The strongest rebound case would need several pieces to fall into place:
- A Fed that holds off in December
- Softer US inflation
- Calmer French politics
- A credible French budget
- An ECB still willing to tighten on energy inflation
One subtler risk for dollar bulls: if the Fed delivers one hike and signals a long pause, US yields may already be priced and the dollar could soften. Crowded positioning could make that reversal quick, and Moody’s decision has already taken one bearish catalyst off the table.
What to watch before the Fed decision, and where the charts agree
With the mechanism in hand, you can build a short checklist for the week ahead:
- Wednesday’s statement from the Federal Open Market Committee (FOMC). There are no new economic projections, so the wording carries extra weight.
- Chair Kevin Warsh’s press conference. Several Fed officials have signalled no rush to hike, so watch whether he leans toward or away from December.
- French budget news. Any further loss of savings measures could widen the bond spread again.
- Energy-driven inflation. Oil feeds both Fed hike pricing and the ECB’s dilemma.
Reading the one-hour chart
Treat these levels as indicative and check them against a live chart. The pair sat at 1.1203, below its 200-period simple moving average (SMA, the average closing price over that many periods) at 1.1214 and 100-period SMA at 1.1222.
The Relative Strength Index (RSI), a momentum gauge running from 0 to 100, read about 46. That signals soft momentum, a mildly bearish setup rather than an extreme one.
| Level type | Price | Note |
|---|---|---|
| Resistance | 1.1285 | Upper ceiling |
| Resistance | 1.1260 | Next hurdle above averages |
| Resistance | 1.1222 | 100-period SMA |
| Resistance | 1.1214 | 200-period SMA |
| Support | 1.1190 | Immediate intraday floor |
| Support | 1.1150 | Second support |
| Support | 1.1114 | Deeper support |
While price stays below the averages, those levels are expected to cap rebounds. A break above them on a softer Fed tone would challenge the bearish bias, while a hawkish signal makes a test of support more plausible. The chart confirms the fundamental story; it does not replace it.
Past performance does not guarantee future results. These statements are speculative and subject to change based on market developments.
What the slide changes, and what it does not settle
The week’s move has a clear explanation: a widening growth gap, expectations of further Fed tightening and a French risk premium. It has not settled the bigger question, because the eurozone is still expanding and several credible paths lead back up.
The same pattern appeared in September, when a hawkish Federal Reserve overrode the eurozone’s strongest composite PMI since April 2023 and pushed EUR/USD below its 200-day average despite supportive European data.
That gives you a practical filter. Judge any outlook on the pair by what it assumes about Fed and ECB rate expectations, not by one survey print.
Your decision points are now concrete. Wednesday’s statement and Warsh’s tone will show whether the expected policy gap is still widening. The French budget will test whether the risk premium hardens, and energy prices will decide how much room the ECB really has.
This article is for informational purposes only and should not be considered financial advice. Investors should conduct their own research and consult with financial professionals before making investment decisions.