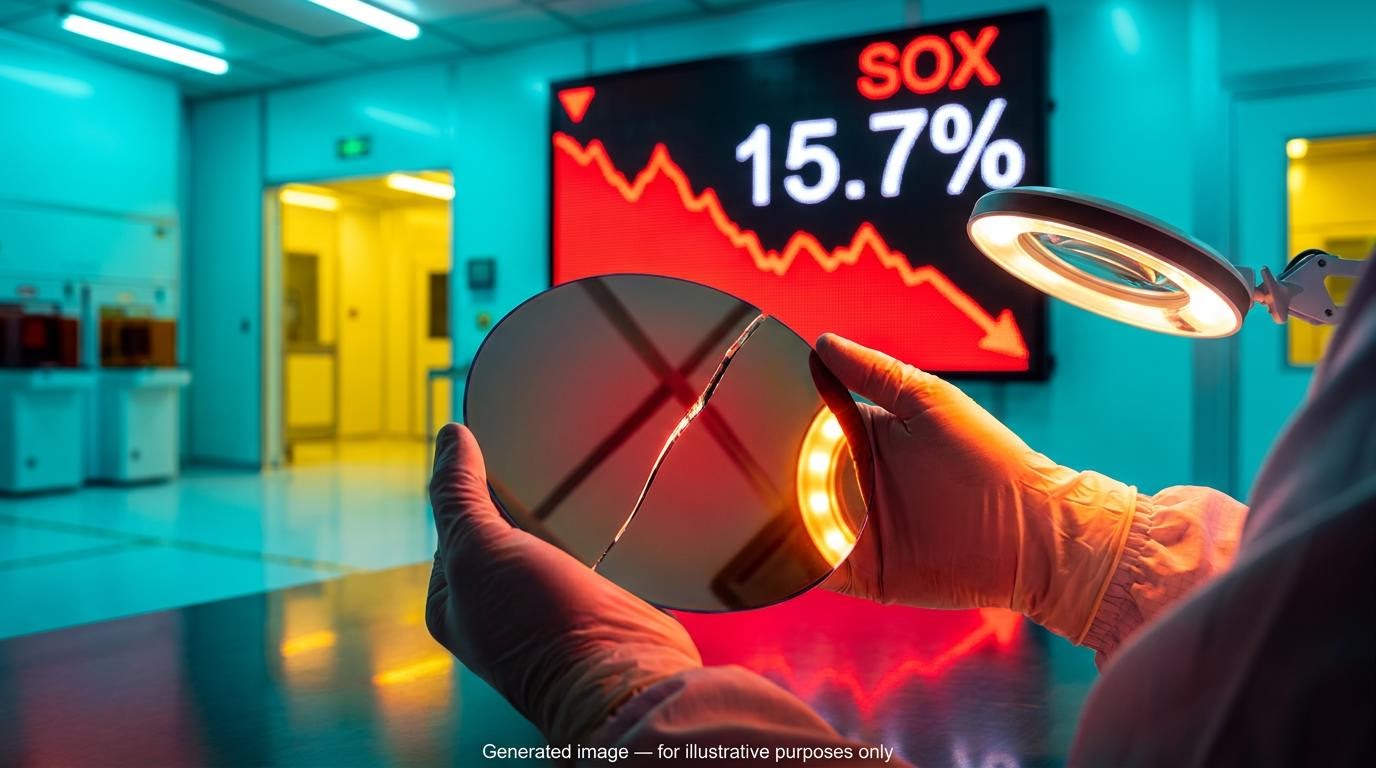
The Philadelphia Semiconductor Index (SOX) fell about 15.7% across eight straight sessions through 17 October. That was its longest losing streak since October 2008, and it erased roughly $2 trillion in market value. The semiconductor stocks decline also arrived alongside good news: talk of an Anthropic IPO and fresh OpenAI funding did nothing to hold the trend.
The selling has spread beyond chipmakers to CoreWeave, Cerebras, Bloom Energy and Western Digital. The question now is whether this is a routine cyclical correction or an early warning about how the AI build-out is financed.
Here is a way to separate cyclical noise from structural risk, and to read broken support levels without trusting them more than they deserve.
What the semiconductor stocks decline actually looks like across the AI trade
Index level: SOX and SMH
The scale depends on where you start counting. Reuters measured the eight-session slide at about 15.7%, while Bloomberg put it near 16%. Some chart-based commentary cited a fall of “about 20%”, but that figure covered a looser “few weeks” window. The streak itself is the cleaner measure.
The streak in numbers Longest SOX losing run since October 2008, with about $2 trillion in semiconductor value erased (Reuters).
Reuters linked the slide to hotter inflation, rising expectations of Federal Reserve rate hikes and the cost of the AI build-out. Chinese memory-chip competition and stretched valuations added pressure. The index rebounded on 19 October as bond yields and crude oil prices eased.
Two gaps remain. Chart commentary reported that the VanEck Semiconductor ETF (SMH) broke support near 536, but no preferred source has confirmed that level, and neither SOX closing levels nor an SMH drawdown figure appeared in available reporting.
Single-stock level: where the losses are deepest
| Stock | Recent move | Window | Notable fundamental | Note on source conflict |
|---|---|---|---|---|
| SOX | -15.7% to -16% | Eight sessions to 17 Oct | Rebounded 19 Oct | Source’s ~20% used a wider window |
| CoreWeave | -25%+ | Week to 16 Oct | $104.2B backlog end Q2 | Source cites ~70% below June 2025 peak |
| Cerebras | -48.7% | Month to 22 Oct | Closed $108.94 | Source’s ~70% is peak-to-trough |
| Bloom Energy | -8.76% | 22 Oct | EPS $0.94 vs $0.69 expected | None |
| Western Digital | -6.43% | 22 Oct | Q2 revenue guide $5.0B-$5.2B | Source called results weak |
CoreWeave lost more than 11% on 16 October alone. The more revealing cases are Bloom Energy and Western Digital. Bloom reported revenue of $1.24 billion against $1.06 billion expected and lifted FY2026 revenue guidance to $4.4-$4.6 billion, yet the shares still fell. Western Digital’s above-consensus guidance briefly lifted the stock after hours, then the gain was wiped out.
When beats and raised guidance cannot hold a share price up, the market is repricing risk and rates rather than reacting to earnings. You need to weigh macro and financing conditions alongside company results.
When big ASX news breaks, our subscribers know first
How interdependence among AI firms can magnify risk
Where the risk concentrates
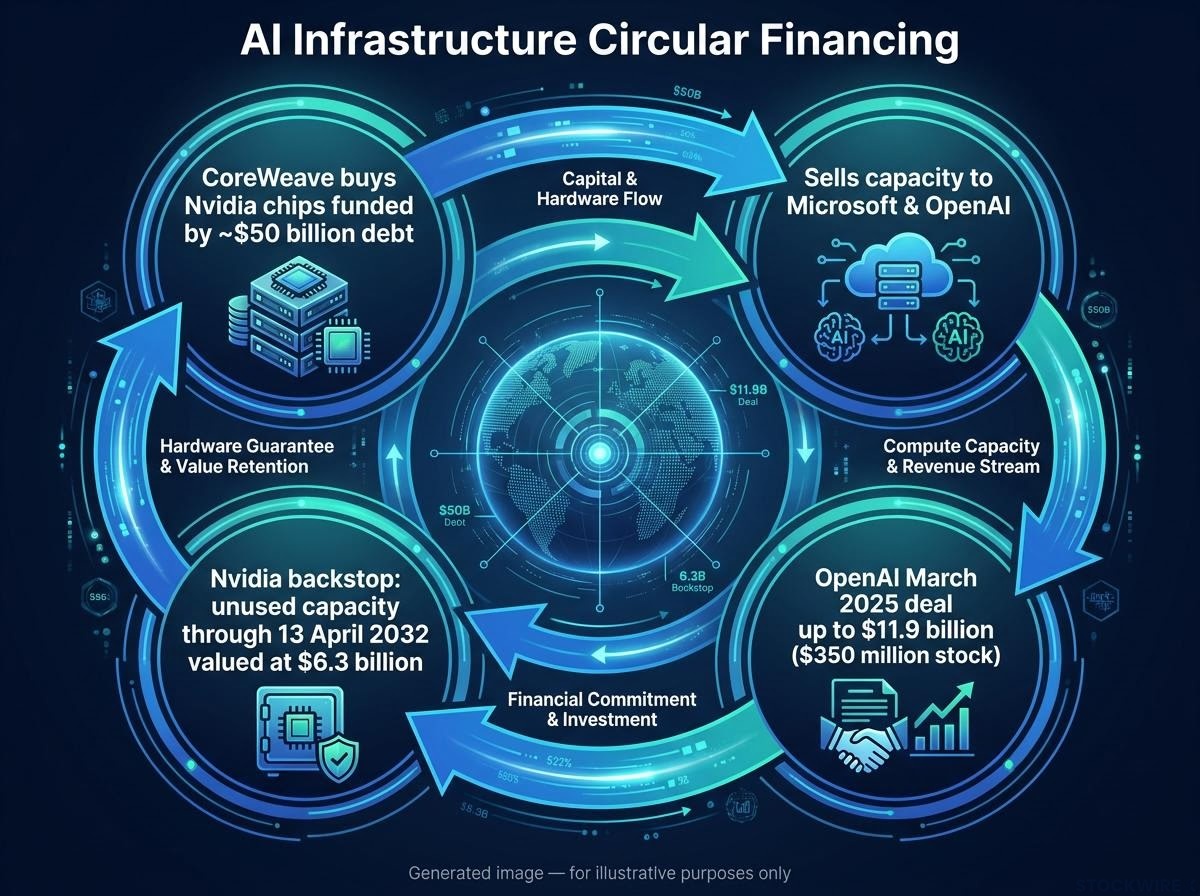
CoreWeave shows how one balance sheet can tie into many others. Brian Reynolds of Reynolds Strategy described the circularity as a sequence:
- CoreWeave buys Nvidia chips to build data-centre capacity.
- It funds those purchases with debt, now about $50 billion (Reuters/LSEG).
- It sells that capacity to large AI customers, including Microsoft and OpenAI, which also became an investor through $350 million of CoreWeave stock under a March 2025 deal worth up to $11.9 billion.
- Nvidia agreed to buy unused capacity through 13 April 2032, initially valued at $6.3 billion.
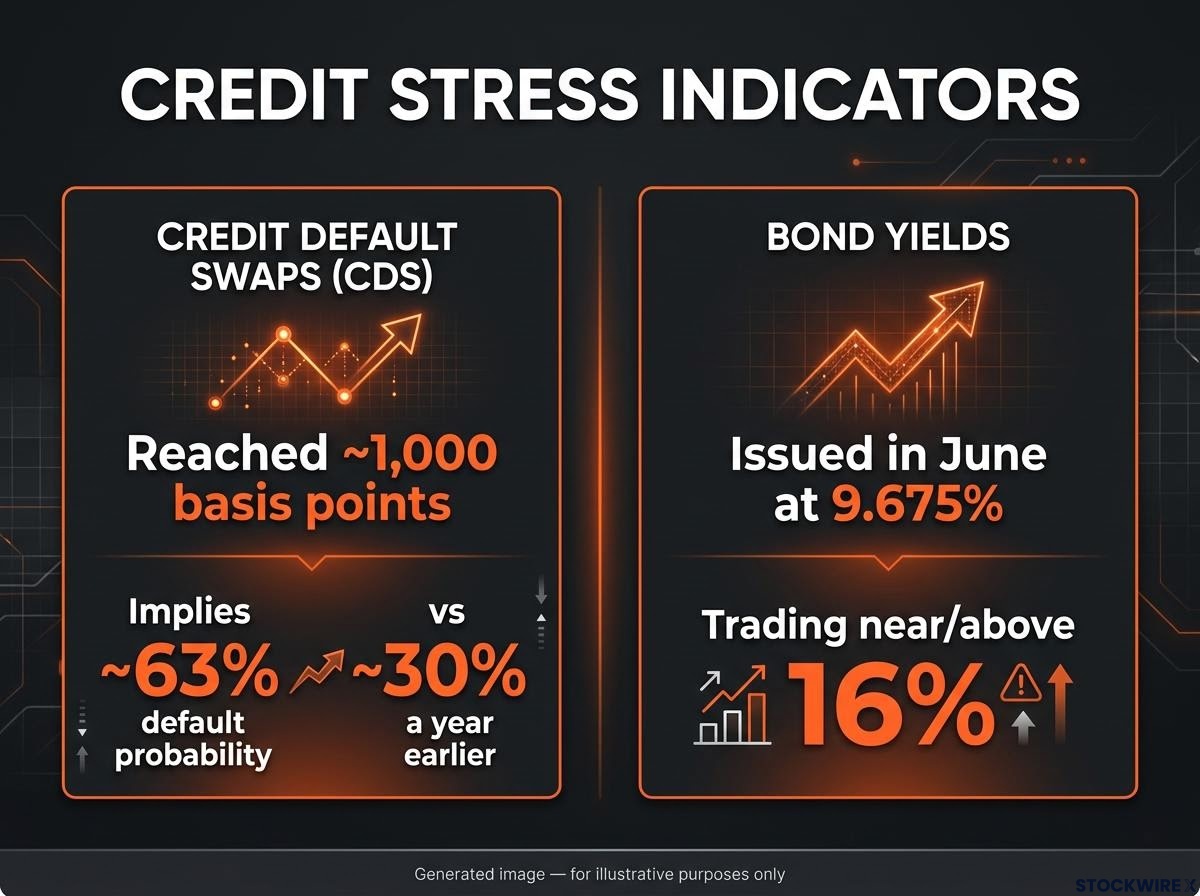
The same few names act as supplier, investor, customer and backstop. Credit markets are pricing that exposure. CoreWeave’s five-year credit default swaps (insurance contracts that pay out if a borrower defaults) reached about 1,000 basis points. That implies roughly a 63% five-year default probability, compared with about 30% a year earlier. Bonds issued in June at a 9.675% yield were later reported trading near or above 16%.
CoreWeave’s bond stress showed up in credit markets before equity screens, with the 2032 notes trading well below par while the hot inflation print pushed Treasury yields higher and lifted funding costs across AI infrastructure.
The International Monetary Fund’s 13 October Global Financial Stability Report reportedly linked about $950 billion of AI-related financing to about $1.4 trillion of future spending on the funders’ own chips and cloud services.
The IMF’s label The Fund reportedly called this pattern “wrong-way risk”, meaning exposure that grows as the borrower’s ability to pay weakens.
James Athey of Marlborough adds a second layer: common ownership. If utilisation drops, asset values fall, customers struggle to pay and investors holding the same names may be forced to sell together.
The case that it is contained
Gary Tan of Allspring accepts that the links are real but argues that strong balance sheets, cash flows and credit quality reduce near-term risk. Jan Frederik Slijkerman of ING says the positions of Nvidia, Microsoft, Amazon and Alphabet make a systemic event less likely. CoreWeave management says its backlog, plus more than $25 billion of new commitments, covers its debt obligations.
Both views can be true at once. Cash-rich hyperscalers can absorb lower returns, but leveraged neoclouds depend on utilisation and access to refinancing. If you hold AI exposure, the question is not only whether demand is real but who carries the debt against it.
Is this a 2008-style unwind, a 2000-style bubble, or a normal chip correction?
The 2008 comparison captures something real: the longest SOX streak since that year, credit repricing, and warning signs that took more than a year to build. It breaks down on location. Reporting does not show the banking system as the centre of stress.
The 2000 analogy concerns valuations and expectations. No Morningstar or Goldman Sachs analysis comparing this episode to 2000 appeared in available research. The comparison also weakens because, unlike in 2000, AI demand is producing substantial current revenue, as Bloom’s and Western Digital’s guidance show.
| Scenario | What it looks like | Evidence for | Evidence against |
|---|---|---|---|
| Cyclical correction | Sharp fall, recovery if demand holds | Rate-hike fears, valuation compression | Credit stress at CoreWeave |
| 2000-style valuation unwind | Prolonged derating of expectations | Stretched valuations | Real, growing current revenue |
| 2008-style credit stress | Leverage forcing correlated selling | CDS near 1,000bp, circular financing | Banks not shown as locus of stress |
The dividing test is simple. If debt-funded capacity is expanding faster than utilisation and cash flow, you are watching deleveraging, not a chip-cycle drawdown. Signals that would tip the balance toward a structural unwind include:
- Further widening in CoreWeave credit spreads or bond yields
- Backlog failing to convert into revenue
- Evidence that financing deals pulled demand forward
- Customer concentration becoming a payment problem
Current reporting supports neither a prolonged 2000-style unwind nor a 2008-style systemic crisis. It does show a higher risk premium for leveraged AI infrastructure. The reading for you is a sharp cyclical correction with a credible pocket of structural risk, which argues for scrutinising leveraged exposure rather than judging the whole AI trade as safe or doomed.
How to read support breaks, and the bullish case that complicates them
Reading the chart without over-reading it
A support level is a price where buyers have repeatedly stepped in. A break below it suggests those buyers are no longer absorbing selling. A gap is a jump between one session’s close and the next session’s open, and a trend line or channel break means price has left a pattern it had followed.
Current examples include the reported SMH level near 536, BTIG’s key support near $490 for the iShares Semiconductor ETF (SOXX), and SOX sitting at the level last tested during the March Iran-war sell-off. Before reacting, ask:
- Did price close below support, or only breach it intraday?
- Was volume heavy?
- Was breadth weak across the sector?
- Are credit-sensitive assets falling too?
Breaks can fail. A false breakdown, often called a bear trap, can spark a sharp relief rally, as the 19 October rebound showed while financing risks stayed unresolved. A bounce can also be a throwback, where old support becomes resistance. Gap fills describe price, not fundamentals, so they do not prove a bottom. The Invesco QQQ Trust sits near three-month lows; a close above Wednesday’s gap would weaken the bearish case.
A support break tells you buyers have stepped back, not why. Treat it as a prompt to check fundamentals and financing.
For readers wanting to judge support zones more rigorously, our dedicated guide to reading technical levels shows how stacking independent structural factors such as unfilled gaps separates credible levels from noise.
What the bulls can point to
- Rubrik: rose from about $45 to about $130 over five to six months; the recent catalyst was not identified in research.
- Intel: upgraded by JPMorgan on agentic-AI demand and tight advanced-chip supply.
- Hyperscalers: strong balance sheets and cash flows.
- Bloom Energy and Western Digital: beats and guidance pointing to real demand.
- CoreWeave: management’s claim that backlog covers debt.
Chip stocks have historically fallen hard on rate and growth shifts, then recovered when end demand held. One caution on optimism: chart commentators have suggested Nvidia’s chief executive has an incentive to promote bullish AI messaging, which is opinion rather than evidence. Charts cannot judge demand, utilisation or debt service, and they are weakest when macro news moves fast.
What the semiconductor stocks decline changes, and what it does not
The evidence points to a sharp correction with a real structural-risk component, concentrated in leveraged AI infrastructure. It does not prove a systemic crisis.
Three variables will decide which way it tips:
- Credit signals, especially CoreWeave’s CDS pricing and bond yields
- Rate expectations after the next inflation data
- Utilisation and the conversion of backlog into revenue
Some gaps remain, including SOX closing levels, an SMH drawdown figure and CoreWeave’s latest share price. If credit stabilises while rates ease, the cyclical reading strengthens. If spreads keep widening, leveraged names deserve your closest scrutiny.
This article is for informational purposes only and should not be considered financial advice. Investors should conduct their own research and consult with financial professionals before making investment decisions. Past performance does not guarantee future results, and forward-looking statements are speculative and subject to change.