Most investors assume the price of holding long-dated government debt comes down to inflation and the central bank’s policy rate. That leaves out a quieter signal: the identity of the marginal buyer of Treasury duration is changing. The US Treasury term premium on the 10-year note sits at roughly 0.73% on the New York Fed’s ACM model (20 October 2026) and about 1.0% on the Fed Board’s Kim-Wright measure.
Alessia Berardi of the Amundi Investment Institute argues that the system that recycled global savings into Treasuries is eroding. Her case rests on a cluster of mid-2026 policy moves from Japan, the US, the Netherlands and Norway that she says all point the same way.
If you hold sovereign bonds, the distinction matters. A cyclical premium fades when conditions calm. A structural one becomes the new floor for what duration costs.
Here is a framework for judging how much sovereign duration risk you are carrying, along with the single 2027 decision that will test whether this shift is real.
Why a premium set by who buys differs from one set by inflation expectations
A 10-year yield has several components. Part reflects where investors expect short-term rates to go, part reflects inflation and real-rate expectations, and the remainder is the term premium. The term premium is the extra return investors demand for locking money up in a long bond rather than rolling short ones.
Because the term premium is the residual after rate and inflation expectations are stripped out, it can widen even when the policy outlook is unchanged, which is why the same yield move can carry very different implications across the US, Japan, the UK and Australia.
That last piece can move on its own. Here is the mechanism:
- Official reserve managers buy for non-commercial reasons such as intervention capacity, liquidity and safety, often regardless of yield.
- When their buying slows, private investors must absorb more duration and compare Treasuries with credit, swaps, equities and other sovereign bonds.
- Price-sensitive buyers require a higher expected return, so prices fall until the extra supply clears.
- That compensation shows up as a higher term premium, concentrated at the long end.
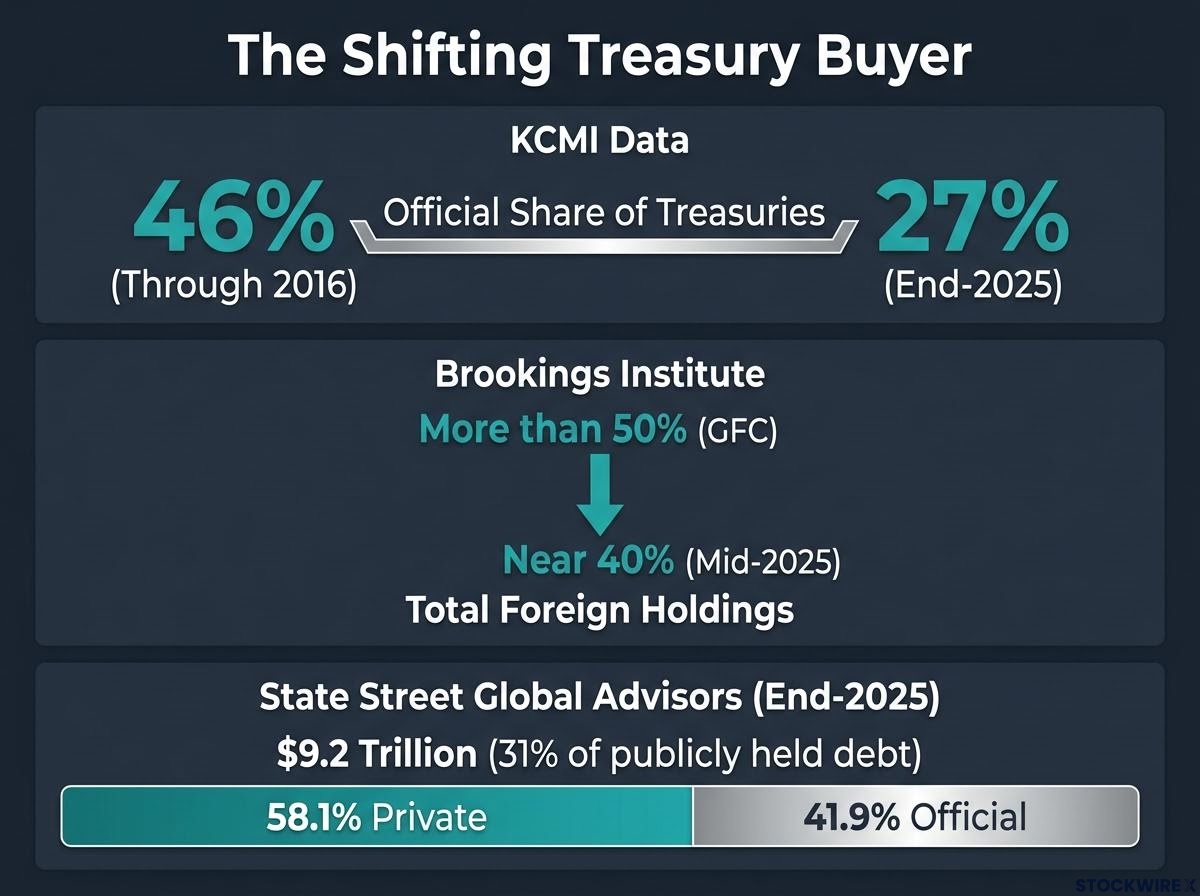
The shift is measurable. According to the Korea Capital Market Institute (KCMI), the official share of Treasuries fell from about 46% through 2016 to 27% at end-2025, while Fed quantitative tightening cut its holdings by about $1.7 trillion between 2022 and 2025. Brookings puts total foreign holdings near 40% by mid-2025, down from more than 50% around the global financial crisis, and the Bank for International Settlements (BIS) says leveraged, short-horizon funds increasingly act as marginal buyers.
KCMI finding Since H2 2022, a one-percentage-point rise in price-sensitive holdings relative to GDP has been associated with about 8.7 bp of added term premium. This is an association, not proven causation.
The read for you: if the marginal buyer now demands compensation, the premium is likely to stay higher and swing more with risk appetite and auction results than an inflation-only model would suggest.
How the premium is measured, and why estimates differ
No one directly observes a term premium. ACM is built mainly from the yield curve, while Kim-Wright adds survey data, so gaps of several tens of basis points are normal rather than contradictory.
| Measure | Latest figure | Date | Source |
|---|---|---|---|
| ACM 10-year term premium | 0.73% | 20 October 2026 | New York Fed (via MacroDataHub) |
| Kim-Wright 10-year term premium | About 1.0% | 16 October 2026 | Fed Board (via FRED) |
| 30-year estimate (unofficial) | About 1.30% | September 2026 | Lighthouse Canton house estimate; no official 30-year series exists |
Treat any single reading as a model-dependent estimate, not a fact.
When big ASX news breaks, our subscribers know first
What did Japan, the US, the Netherlands and Norway actually do in mid-2026?
Headlines bundled these moves into one “creditor retreat” story. Taken one at a time, they split into two very different groups.
Moves that shift the marginal buyer
Norges Bank Investment Management (NBIM) proposed cutting the government-bond share of its bond benchmark from 70% to 50% and replacing GDP country weights with market-value weights. Secondary estimates put the reduction in Treasury exposure at roughly $80 billion, and in global government bonds at about $106 billion. An expert review is expected by January 2027, with a final decision later that year.
The NBIM letter to the Ministry of Finance is the primary record of the proposal, setting out the cut in the government bond subindex from 70% to 50% and the move to market-value weighting.
Japan is courting domestic buyers for its own debt. On 25 August 2026, Finance Minister Satsuki Katayama said the ministry was reviewing NISA eligibility (Japan’s tax-free savings wrapper) and other tax incentives for JGBs. The policy remains under review.
Moves that look bearish but are not
The joint yen intervention on 31 July 2026 was financed by the US Treasury selling euros, not Treasuries. Japan’s planned use of the Fed’s Foreign and International Monetary Authorities (FIMA) Repo Facility means borrowing dollars against Treasuries rather than selling them.
The Treasury tripled long-end buybacks from $2 billion to $6 billion, which improves liquidity without cutting borrowing needs. De Nederlandsche Bank moved about 86 tonnes of gold to London, lifting London’s share from 18.1% to 32.1%, a custody decision rather than a rejection of dollar assets.
| Move | Actor | What changed | Effect on Treasury demand |
|---|---|---|---|
| Benchmark proposal | NBIM | Government bonds 70% to 50% | Marginal-buyer change (pending 2027) |
| Domestic-investor push | Japan Finance Ministry | NISA and retail JGBs under review | Marginal-buyer change at the margin |
| Yen intervention | BoJ and US Treasury | Funded by euro sales | Neutral |
| FIMA plans | Japan | Borrow against Treasuries | Backstop |
| Long-end buybacks | US Treasury | $2 billion to $6 billion | Liquidity change |
| Gold repatriation | DNB | About 86 tonnes to London | Custody change |
Only two of these alter who buys Treasury duration over time. Weigh them accordingly rather than counting six equal sell signals.
Why do the 2013 and 2018 creditor-retreat stories matter, and what is different now?
If this sounds familiar, your scepticism is earned. In 2018 the Council on Foreign Relations found foreign ownership had fallen as a share of marketable Treasuries since 2013, yet holdings outside China and Japan were broadly stable.
Those earlier shifts had mundane explanations. China’s flows tracked exchange-rate policy and Japan’s tracked hedging costs, and ownership shares fell without any collapse in dollar demand.
Earlier retreat stories were explained by exchange-rate policy and hedging costs, but sanctions-driven foreign selling adds a policy-motivated channel, with official holders selling into stress rather than buying, which weakens the old safe-haven assumption.
Berardi’s counter is that this time the change sits in mandates and benchmarks, not trades.
Berardi’s framing Creditors are returning home to diversify while the debtor buys its own debt.
Foreign investors still held about $9.2 trillion, or 31% of publicly held federal debt, at end-2025, split 58.1% private and 41.9% official, according to State Street Global Advisors. The BIS calculates that the rise in the 10-year term premium after the late-June 2026 geopolitical shock made up roughly 40% of the 10-year yield’s increase. The institutions read this differently:
- Amundi sees structural erosion of global savings recycling.
- State Street sees official demand growing more slowly than supply rather than disappearing.
- US Treasury advisory material stresses that reserve status keeps the market resilient, while conceding fiscal worries can lift the premium.
The durable change, then, is supply outgrowing official demand, not a loss of reserve status. That argues for pricing in a higher premium, not abandoning Treasuries.
What else pushes the premium: rates, fiscal limits, inflation and growth
The buyer story would matter less if everything else were calm. It is not, and four pressures stack on top of it:
- Rates: Amundi’s expected policy path sits above market pricing, so if central banks tighten less than it expects, risk shifts into the premium.
- Fiscal primacy without fiscal room: high debt, high debt-service costs and high rates form what Berardi calls a toxic combination.
- Structural inflation: refining bottlenecks for critical minerals, contested shipping chokepoints and climate-driven food pressure make inflation surprises more frequent.
- Narrow growth: competition for capital produces uneven expansion concentrated in the same strategic sectors.
| Central bank | Current rate | Amundi expectation |
|---|---|---|
| Federal Reserve | 3.75%-4.00% (hiked 25 bp on 16 September 2026) | One more hike by end-2026, a second plausible, then hold through 2027 |
| ECB | About 2.65% | 50 bp more by end-2026 |
| Bank of England | 3.75% (sixth consecutive hold) | Elevated risk of another hike |
| Bank of Japan | Normalising | Moving toward 2% |
These pressures compound rather than offset. For your portfolio, more frequent inflation surprises plus thin fiscal space mean duration needs a bigger cushion, and real assets belong in the sovereign-risk conversation. These outlooks are forecasts and may change with market conditions.
What could limit the thesis, and what to watch next
The counterarguments are serious, though most protect only part of the curve.
| Counterargument | Why it limits the thesis | Limit on which part of the curve |
|---|---|---|
| Safe-haven and collateral role | Demand typically rises in stress | Whole curve, mainly in crises |
| FIMA and swap lines | Reduce forced Treasury sales | Whole curve, in dollar shortages |
| Stablecoin demand | New buyer of short-term Treasuries | Bills only |
| Domestic US buyers | Funds, banks and dealers absorb supply | Mixed |
| Buybacks | Ease liquidity premium | Long end, partially |
| Model uncertainty | Estimates differ materially | All maturities |
San Francisco Fed researchers found stablecoin issuers have added more short-term Treasuries since 2023 than Japan, the largest non-US official holder. That supports bills, not 10-30 year duration. NBIM also reallocates within fixed income rather than away from the dollar, and fiscal constraints can raise the premium whatever foreign buyers do.
As official demand slows, domestic commercial banks have become a larger source of marginal demand, helped by zero risk-weight treatment and liquidity rules, though their appetite depends on balance sheet capacity rather than reserve-management mandates.
The 2027 test
The Norges Bank decision is the observable that matters. If the cut to 50% survives the review due by January 2027, a large investor will have hard-coded lower sovereign demand into its mandate. A reversal would make this look like another faded retreat narrative.
The UK’s 2022 LDI episode, when leveraged pension funds dumped long gilts to meet collateral calls, showed that a marginal holder’s balance sheet can move long yields regardless of inflation. Treat the 2027 outcome as your trigger to revisit duration positioning.
A higher premium, not a vanished bid: how to hold sovereign duration from here
The evidence points to a structurally higher term premium driven by who owns the debt, not an irreversible foreign exit. Treasuries keep their depth and haven role; they simply now clear at a price set by investors who expect to be paid.
A practical framework for your duration exposure:
- Track the share of price-sensitive holders.
- Watch auction demand at the long end.
- Monitor fiscal signals and debt-service costs.
- Mark the Norges Bank outcome in 2027.
Every premium reading is a model estimate, so lean on direction rather than decimals. The thesis will be strengthened or weakened next year, and your positioning should stay flexible until then.
This article is for informational purposes only and should not be considered financial advice. Investors should conduct their own research and consult with financial professionals before making investment decisions. Past performance does not guarantee future results. Financial projections are subject to market conditions and various risk factors.