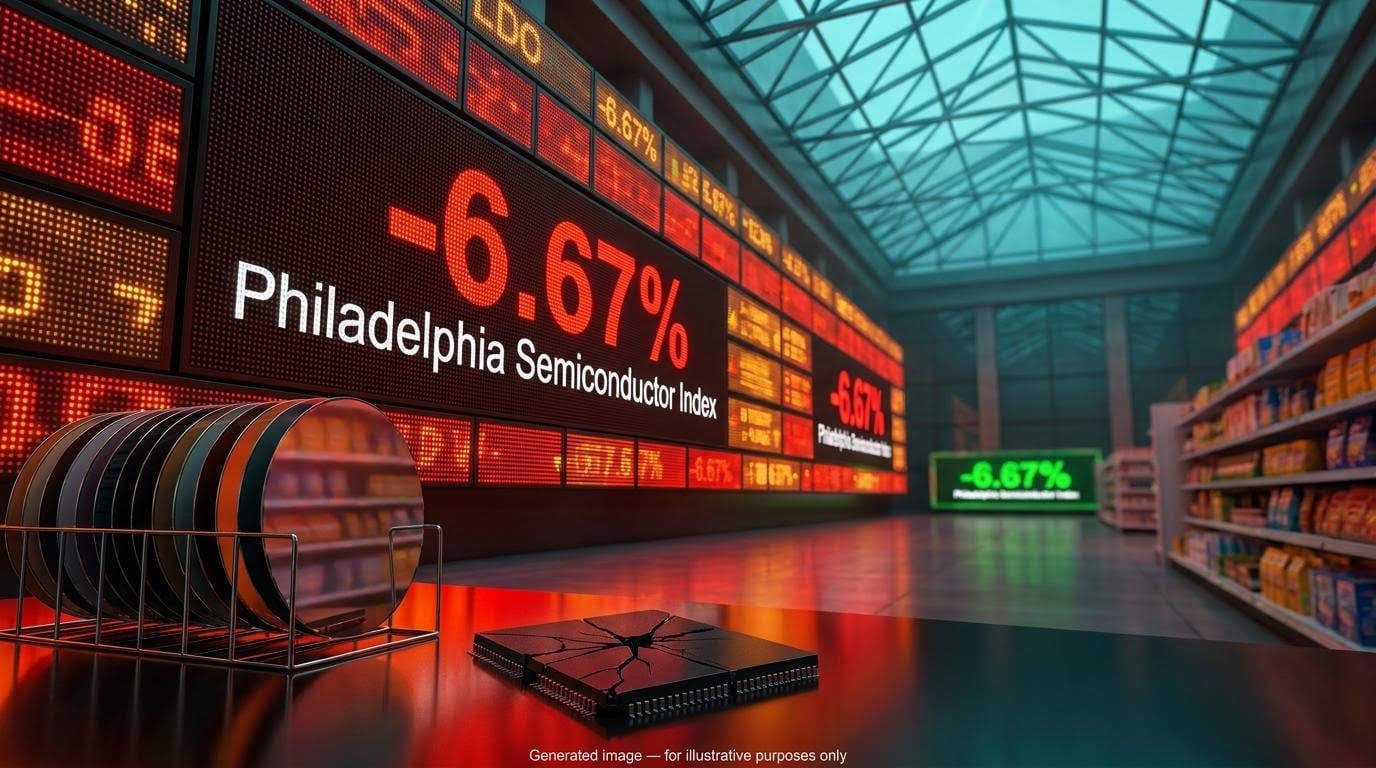
The Nasdaq had its worst day since June on Thursday, and chipmakers fell roughly 6-7%. Yet the Dow finished flat and consumer staples climbed more than 3%. That was not a broad market collapse. It was a targeted vote of doubt on AI spending, and the money that left technology went somewhere specific.
Thursday 22 October 2026 packed a lot into one session. Equities sold off, US Treasury yields posted their biggest one-day fall since August last year, Brent crude hit a five-month high, and gold and copper both slid.
These moves can look like four separate stories. They are not.
Here is how one question about AI payback links the equity rout, the bond rally and the oil spike, and what that chain of events means for your Friday ASX open.
Where the selloff hit hardest, and where it did not
The index closes show the damage was lopsided. The tech-heavy benchmark took the hit, the broad market absorbed some of it, and the blue-chip average barely moved.
| Index | Close | Move |
|---|---|---|
| Nasdaq Composite | 26,008.86 | -2.6% |
| S&P 500 | 7,663.43 | -1.2% |
| Dow Jones Industrial Average | 52,867.98 | Flat |
| Philadelphia Semiconductor Index | Approx. 6,400 | -6.7% or -6.3%* |
*Sources disagree on the chip index: the original report cited 6.7%, while Reuters-derived closing data showed 6.3%.
Six of 11 S&P 500 sectors fell, led by technology and communication services, each down about 3%. The individual moves show where the pressure concentrated:
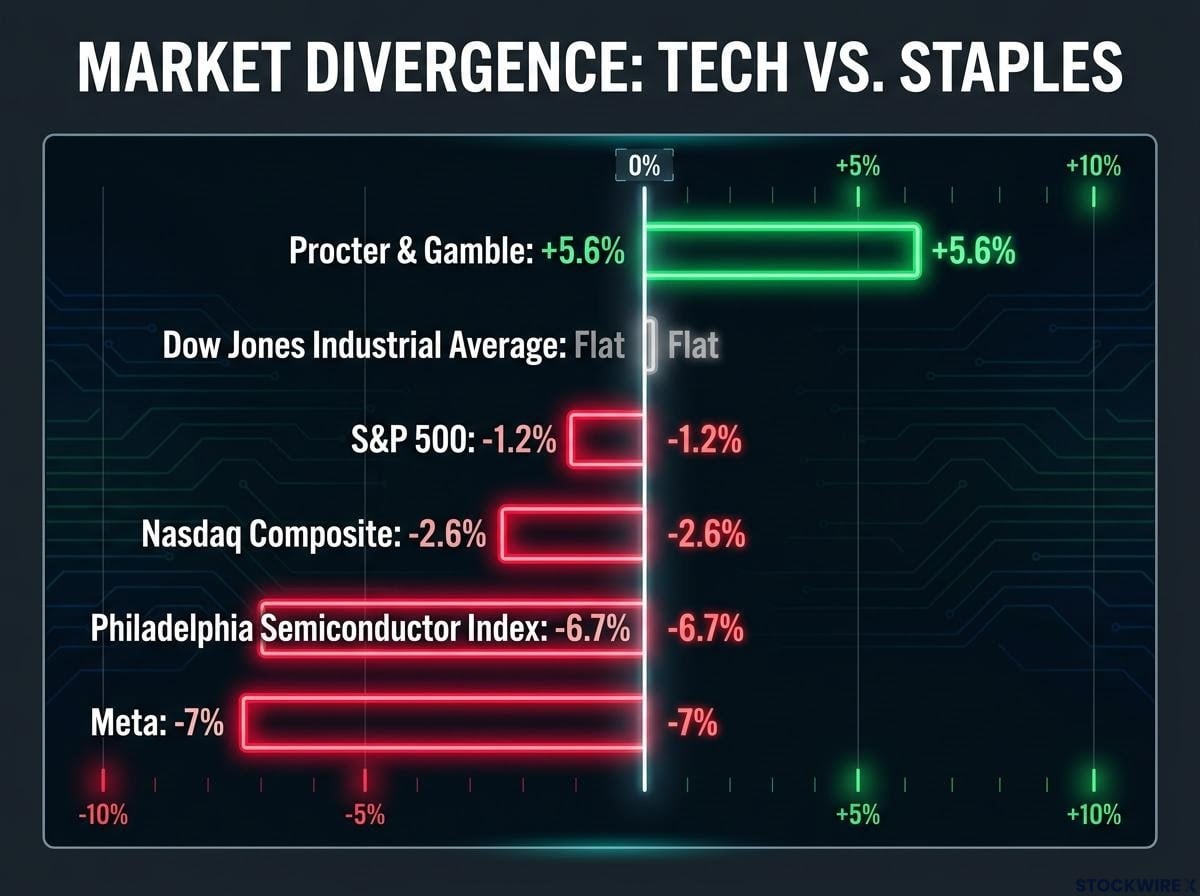
- Meta fell about 7% after announcing a new class of non-voting Class C shares
- Tesla dropped more than 3% after cutting its 2026 capital spending forecast
- Amazon and Nvidia each lost roughly 4%
- Procter & Gamble rose 5.6% to a near eight-month high after earnings per share of $2.00 beat the $1.89 consensus
Reports that SpaceX had proposed a merger with Tesla added noise, though no agreement has been reached.
A flat Dow beside a 2.6% Nasdaq drop tells you the market repriced one theme, not the whole economy. Before reacting, check how much of your own portfolio leans on AI hardware.
Why a good earnings beat did not help Meta and Tesla
Both companies beat expectations. Meta’s revenue came in above forecasts with an upbeat fourth-quarter sales outlook, and Tesla’s results also topped estimates.
Investors looked past the numbers. They read Meta’s share plan as a signal of how much capital its AI expansion needs, and Tesla’s capex cut as a retreat from its AI and robotics ambitions.
When good results get sold, sentiment has shifted. The reaction itself is the evidence.
The chip rout looks less like a demand collapse and more like the unwinding of a crowded AI trade, with record ETF inflows chasing the same narrative just before the index suffered its worst month since 2008.
When big ASX news breaks, our subscribers know first
What are AI spending doubts really questioning?
The easy reading is that AI demand has dried up. The data does not support that. The real question is whether returns arrive fast enough to justify the size of the build-out and the debt funding it.
Goldman Sachs has reportedly estimated that five major hyperscalers (the giant cloud operators such as Amazon, Microsoft and Meta) could spend about $1.2 trillion on capital expenditure next year, though that figure has not been independently confirmed. Capital expenditure, or capex, is money spent on long-term assets like data centres and chips. Kevin Shea, senior equity analyst at BNY Wealth, is reported to have framed the season’s central question as whether hyperscaler profits can grow faster than that spending.
Hyperscaler capital expenditure has been climbing quarter after quarter, and the debt used to fund it has run at roughly four times the five-year average, which is why any hint of slower spending lands so heavily on chip suppliers.
Investor questions, per Reuters Reuters analysis reportedly described investors questioning “the speed, the efficacy and the profitability” of AI infrastructure investment.
Chipmakers sit at the sharpest end of this chain. Their orders depend directly on hyperscaler capex, so any hint of slower spending lands on them first and hardest.
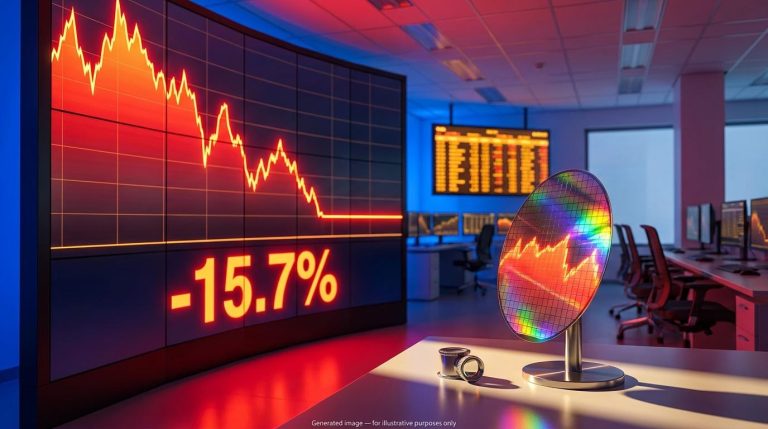
Financing strain adds to the worry. CoreWeave, one of the leveraged “neocloud” operators that rent out computing capacity, reportedly carries about $50 billion in debt, and its bonds have been reported trading at distressed levels. The chip index had also reportedly fallen about 15.7% over eight sessions, its longest losing streak since October 2008, before a brief rebound on 19 October.
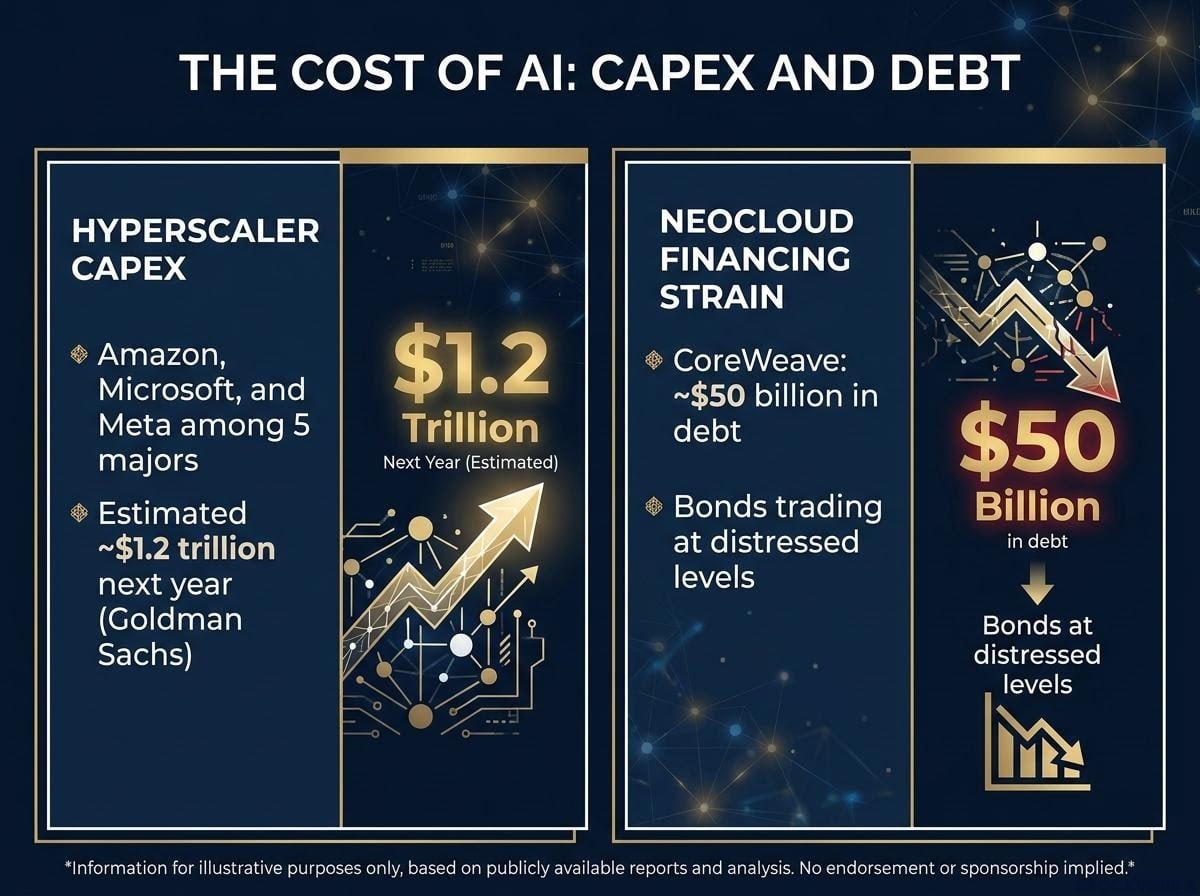
That points you towards balance sheets. If the problem is financing and payback timing rather than demand, the most leveraged AI names carry the most risk, and growth stories alone are not enough to judge them.
Pullback or bust? Two readings of the same data
The same facts support two very different conclusions:
- Healthy pullback signals: spending slowing from an exceptional pace, Reuters reportedly describing capex that could “come off the boil a little bit”, and Goldman reportedly upgrading CoreWeave to “buy” on constrained capacity
- Genuine bust signals: distressed debt among neocloud operators, good earnings sold anyway, and overbuilt capacity financed at unsustainable rates
This episode differs from the April 2025 “Liberation Day” selloff and the DeepSeek shock. It stems from financing costs and payback timing rather than tariffs or a single model announcement.
One quarter of results cannot settle which reading wins.
Why bonds rallied while oil spiked
Oil rising should push yields up, because higher energy costs feed inflation. On Thursday, yields fell hard instead.
The 10-year US Treasury yield dropped about 18 basis points to 4.97%, and the 2-year fell 16 basis points to 4.66%. A basis point is one hundredth of a percentage point. Later data cited a 2-year range of 4.73%-4.81%, so treat that figure with care.
Four forces pulled in different directions:
- Safe-haven demand: investors sold AI and chip shares and bought government bonds
- Growth repricing: slower AI investment means slower expected growth and lower expected policy rates
- Oil inflation risk: higher crude threatens inflation, which normally pushes yields up
- Rate expectations: earlier in the month, high energy prices had lifted bets on higher US rates
On the day, the first two overpowered the last two. The commodity moves show the cross-currents:
| Asset | Level | Move |
|---|---|---|
| Brent crude | $113.17 settlement (later Reuters update: $111.24) | +4% (Reuters update: +2.2%) |
| Gold | $4,060/oz (other source: approx. $4,074) | Down over 2% (other source: -0.44%) |
| Copper (LME three-month) | $14,293.50/t | Almost 3% lower (LME data: -0.44%) |
The gaps likely reflect intraday versus settlement timing and differing benchmarks. Brent reached a five-month high after Yemen’s Houthis attacked targets in Saudi Arabia, including an oil-field site. Copper hit a five-week low as London Metal Exchange (LME) warehouse stocks rose for a third straight day, and gold slid to a two-month low on fears that oil would keep rates higher for longer.
Read that combination carefully. Markets priced slower growth first and inflation second, so treat Thursday’s bond strength as a fragile signal that a further oil escalation could reverse.
Structural or cyclical: how long can the paradox last?
The structural view holds that attacks on Saudi infrastructure could keep energy prices elevated, prolong inflation and stop central banks from easing. The cyclical view sees Thursday as a liquidation of leveraged AI exposure, where weaker growth expectations swamp the inflation impulse.
If the structural view proves right, the bond rally fades and central banks stay hawkish.
What the global rout means for the ASX on Friday
Europe set the tone first. The STOXX Europe 600 fell about 1.1% to 637.74, its steepest drop in three weeks, as banks weakened, oil rose and French bond yields climbed. The FTSE 100 slipped 0.33% to 10,717.31.
Australia had already softened. The ASX 200 fell 0.4% to about 8,793 on Thursday, and futures were down 0.3% shortly after 7am, pointing to a weaker Friday open. The Australian dollar bought about 70.18 US cents.
The local twist is the Reserve Bank of Australia (RBA). Treasurer Jim Chalmers, in speech excerpts reviewed by Reuters, set out the trade-off:
“Higher interest rates and higher inflation are likely to mean softer growth and slightly higher unemployment.”
Chalmers also said business investment could rise by more than 5% this year. Underlying inflation is stuck at 3.6%, unemployment reached 4.7% in September, and markets were pricing about a 64% chance the RBA lifts the cash rate from 4.60% to 4.85%. Marc Jocum, senior strategist at Global X, reportedly flagged concern that the data-centre build-out is running ahead of its ability to deliver returns.
Higher Brent matters locally because oil price pass-through into freight, construction materials and services costs tends to keep inflation sticky, which is exactly the channel that could push the RBA towards another hike.
Miners, energy and defensives: where the pressure sits
Energy shares did not fully benefit from higher Brent, because the market focused on oil worsening inflation and keeping rates high. Copper’s slide weighed on materials, and gold offered little shelter on the day because it fell too.
For you as an Australian investor, a possible RBA hike alongside weak miners and energy means defensive and bank exposure may hold up better than rate-sensitive or resource-heavy holdings if the global selloff persists. On Friday, watch:
- ASX 200 futures direction into the open
- Brent crude and any further Middle East escalation
- US 10-year yields
- Chip stocks in after-hours and Asian trading
- RBA hike pricing
What the selloff changes, and what it does not
The through-line holds together. Doubts about AI payback drove the equity rout, growth fears drove the bond rally, and oil risk complicates any comfortable reading of either.
What it does not change is the unresolved core. Nobody yet knows when AI spending will turn into measurable profit, how far the Middle East escalation runs, or which way the RBA moves next.
Your decision rests on three variables: hyperscaler capex guidance, Brent’s direction and Australian inflation data. Weigh balance sheets over narratives while those play out. Note that figures here come from session-time and settlement sources that differ in places.
This article is for informational purposes only and should not be considered financial advice. Investors should conduct their own research and consult with financial professionals before making investment decisions. Past performance does not guarantee future results. Forward-looking statements are speculative and subject to change based on market developments.