Gold dropped more than 2% on Thursday to a ten-week low near $4,034, according to FXStreet, even as the US 10-year Treasury yield fell sharply. That breaks one of the market’s most familiar rules: lower yields usually lift the metal, not sink it.
The selloff came as money moved out of AI-linked technology stocks and into government bonds. At the same time, oil climbed on escalating Middle East tensions and fresh US jobs data kept a December Federal Reserve (Fed) rate hike heavily priced.
Price snapshots varied through the session. Charles Schwab had spot gold near $4,098.50, eOption near $4,069.50 and Trading Economics recorded lows around $4,050-$4,066. Every account points to the lowest levels since August.
Here is why gold fell, which forces carry the most weight, which may fade, and the price levels that decide what happens next.
Why did gold drop when Treasury yields fell?
On paper, the day looks contradictory. The 10-year yield fell about 15 basis points to 5.04%, according to FXStreet. Schwab and InvestorIdeas put it at 5.03%, with Schwab showing a drop of about 11 basis points. A basis point is one hundredth of a percentage point.
The contradiction falls apart once you look at the level rather than the direction. A yield above 5% still pays investors handsomely to hold bonds instead of gold, which pays nothing. Rick de los Reyes of T. Rowe Price, quoted by Morningstar, put the pullback down to higher interest rates.
The World Gold Council’s sensitivity estimate, roughly 1.75% of price for every 25 basis points of yield change, shows why the relationship between gold and bond yields signals pressure rather than a fixed price target.
Four mechanisms did the damage:
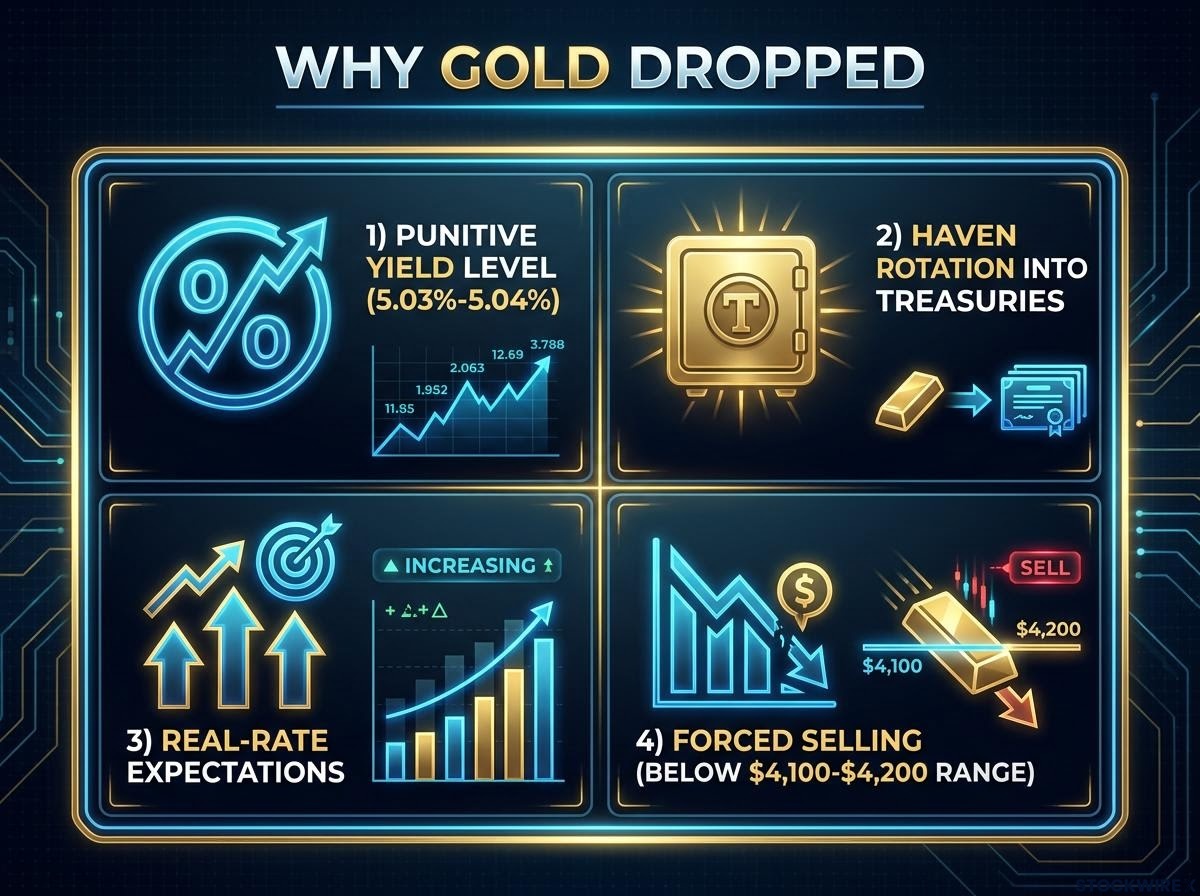
- A punitive yield level: even after falling, a 5% Treasury yield is a strong rival for capital.
- A haven rotation: investors chose Treasuries as their preferred liquid refuge, so the yield drop reflected bond buying, not a softer Fed.
- Real-rate expectations: gold can fall when nominal yields dip if markets expect higher inflation-adjusted policy rates ahead.
- Forced selling: once key levels broke, mechanical selling took over.
The dollar offered no cushion either. The US Dollar Index sat near 101.62, roughly flat.
For you, the lesson is simple: a falling yield is not automatically good news for gold. The level of yields and what the Fed is expected to do matter more than one day’s move.
Liquidation can override the usual playbook
Once gold slipped through the $4,100-$4,200 range, stop-loss orders and futures selling could accelerate the decline. One market account reported an 8% cut in speculators’ net long positions in the week to 6 October, though that figure has not been independently confirmed.
Precedent: In March 2020, the World Gold Council found gold fell alongside collapsing yields as leveraged liquidation and margin calls forced broad selling.
When big ASX news breaks, our subscribers know first
Where did the money go? AI credit worries and the rush into Treasuries
The bond bid that hurt gold started in the technology sector. Investors increasingly want proof that massive AI spending will pay off, and the borrowing behind it has become a credit-market problem.
Reuters reported that companies are taking on heavy debt to build data centres and computing capacity while their capital costs rise. Credit-default insurance, which protects lenders if a borrower fails to pay, hit record costs for some AI-exposed firms.
The money did not flow into gold. It flowed from tech equities into Treasuries.
That shift had been building. In its 15 October report, Reuters described Treasuries regaining their safe-haven status as the 10-year yield fell to 5.105%. Reuters also reported that BlackRock Investment Institute downgraded US equities to neutral and upgraded Treasuries, favouring short-dated notes.
Charu Chanana, Saxo: multi-decade-high long-term yields are removing the cheap financing that once supported AI valuations.
There is a counter-case that favours gold:
- Reuters noted gold could outperform if investors start reading high long-term yields as a sign of fiscal or sovereign-credit risk.
- Saxo commentary suggested violent yield reversals may reflect bond short-covering rather than a lasting policy shift.
Federal Reserve staff analysis has tied recent yield increases largely to higher far-forward risk premiums linked to deficits, a form of fiscal stress that can turn high yields from a gold headwind into a tailwind.
That tells you gold’s weakness here is a competition for liquidity and safety. If worries move from tech credit to government finances, the same trigger could later work in gold’s favour.
Oil, the Middle East and a Fed that is not easing
The second headwind came from the Gulf. Houthi forces claimed attacks on Saudi targets, including the Defence Ministry in Riyadh and an Aramco facility in Yanbu. The US State Department ordered non-emergency embassy staff and families out of Saudi Arabia, and market coverage cited an Iranian projectile sinking a container ship in the Strait of Hormuz.
Crude responded quickly. Brent reached $110.11 according to Business Standard and $111.75 according to eOption, while WTI rose about 1.8%-2.2% to roughly $99.30-$99.50.
| Measure | Level | Move | Source |
|---|---|---|---|
| US 10-year yield | 5.03%-5.04% | Down 11-15 bp | FXStreet, Schwab |
| WTI crude | $99.30-$99.50 | Up 1.8%-2.2% | FXStreet, Schwab |
| Brent crude | $110.11-$111.75 | Up 1.2% (Business Standard) | Business Standard, eOption |
| US Dollar Index | 101.62 | Roughly flat | FXStreet |
| Initial jobless claims | 194,000 | vs 200,000 expected | Kitco |
Brent above $110 revives the prospect of prolonged inflation. Domestic data reinforced it: jobless claims came in below forecast, with a four-week average of 197,750, and producer prices rose 6.3% year on year, with core prices up 0.7% (InvestmentNews, 15 October).
What the December hike odds really say
The probability readings differ, but they all point the same way.
| Source | Date | December hike odds |
|---|---|---|
| Prime Terminal | 22 October | Nearly 80% |
| CNBC | 19 October | About 90% |
| CME FedWatch (via InvestmentNews) | 15 October | About 93.8% |
The gaps reflect different methods and dates. October hike odds sat near 8%. University of Michigan sentiment data is due next, followed by next week’s Fed meeting and the Core PCE inflation index.
For you, the data says the Fed has little reason to ease soon. That is the single biggest headwind for gold in this move.
Key gold levels and what the long-term picture says
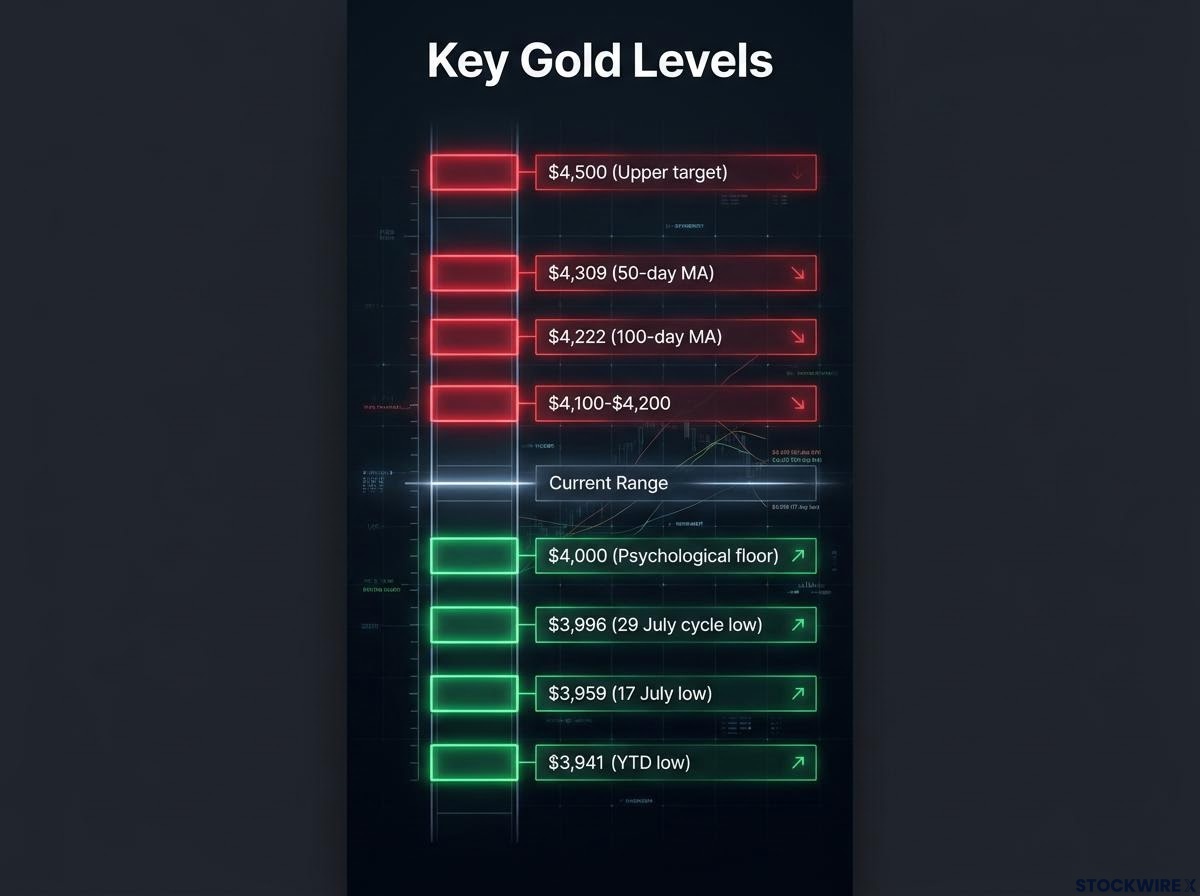
FXStreet’s technical read shows gold has broken below its $4,100-$4,200 range, with the Relative Strength Index (RSI), a gauge of buying and selling momentum, showing sellers gaining ground.
| Level | Type | Significance |
|---|---|---|
| $4,500 | Resistance | Upper target |
| $4,309 | Resistance | 50-day moving average |
| $4,222 | Resistance | 100-day moving average |
| $4,100 / $4,200 | Resistance | Must be reclaimed for a reversal |
| $4,000 | Support | Psychological floor |
| $3,996 | Support | 29 July cycle low |
| $3,959 | Support | 17 July low |
| $3,941 | Support | Year-to-date low |
This is the second ten-week low in recent days. BullionVault had the London PM benchmark near $4,090 on 14 October.
The structural picture remains mixed:
- Bull view: the World Gold Council reports central banks bought a record 1,136 tonnes in 2022 and 39 tonnes net in August.
- Bear view: if AI fears stay contained and Treasuries keep paying high yields, institutions may prefer income-producing debt.
- Neutral view: reported ETF inflows of about $10 billion in September and first-half central-bank buying of 345 tonnes have not been independently confirmed.
Sergio Nicoletti Altimari, Deputy Governor, Bank of Italy: gold remains a strategic reserve, and central-bank buying has weakened its traditional link to real yields.
The analytical reading is a cyclical correction on top of a still-bullish structure, not a certainty. A hold above $4,000 keeps the decline orderly; a break exposes the July lows. Long-term demand acts as a floor only while that buying continues.
Readers interested in the chart mechanics should see our deep-dive into reading gold’s support and resistance levels, which explains how Fibonacci zones and moving averages guide stop placement.
Past performance does not guarantee future results. These statements are speculative and subject to change based on market developments.
What Thursday’s drop settles, and what still depends on the Fed
Thursday’s slide was mainly a rate-expectations and liquidation event, with surging oil and the Treasury haven bid amplifying it. Falling yields did not contradict that story, because yields stayed above 5% and the Fed outlook stayed hawkish.
Three variables now matter most:
- Whether gold holds $4,000.
- Next week’s Fed meeting and Core PCE reading.
- Middle East headlines and their effect on oil.
History offers some context. In past episodes, a haven rush into Treasuries has first displaced gold and later supported it once the shock widened into a broader monetary or fiscal concern.
This article is for informational purposes only and should not be considered financial advice. Investors should conduct their own research and consult with financial professionals before making investment decisions.